Journal of the American
Medical
Informatics
Association
Volume 2
Number
6
Nov / Dec 1995
Internet-based Support for Bioscience Research : A Collaborative Genome Center for Human Chromosome 12 PERRY L. KEI
MILLER
CHEUNG;
LlSA CUPPELLI; BEATRICE
MD.
PHD,
MS., DAVID
PHD;
RENAULT,
RAJU KUCHERLAL
PRAKASH
C. WARD;
VALERIE
M. NADKARNI,
PHD.,
AMY
HERDMAN; IVONNE
PHD; SUNG-JOO
YOON, PHD;
BANKS;
MD,
KENNETH
PATRICIA
MARONDEI; KENNETH
K. KIDD,
BRAY-WARD;
KATE
I
MONTGOMERY;
S. KRAUTER;
PHD;
PHD; PHD.
PHD;
PHD
Abstract
This paper describes an approach that provides Internet-based support for a genome center to map human chromosome 12, as a collaboration between laboratories at the Albert Einstein College of Medicine in Bronx, New York, and the Yale University School of Medicine in New Haven, Connecticut. Informatics is well established as an important enabling technology within the genome mapping community. The goal of this paper is to use the chromosome 12 project as a case study to introduce a medical informatics audience to certain issues involved in genome informatics and in the Internet-based support of collaborative bioscience research. Central to the approach described is a shared database (DB/12) with Macintosh clients in the participating laboratories running the 4th Dimension database program as a user-friendly front end, and a Sun SPARCstation-2 server running Sybase. The central component of the database stores information about yeast artificial chromosomes (YACs), each containing a segment of human DNA from chromosome 12 to which genome markers have been mapped, such that an overlapping set of YACs (called a “contig”) can be identified, along with an ordering of the markers. The approach also includes 1) a map assembly tool developed to help biologists interpret their data, proposing a ranked set of candidate maps, 2) the integration of DB/12 with external databases and tools, and 3) the dissemination of the results. This paper discusses several of the lessons learned that apply to many other areas of bioscience, and the potential role for the field of medical informatics in helping to provide such support. JAMIA.
1995;2:351-364.
Affiliations of the authors: Department of Anesthesiology Center for Medical lnformatics (PLM, PMN, KC), Department Genetics (KKK, DCW, AB, PBW), Departments of Biology Psychiatry (KKK), and Department of Molecular Biochemistry Biophysics (DCW), Yale University School of Medicine, New ven, CT; and Department of Molecular Genetics (VH, IM, BR, RK) and Department of Cell Biology (LC, KM, KSK), Albert
and of and and HaSJY, Ein-
stein College of Medicine, Bronx, NY. Supported in part by NIH Grants R01 HG00175 and PO1 HG00965 from the National Center for Human Genome Research, by NIH Grant GO8 LM05583 from the National Library of Medicine, and by an equipment grant from the Sun Microsystems Corporation. Correspondence
and reprints:
Perry L. Miller,
MD, PhD, Center
for Medical Informatics, Yale University School of Medicine, P.O. Box 208009, New Haven, CT 06520-8009. e-mail:
[email protected] Received for publication:
4/03/95; accepted for publication:
7/10/95.
We are currently seeing a dramatic growth in the use of the Internet for many different purposes, including electronic mail, file transfer, remote information access, and, more recently, information browsing using tools such as Mosaic. Internet-based technology will play an increasingly important future role in support of biomedicine, both in areas of clinical medicine and in areas of bioscience research. From the perspective of bioscience, it will be particularly important to develop powerful tools to facilitate research collaboration between geographically separated laboratories at different institutions. Interinstitutional bioscience collaboration is becoming increasingly important as biologic research projects become larger in scope and require the combination of different types of expertise that may not all
352
MILLER
exist at one research center. This phenomenon is already seen within the international Human Genome Project, 1-3 where different techniques may be combined to produce the experimental data required to create genome maps. In addition, biologic research projects will increasingly want to study a phenomenon as a whole, combining a spectrum of different types of data (anatomic, physiologic, pharmacologic, genetic, etc.), as is currently illustrated in the national Human Brain Project.” Such data are often produced by different laboratories, each of which focuses on one or two aspects of a phenomenon as a whole. These laboratories may frequently be at different institutions. We are building and refining an Internet-based approach for informatics support of a genome center to map human chromosome 12, in a collaboration between the Albert Einstein College of Medicine (AECOM) in Bronx, New York, and the Yale University School of Medicine in New Haven, Connecticut. This paper describes our approach and discusses some of the lessons learned that may apply broadly to many other areas of biomedical research. The support of bioscience research collaboration provides an exciting and productive future direction for medical informatics as a field. The techniques and approaches described in this paper are similar to tools and approaches being developed in other genome mapping projects. The goal of this paper is to use the chromosome 12 genome center as a case study to introduce a medical informatics audience to certain issues involved in genome informatics and in the Internet-based support of a collaborative bioscience project, and thereby help anticipate the types of issues that will be increasingly encountered in the informatics support of many areas of bioscience.
Background The Internet is a powerful tool being used for many purposes that are potentially useful in support of biomedical research. One of the most fundamental uses involves electronic mail and file transfer, including the use of anonymous FTP servers, to allow communication and sharing of resources. In addition, there is a large and growing set of national data repositories accessible over the Internet, which are useful to bioscience. 5-8 These include .repositories for biologic sequence data, for gene mapping data, for protein structure information, and for many other, sometimes highly specialized, types of biologic data. Approaches to facilitate Internet-based browsing (network navigation and resource discovery) of these
ET AL.,
Internet-based
Genome
Collaboration
and other resources include Gopher, the World Wide Web (WWW), and wide area information servers (WAIS).9,‘o Informatics is well established within the genome mapping community as an important enabling technology. There are now roughly 20 genome centers in the United States supported by the National Institutes of Health (NIH) National Center for Human Genome Research and by the Department of Energy, and many other centers worldwide. At these centers, a wide variety of approaches are being taken to provide informatics support,“-‘” a fact that reflects in part 1) different biologic strategies taken to accomplish the genome mapping itself, and 2) different orientations regarding hardware platforms and software tools. Most of the centers are focusing primarily on providing informatics support for laboratories within a single institution. The type of client-server Internet-based architecture described in this paper represents a direction in which parts of the genome mapping field are heading, but one that has yet to be extensively implemented or described. The genome mapping terms used in this paper are described in the appendix.
Overviewof the GenomeMappingProcess The human genome contains approximately three billion base pairs of DNA, which encodes each individual’s genetic inheritance, and is estimated to include approximately 100,000 genes. The human genome consists of 23 chromosomes: 22 autosmal (nonsex) chromosomes and the sex chromosomes, which may be either X or Y. Each individual has two copies of each autosomal chromosome and two sex chromosomes, either XX (female) or XY (male). Our group is mapping human chromosome 12, which is approximately 135 Mbp (million base pairs) in length. The primary goal of our current three-year mapping project is to establish a set of markers called sequence-tagged sites (STSs) along chromosome 12, spaced roughly 100 to 150 Kbp (thousand base pairs) apart. This will require roughly 1,000 markers. The mapping of such markers will significantly facilitate the searching for genes, as well as the eventual sequencing of the chromosome. A future goal of the Human Genome Project as a whole is to sequence -the entire human genome, and to map and sequence the genomes of selected model organisms. There are a wide variety of biologic techniques that might -be used to help map a chromosome.16 The biologic strategy that our group has adopted is based on the use of a library of yeast artificial chromosomes
Journal of the American Medical Informatics Association
Volume 2 Number 6 Nov / Dec
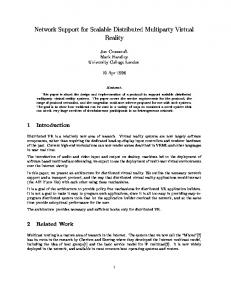
(YACs), which contain “cloned” human DNA. Such a library is prepared by breaking the human genome down into many overlapping fragments, and inserting those fragments of human DNA into yeast. We are using a YAC library prepared by the Centre d’Etude du Polymorphisme Humain (CEPH) in Paris, France, which contains thousands of YACs, each typically 400 Kbp to 1.2 Mbp in length. The biologic technique that we are using to .perform the mapping process involves the construction of YAC “contigs.” (This technique is being used by many genome centers.) A contig is a set of overlapping DNA fragments whose pattern of overlap has been established experimentally. In our case, the overlap pattern is established using a set of markers (each defined by a unique DNA sequence) on chromosome 12, and experimentally determining, by a technique called the polymerase chain reaction (PCR), which markers are found on each of a set of overlapping YACs. Since the overlapping YACs each begin and end at different positions along the chromosome, different YACs will frequently contain different sets of markers. Once enough such data have been produced for a set of overlapping YACs, one can then begin to infer the order of the markers along the chromosome, as well as the pattern of overlap of the YACs. Figure 1 shows a simplified example of this contigmapping process. Here, five markers (M, Q, S, W, and X) have been experimentally identified as being either present or absent on a set of three YACs. Although the laboratory experiments themselves indicate only which markers are present or absent on each YAC, by looking at the data as .a whole, one can deduce the marker order and the pattern of overlap. For example (assuming error-free data): 1. Looking only at the markers present on YACs 1 and 2, one can deduce that M and X must be between W and Q. The relative order of M and X, however, is unclear. 2. Looking next at the additional information provided by the markers present on YAC 3, one can now resolve the order of M and X. Marker X must be between M and Q. In addition, S must be on the other side of Q from X. Thus (WMXQS) is the only order consistent with the data as a whole in this simple example, although the orientation of this order along the chromosome (right to left vs left to right) cannot be determined from the data given.
(A)
1995
MARKERS M
Q
s
w
x
YAC
1
+
-
-
+
+
YAC
2
+
+
-
-
+
-
+
-
YAC 3
+
MARKERS
(B) W
M
X
Q
I
I
I
I
I I
S
YAC
YAC 2
YAC 3
.
Figure 1 A simplified example of yeast artificial chromosome (YAC) contig mapping, as described in the text. (A) A summary of experimental results, with ” +” indicating the presence of a marker on a YAC and “-” indicating its absence. (B) The contig deduced from the experimental data, showing the order of the markers and the pattern of overlap.
In practice, the interpretation of such experimental results is complicated by the presence of experimental error and uncertainty. Of particular concern are negative results caused by failure to identify the presence of a marker on a YAC, even though the marker is present in the corresponding region of chromosome 12. One reason for such a negative result is that there may be internal deletions in the segment of human DNA in a particular YAC. As a result, a marker (or a sequence of markers) may not be present in a YAC, even though markers on either side of the deleted marker(s) are present. Alternatively, the laboratory experiment testing for the presence of the marker on a YAC may have erroneously produced a negative result, even though the marker was indeed present. The presence of this experimental uncertainty means that it is necessary to have a high degree of redundancy in the YAC contig overlap to be confident of the map produced. Figure 2 shows an example of part of the set of YAC contigs we have produced in mapping chromosome 12.17 Notice that in this map there are several locations of presumed internal deletion (marked by empty square brackets “[ ]”) where one or more markers are seen on overlapping YACs, even though they have not been identified experimentally on the YACs containing the brackets. Once a significant amount of these types of data have been produced in a region of the map, it becomes
354
MILLER
ET AL.,
Internet-based
Genome Collaboration
Figure 2 An example of an actual yeast artificial chromosome (YAC) contig that we have produced for a region of chromosome 12. Along the top are marker names. The shape (and color when viewed with a color monitor) indicates the type of marker. The numbers (20 through 36) below the marker names indicate CentiMorgans, a measure of genetic distance along the chromosome. Each YAC is represented by a horizontal line, labeled with the YAC’s name. Along each YAC is shown all markers that have been experimentally identified on that YAC. The square brackets indicate regions where markers are absent, and suggest the presence of internal deletions within those YACs. (This figure shows the contig at one stage in its experimental evolution. An official version of our map of chromosome 12 is presented by Krauter et al.“) 17_
very difficult for a biologist to interpret them manually with paper and pencil. As discussed later in this paper, the computer can play an important role in helping to assemble regional maps consistent with the data.
lnformaticsSupportof the Collaborative GenomeCenterfor HumanChromosome12 To provide informatics support for a genome center, a number of related needs must be met. First is the need for coordination of the project itself. At the simplest level, this includes such capabilities as electronic mail among the participants and a centralized e-mail list for project members. At a more sophisticated level is the need for a shared database of experimental results. This shared database can provide a global overview of the different parts of the project and therefore can help in tracking how well the project is meeting its goals and what areas require attention. The shared database can also be used by indi-
vidual researchers to help them better ‘understand the data in the region of the chromosome where they are working to build an increasingly detailed map. In addition, informatics must link the genome center to the rest of the gene mapping community in several ways. One need is to provide access to external resources (such as national gene mapping data repositories) and to externally developed software tools, and to integrate access to those resources and tools as tightly as possible into the genome center’s software architecture. A second need involves making our chromosome 12 data available to the external community. Overview
of Our Genome Center’s Data Flow
Figure 3 provides a schematic overview of the data flow within the chromosome 12 genome center. The data are produced by laboratory experiments that identify the presence or absence of markers on YACs. Thus the principal data items entered into our da-
tabase (DB/12) are:
Journal of the American
Medical
lnformatics
Association
Volume 2
Number
6
355
Nov / Dec 1995
An Increasingly Refined Map Data Input and Validation
Laboratory Experiments
Map Assembly 4
Figure
3 A schematic overview
1. data items describing
each marker
2. data items describing
each YAC
of the data flow within
3. data items documenting the presence or absence of a given marker on a given YAC
MARKERS
I
As an example to illustrate the types of data involved, Figure 4 shows the data-entry screen for entering or editing the description of a marker. The biologists enter data items into DB/12 either by using screens such as this one, or by batch submission of data to
by clicking
on the down-arrow
icons.
A list
will
pop up in each
Notes :
Relationship
664-h-l1
PCR PCR PCR NEG PCR PCR PCR NEG PCR NEG PCR
720-h-11 723-g-6 748-g-2 748-g-3 752-d-2 803-e-6 817-h-l A1
Figure
type/subtype
Clone Name
715-c-12
12 genome center.
I
Choose a Marker
Miscellaneous
the chromosome
Reporting and Dissemination
Add New Clone
PCR
4 This screen is used to enter and edit data describing
the genomic markers in the DB/12 database. The information
includes each marker’s name (in this case, TEL), the type of the marker, and other information such as the pair of polymerase chain reaction (PCR) p rimer sequences that uniquely define the marker for experimental purposes. At the bottom of the screen is a list of the clones to which the marker has been mapped.
356
MILLER
ET AL.,
Internet-based
Genome Collaboration
Local client databases
Locally-based tools
Locally-based tools
4D
4D
4D
(Macintosh)
(Macintosh)
Computer
4D SQL
Locally-based tools
Server
(Macintosh)
Locally-based tools
4D (Macintosh)
Network-based tools and resources, e.g., GDB and Quickmap
network
a
Figure 5 A schematic overview of the information architecture we have developed to support the collaborative chromosome 12 genome center. be loaded directly into the database. To validate the data, the biologists print ‘out the data for a region of the map and compare them with the hard-copy data in their laboratory notebooks. Once the data have been entered, the computer can assist the biologists with the process of map assembly (constructing maps that order the markers). The map assembly process itself may in turn suggest specific further experiments to perform. This overall process produces an increasingly refined map of chromosome 12, as well as data that can be used administratively for tracking the project’s progress and for dissemination to external gene mapping researchers. The central tables of the DB/12 database (as of September 1995) contain information about: 986 markers on chromosome
12
2,293 YAC clones and 181 cosmid clones on chromosome 12 (a cosmid is a form of cloned DNA smaller than a YAC) 7,632 marker-clone results, each indicating that a particular marker has or has not been identified on a particular clone These mapping data are currently produced by several biologists working at AECOM and by one working at Yale. In addition, a more modest amount of
another type of mapping data (fluorescent in-situ hybridization data) is also produced at Yale, but is not currently entered into the database. Database Architecture Figure 5 shows the overall information architecture used to build the shared database (DB/12) for the collaborative genome center. At the center of the approach is a relational Sybase database (Sybase Inc., Emeryville, CA) running on a UNIX machine (a Sun SPARCstation-2, Sun Microsystems Corp., Mountain View, CA) at the Yale Center for Medical Informatics. This database is accessed in client-server fashion from Macintosh computers in the participating laboratories. Laboratories at Yale access the server via Yale’s ethernet. Laboratories at AECOM access the server over the Internet, which connects AECOM’s ethernet to Yale’s ethernet. The Macintosh client machines run the 4th Dimension (4D) database package (Acius Inc., Cupertino, CA) as a user-friendly front end. This overall 4D/Sybase design has the advantage that the various database components can be developed as local 4D applications on a single Macintosh within a pilot laboratory. This approach is helpful because 4D provides powerful tools to allow the rapid prototyping of graphic interface screens, and the easy modification of those screens. For example, this screen development and modification can be done graphically, moving the various components from a palette
Journal of the American
Medical
Informatics
Association
Volume 2
Number
6
Nov / Dec 1995
to the desired screen location with a mouse, and sizing them to fit. The 4D application can then be alpha- and beta-tested by users until it is refined and polished to meet their needs. Once the application has been fully refined and polished locally on a Macintosh, the data are ported to Sybase and the internal code is modified to allow client-server interaction. To the biologic user, the local Macintosh and client-server versions look essentially identical.
therefore organized the data certainty, gists that
The integration of the 4D front end with the Sybase server is facilitated using two tools. One tool is “4D tool from SQL Server,” a commercial client-server the producer of 4D, which is specifically designed to help integrate 4D with Sybase. The second fool is SQLGEN, a package that we developed that allows SQL commands to be composed dynamically from a tabular description of DB/12‘s schema. When the client machine first connects to the server, it reads this schema. The schema is then used in generating subsequent SQL queries. The advantage of this approach is that the structure of DB/12 can later be refined and modified (assuming no major restructuring has occurred) without needing to modify the client code that accesses the database.
1. The biologist first selects a region of the map to be analyzed by indicating two markers, one on each side of that region.
Map Assembly In implementing our overall approach, the most sophisticated need is to help the biologists understand the genome mapping implications of their data. Each biologist typically focuses on one or two regions of the overall map, and works experimentally to build a growing set of YAC contigs in each region. This contig-building process involves 1) identifying an increasing number of YACs in a region, and 2) identifying an increasing number of markers present on those YACs. Once a sufficiently robust contig overlap has been achieved in one area of a region, the biologist’s attention ‘then turns to other areas, for example: 1) where more redundancy is needed to interpret the data confidently, 2) where there is still a great deal of experimental uncertainty in the markers identified on different YACS, or 3) where there are gaps between contigs. Where gaps exist, additional .YACs need to be identified, and those new YACs then need to be integrated into the map by identifying markers on them that indicate overlap with the existing map. In this way, the contigs on either side of a gap are incrementally extended with the goal of eventually closing the gap. As the amount of data in a particular region grows, it becomes very difficult for the biologists to think through all the possible implications and permutations using paper and pencil. The computer can
play an important role by displaying an set of alternative contigs consistent with in that region. Even in regions of relative the computer can help reassure the biolotheir interpretation of the data is correct.
To allow the computer to play this role, we have built a map assembly software tool that functions as follows.
2. The program then area. The biologist two groups. The will be held fixed ative position of data.
lists the markers in the selected can separate those markers into order of one group of markers by the computer, while the relthe other markers is fit to the
3. The map assembly algorithm uses the DB/12 data (marker-clone results) to derive a minimal spanning tree 18 that connects the markers. This analysis typically yields the relative order of most, but not all, of the entire set of selected markers. The remaining markers are placed by generating all possible permutations of their positions. The resulting maps are then ranked based on their “goodness of fit” to the data (the fewer the deletions that must be postulated, the better the fit). Particularly when there is experimental uncertainty in a region, there are often several alternative contig maps consistent with the data. In these alternative maps, the order of certain markers differs, and a different set of possible internal deletions is typically implied. A list of alternative contig maps, with their ranked scores, is then presented to the biologist, who views the maps. This process may identify an obviously superior map (based on the “goodness of fit”), or may help pinpoint productive areas for further mapping experiments to resolve the uncertainty. Several computer-based tools have been built to help with this type of contig map assembly task.19,21 In building our map assembly tool, we have focused on providing the biologist with a great deal of flexibility to explore different maps potentially consistent with the data in an interactive fashion. In a few minutes, the biologist can obtain a. comprehensive set of al-
358
MILLER
ternative interpretations. With the use of paper and pencil this process could take hours of frustrating analysis, which would be prone to human error and which would provide little assurance that all reasonable alternative maps had been systematically identified. As described below, once the computer has provided a set of alternative maps, the biologist can focus on performing additional laboratory experiments to resolve the ambiguity between those maps. The Map Assembly
Tool in Operation
Figure 6 shows an example of the map assembly tool in operation. A region of the map that contains 14 markers and involves a great deal of uncertainty can be seen. It appears that several of the YACs have internal deletions, perhaps due to some unknown biologic feature present in that area of the chromosome. Figure 6 shows the two best-ranked maps consistent with the data. In preparing these maps, the biologist has requested that the order of nine markers (flagged by arrows at the top of Figure 6) be held fixed, and that the order of the remaining five markers (929ell-R, MFD259, 952a2-L, AFM147yb8, and CGATAllH) be fit to the data. The proposed order of the markers is shown at the top of each map. The two maps differ in that they reverse the order of two adjacent markers (AFM147yb8 and 952a2-L). Below the markers are shown the YACs on which the markers have been identified. The tool is specifically designed to highlight the areas of uncertainty, Along each YAC, black and grey boxes (which show up as red and yellow on a color monitor) indicate locations where the corresponding marker (directly above) has not been identified as being present on that YAC. (Black boxes indicate that the marker has been entered into the database as absent. Grey boxes indicate that the marker has not been entered into the database as either present or absent.) As a result, these boxes indicate where there must be internal deletions on that YAC (or experimental error) for the data to be consistent with the marker order shown at the top of the map. Having the computer automatically create these maps in a few minutes vastly simplifies the task of interpreting the data for the biologist. In some map assembly analyses, one map candidate might require the presence of several more deletions than another map candidate, and therefore would fit the data less well. In Figure 6, both maps fit the data equally well. Looking at these two maps, however, several features are seen that may help the biologist. 1. In map A, YAC 983-a-2 has one grey box, whereas
ET AL.,
Internet-based
Genome
Collaboration
it has two grey boxes in map B. As a result, one easy first step for the biologist to help determine which map might be correct would be to confirm whether the marker AFM147yb8 was indeed not present on that YAC. In map A, YAC 737-a-1 (shown at the bottom of the map) has an internal deletion, whereas in map B, that YAC (shown at the top of the map) has no deletions. To help resolve the ambiguity between the maps, the biologist might next try to make new markers from the two ends of that YAC, and then try to map those markers to each of the nearby YACs. This would produce a higher marker density and could help resolve the ambiguity between these two possible maps. Similarly, YAC 929-e-11 (near the top left corner of each map) has a deletion in map A and no deletion in map B. Here again, the biologist might next try to make new markers from the ends of that YAC, and attempt to map those markers to each nearby YAC to help resolve the ambiguity. this fashion, the map assembly tool can help the biologist understand the data, and can also focus attention on specific further experiments that may help resolve uncertainty. An additional use of this tool allows the biologist to fix the order of all the markers in a region, view the resulting contig, and then make iterative changes to that order to see how the contig is affected. Integration
of External
Resources and Tools
There are a number of existing resources in the gene mapping field that need to be integrated into the informatics support of our genome center. We provide this integration in two ways: 1) via fully integrated queries of our database and external resources, and 2) via automated activation of external resources from within our database, with automatic passing of any required data. Fully Integrated
Querying
Our database is currently set up to allow a limited degree of fully integrated querying of DB/12 and the Genome Data Base in Baltimore (GDB) (which serves as a centralized genome mapping data repository for the field as a whole),’ both of which are implemented in Sybase and allow SQL access. To allow this integration, we have extended our SQLGEN to include the schema of a subset of the GDB database, as well as DB/12’s schema. An example integrated query is:
Journal
of the American
Medical
Informatics
Volume 2
Association
Number
6
359
Nov / Dec 1995
(A) 626~1~3
754-b-10
958-b-6
723-g-6 017-h-l
738-b-11
715-c-12
852-a-7
819-h-11
603-0-6
752_d_2 012-d-5
954-g-1O 964-C-10
983-a-2 831-h-10
938-O-2 756-d791-a-7
740-g-2 800-b-B
905-d-5 740-g-3
924-h-12
817-l-6 924 h 12
Figure 6 As described in the text, this figure shows how the map assembly tool can propose alternative contig maps (A The small and B) consistent with the data in a region of chromosome, focusing attention on the areas of uncertainty. rectangles indicate positions where the corresponding marker (shown at the top of each map) has not been identified on a yeast artificial chromosome (YAC). (When viewed on a color monitor, the dark boxes are red and the grey boxes are yellow, thereby enhancing the readability of the map.)
“Given two markers on the chromosome 12 map, take all DB/12 markers located between those two markers and retrieve from GDB any information about alleles and PCR primers for all those markers.” To respond to this query, the system first gathers marker data from DB/12 and then uses those data to retrieve
related data from GDB. The data retrieved from both databases are then presented to the user in an integrated tabular form. A similar tool performs an integrated query of DB/12 and a gene mapping data set from the Whitehead Institute that is available on the network as a flat file. In this fully integrated mode
360
MILLER
Clone* Clone- -Type 748 a 3 YAC 817hl YAC 906 h 8 9 17 f 6 j36e2 952 a 2 958 b 8 664 h 11 715 c 12 20 h 11 &9hl1 Z4 h 12 964 c 10 545 d 4 12306 z2d2 803 P 6 852 a 7 748 CI 2 905 d 5 912 d 5
YAC YAC YAC YAC YAC YAC YAC YAC YAC YAC YAC YAC YAC YAC YAC YAC YAC YAC YAC
Marker TEL TEL TEL TEL TEL TEL TEL TEL TEL TEL TEL TEL TEL TEL TEL TEL TEL TEL TEL TEL TEL TEL
Marker-Subtype Gene Based Gene Based Gene Based Gene Based Gene Based Gene Based Gene Based Gene Based Gene Based Gene Based Gene Based Gene Based Gene Based Gene Based Gene Based Gene Based Gene Based Gene Based Gene Based Gene Based Gene Based Gene Based
ET AL.,
Internet-based
GDB* D12S1114 D1251114 D1251114
Genome Collaboration
GenBank'
A total of 22 were retrieved
Figure 7 This screen shows how our World Wide Web (WWW) interface (described in the text) displays mapping data in tabular form. The user can request this information in several ways (e.g., by entering the name of a marker or a clone, or by entering the names of two markers that flank a region of interest). In this example, the user has asked for all data involving a marker named “TEL,” the same marker seen in Figure 4. Each line of output describes one clone-marker result, including the clone, the clone type [in this case, all are yeast artificial chromosomes (YACs)], the marker (in this case, only TEL), and other information about the marker. The user can retrieve additional information from external networkbased resources such as the Genome Data Base in Baltimore (GDB), GenBank, or QUICKMAP by clicking on any underlined field.
of interaction, the user initiates a query and views the results without seeing any explicit indication that multiple databases have been consulted. Automated
Activation
of External
Resources
Another mode of integration allows external resources to be activated from inside 4D, with automatic passing of data from DB/12. For example, CEPH has developed a program called Quickmap that runs on a UNIX machine and provides information about the CEPH YAC library. We have implemented a capability that allows a DB/12 user to highlight a YAC within DB/12, and then click on a button to pass that YAC’s name automatically over the network to a script we have written that calls Quickmap recursively. This script then returns a list of CEPH YACs that are likely to be neighbors of the highlighted DB/12 YAC. A similar capability within our WWW interface allows the user to click on the GDB locus symbol ID of a marker and thereby launch an automatic query of GDB for that marker, and to perform similar retrieval from several other public databases.
Report Generation
and Dissemination
of the Data
Once a critical mass of data is in the database, it is important to provide relatively simple, intuitive tools for data retrieval and display. We provide these tools through 4D and through a WWW interface. The 4D interface is designed for use by the project participants. The WWW interface (URL:http://paella.med. yale.edu/chrl2/Home.html) is primarily designed for use by the external community, providing access to only that subset of the data that is ready for public release. (To allow this, each marker is flagged as to whether it is “public.“) A password-mediated version of the WWW interface, designed as an ‘alternative viewing tool for internal project use, is also available and provides access to all the data. We have tried to make this WWW interface (Fig. 7) very simple and intuitive so that even a computer-naive biologist
would find it easy to understand and use. To provide
robust viewing
of the data, it was nec-
essary to add an additional component to the database, a list of the presumed order of those markers that have been mapped.
As the mapping
process
Journal of the American
Medical
lnformatics
Association
Volume 2
continues, this list will be incrementally extended and revised. Using this list, users are able to request information about a region of the map (by specifying two markers that bound the region), a critical capability to allow the database to assist in the genome mapping process.
LessonsLearned This section discusses several of the lessons learned in the process of building the overall approach described above. We anticipate that these lessons may apply broadly to other areas of bioscience. Issues in Defining Shared Database
the Goals and Scope of the
In providing database support for a genome mapping project (and for many bioscience projects), there is a range of different needs one can attempt to meet. At one end of the spectrum, one can attempt to build a very flexible automated laboratory notebook to capture all experimental data in electronic form. At the other end of the spectrum, one can attempt to build a project data repository that will contain the major results of the experimental process, but not all the results of the experimental steps along the way. Exactly where on this spectrum one chooses to work in support of a particular bioscience project will depend on a variety of factors, including 1) the amount of resources available to the informatics component of the project, 2) the degree of computer sophistication of the biologic users, 3) the complexity of the project as a whole, and 4) the informatics goals of the project. In our project, we had relatively modest resources available for informatics activities (between one and two FTE). In addition, our biologists were in general unfamiliar with computer technology. As a result, although we started out planning to provide support for a variety of components of the project, including the collection of certain intermediate experimental results, over time we have directed our primary initial focus on building a project data repository of markerclone results, as described previously. It became clear that this was the central core of the database that absolutely had to work successfully, and, as a result, this is where we have focused most of our efforts to date. As a result of this focus, there is a great deal of preliminary experimental work that is not recorded online, but is recorded in conventional laboratory
Number
6
361
Nov / Dec 1995
notebooks. The database contains the positive and negative YAC-marker results, but not all of the many experimental details that went into deriving those results. Our approach does, however, allow the computer 1) to help the biologists in the complicated process of constructing contig maps consistent with their data, 2) to produce reports that track the overall progress of the project, and 3) to make available online those data required by external researchers in the field. In this way, we are able to meet our major goals. A Critical Mass of Functionality Is Needed to Motivate Biologists to Use the System It took us approximately 11/2 years to get the basic components of the database fully functional in clientserver mode, including the data entry routines, the report generation routines, and the map assembly tool. During this period, the biologists were incrementally producing data. It proved difficult, however, to motivate the biologists to enter their data into the computer and check them for accuracy in a systematic fashion until they perceived that the system had real functionality to offer them in return. Once it became clear that the computer could be of great help in interpreting their complicated contig mapping data (and indeed could save them a great deal of frustrating analysis with pencil and paper), then this situation changed and they became highly motivated to enter their data accurately into the computer. The moral of this experience is that the central core of the database and the central core of its major analytic tools need to be fully operational before the biologists will want to use the database. In retrospect, this was predictable. Because of this phenomenon, it makes sense to build informatics support of a biologic project incrementally. In other words, one should start with a central core of functionality that the biologists need, build that core, and get it fully operational. Once that has been done successfully, then expand the focus of the project to other areas. (An alternative approach would be try to build a more ambitious system all at once. The difficulty here is that with a fixed set of resources available, it would take longer to get the project to the critical mass of functionality that would motivate the biologists to want to use it.) Collaborating Network
via the Internet
versus a Local Area
In addition to the DB/12 database described in this paper, we have implemented several other genetics-
362
MILLER
related databases that operate in the same clientserver fashion using 4D; Sybase; and SQLGEN, but that communicate only over Yale’s local area network (LAN) and run only at Yale. From our experience, it is clear that implementing such an approach over the Internet poses additional challenges beyond those experienced when using an institutional LAN. One issue concerns the Internet response time. Before we started the project, we tested the Internet response time between AECOM and Yale in a thorough but nonrigorous fashion, and determined that it should be satisfactory for our needs. In the mean time, however, Internet use has grown dramatically, and Internet response in the New York area is particularly problematical. As a result, applications that work smoothly when developed and debugged over the Yale ethernet may initially prove to have unacceptable delays when brought up at AECOM, particularly at certain times of the day, such as the early afternoon. We have worked to address this problem in a number of ways, including optimizing and rewriting certain portions of the code. In addition, as we were making these modifications, AECOM itself changed its connection to the Internet from a Tl link to a T3 link. With these changes, response time at AECOM is now acceptable, but can be noticeably less rapid-than at Yale. A more fundamental issue involves the need to work closely with the biologic users when developing and refining the overall approach. This issue is particularly important once the initial design and implementation of the database is complete, as the biologists start to help refine its function and to use it in their work. During this period of time, the two database developers (who are both based at Yale) found it necessary to spend one full day roughly every week at AECOM to test the system for bugs that were not apparent locally, and to interact with the biologic users. This frequent interaction was feasible for us in part because Yale and AECOM are only one hour of driving time apart. Had the two institutions been much farther apart (e.g., in different parts of the country, which will increasingly be the case in multi-institutional bioscience collaborations), such weekly trips during critical periods (which we consider to have been vital to the success of the project) would have been much less feasible, particularly if several institutions had been involved. An interesting potential solution to this problem could involve the use of computer-based tools to facilitate remote software development and refinement. Several such tools are currently being developed as com-
ET AL.,
Internet-based
Genome
Collaboration
mercial products. For such a tool to be successful for our purposes, it would ideally allow a program to be run on a machine either at Yale or at AECOM, and would let users at both sites see the same graphic user interface and, if possible, both interact with that interface with a mouse. In addition, it would be very helpful if the individuals at both institutions could hear and see each other (perhaps through a relatively low-end video teleconferencing capability), and if they could write and view graphic diagrams and share documents through the computer as well. In a more widely dispersed collaboration than ours, the use of such technologies may prove mandatory to allow the development and refinement of the informatics tools needed to support the project as a whole. Biologic versus Computational Experimental Uncertainty
Resolution
of
An interesting issue that is seen in comparing a number of different genome mapping projects is that there is a potential trade-off between the use of biologic techniques versus computational techniques to resolve experimental uncertainty. In fact, the choice of the overall biologic strategy taken to the genome mapping process can force the project toward one end of this spectrum or the other. At one extreme, one can generate a huge amount of data with a large amount of uncertainty and then try to resolve this uncertainty with a large amount of computation. For example, one of the first chromosome mapping projects 22 (to map human chromosome 16) produced tens of thousands of cosmids (short pieces of cloned DNA roughly 30 to 40 Kbp long), each of which was “fingerprinted” by identifying a variety of patterns on it. On the assumption that these cosmids could then be assembled into one or more mammoth contigs, the computer was used to identify all possible overlaps of the cosmids based on the fingerprint data. This turned out to be possible to a large degree, but a significant amount of uncertainty still remained. After the start of the chromosome 16 effort, researchers in the field discovered that much longer segments of human DNA could be contained in YACs for use in genome mapping, as our genome center is doing. Using YACs, one can perform the chromosome mapping process in a much more deterministic fashion. At each step of the map-building process, the computer can help the biologist understand the local areas of uncertainty that exist in regions of the map (as described previously). The biologist can then use this feedback to perform additional experiments in the laboratory to help resolve that uncertainty. In such
journal of the American
Medical
lnformatics
Association
Volume 2
a project, the amount of experimental uncertainty at any one time is much less than in the chromosome 16 approach, and is incrementally resolved as the experimental process proceeds. As a result, one is never confronted with a massive computational problem to solve, but rather with a series of incremental computational problems, each of which is constrained. One can anticipate that this type of trade-off is likely to occur in other bioscience fields in the future.
Discussion As discussed earlier, we feel that there will be future opportunities to provide sophisticated informatics support in many areas of bioscience, and that this could prove to be a robust and productive growth area for medical informatics as a field. As very large and rapidly growing quantities of biologic data accumulate in many specialties, there will be diverse opportunities for informatics personnel to work closely with bioscientists. The challenges will include: 1. to store the massive quantities of data in such a way that they can be efficiently accessed for many different types of analyses; 2. to carry out the massive amounts of computation that will likely be required for many analyses of those data; needed 3. to deal with the issues of “interoperability” to allow multiple databases and multiple software tools to be linked dynamically for many different purposes; 4. to link laboratories at different sites that need to share experimental data in research collaborations in a highly integrated fashion; and
Number
6
Nov / Dec 1995
363
relates specifically to one bioscience discipline, then it probably belongs within that discipline. On the other hand, if a task involves issues and techniques that apply broadly across many areas of bioscience (as does our genome informatics project), then that task would fit well in an academic biomedical informatics unit. In practice, it is likely that different institutions will evolve different answers to this question. In addition, the approach taken will probably evolve. In fact, some activities that begin as part of a biomedical informatics unit may migrate over time into specific bioscience disciplines, as the informatics work becomes increasingly central to the success of the biology itself. It is nevertheless our belief that we will soon see a dramatic increase in computer-related activity required to support bioscience research, and that academic biomedical informatics units will be able to play an important role, working closely with scientists from many fields.
Conclusion We have described an approach to providing Internet-based informatics support to a collaborative genome mapping project. We believe that the issues involved will be seen in many areas of bioscience, as increasingly large amounts of diverse data are produced that need to be integrated, and as the laboratories involved are frequently at different institutions. As the Internet and its successors make such interinstitutional collaboration possible, the nature of research will probably change in many ways. As such collaborations multiply and as such efforts can be increasingly tightly integrated via computer networks, the prestige and resources of one’s Internetbased collaborators may eventually become more important to one’s own success and productivity than the prestige and resources of one’s parent institution.
5. to couple computer models of biologic phenomena to laboratory experiments in sophisticated ways, often involving interinstitutional collaborations. An important question for medical informatics as a field concerns the most appropriate institutional home for this type of bioscience informatics activity. To what degree does this activity belong within the specific bioscience departments themselves, and to what extent does it belong in a more general academic unit of biomedical informatics? There is no easy, straightforward answer to this question. To a certain extent, the answer depends on the nature of the specific informatics task. If that task is very complex and
1. Understanding Our Genetic Inheritance. The U.S. Human Genome Project: The First Five Years FY 1991-1995. DOE/ER0452P. Springfield, VA: National Technical Information Service, U.S. Department of Commerce, 1990. 2. Lander ES, Langridge R, Saccocio DM. Computing in molecular biology: mapping and interpreting biological information. Computer. 1991;24:6-13. 3. Pearson ML, Soll D. The Human Genome Project: a paradigm for information management in the life sciences. FASEB J. 1991;5:35-9. 4. Pechura CM, Martin JB, eds. Mapping the Brain and Its Functions: Integrating Enabling Technologies into Neuroscience Research. Washington, DC: National Academy Press, 1991.
364
MILLER
CEPH
Internet-based
Genome Collaboration
14. Goodman N. Genome informatics. New Biologist. 1991;3(11):1021-3. 15. Pearson PL. Genome mapping databases: data acquisition, storage and access. Curr Opin Genet Dev. 1991;1:119-23. 16. Billings PR, Smith SL, Cantor CR. New techniques for physical mapping of the human genome. FASEB J. 1991;5:28-34. 17. Krauter K, Montgomery K, Yoon SJ, et al. A second generation physical map of human chromosome 12. Nature. 1995;377:317-
5. Fuchs R, Cameron GN. Molecular biological databases: the challenge of the genome era. Prog Biophys Mol Biol. 1991;56(3):215-45. 6. Emmert DB, Stoehr PJ, Stoesser G, Cameron GN. The European bioinformatics institute. Nucleic Acids Res. 1994;22(17):3445-9. 7. Benson DA, Boguski M, Lipman DJ, Ostell J. GenBank. Nucleic Acids Res. 1994;22(17):3441-4. 8. Fasman KH, Cuticchia A], Kingsbury DT. The GDB human genome data base, Anno 1994. Nucleic Acids Res. 1994;22(17):3462-9. 9. Obraczka K, Danzig PB, Li SH. Internet resource discovery services. Computer. 1993;Sept:8-22. 10. Krol E. The Whole Internet: User’s Guide and Catalog. Sebastopol, CA: O’Reilly & Associates, 1992. 11. Myers R, Porteous D, Roberts R, eds. Abstracts of Papers Presented at the 1992 Meeting on Genome Mapping and Sequencing. Cold Spring Harbor, NY: Cold Spring Harbor Laboratory, 1992. 12. Myers R, Porteous D, Waterston R, eds. Abstracts of Papers Presented at the 1993 Meeting on Genome Mapping and Sequencing. Cold Spring Harbor, NY: Cold Spring Harbor Laboratory, 1993. 13. Myers R, Porteous D, Waterston R, eds. Abstracts of Papers Presented at the 1994 Meeting on Genome Mapping and Sequencing. Cold Spring Harbor, NY: Cold Spring Harbor Laboratory, 1994.
Genome
ET AL.,
33. 18. Corman TH, Leiserson CE, Rivest RL. Introduction to Algorithms. Cambridge, MA: MIT Press, 1990. 19. Cuticchia AJ, Arnold J, Timberlake WE. ODS (ordering DNA sequences): a physical mapping algorithm based on simulated annealing. Comput Appl Biosci. 1993;9(2):215-9. 20. Magness C, Xu Y, Green P. SEGMAP: an interactive computer program for generating YAC-based STS-content maps. First International Workshop on Human Chromosome 7 Mapping, Marburg, Germany. Cytogenet Cell Genet. 1994;(1-2):63. 21. Daly MJ, Reeve MP, Kaufman A, Orlin J, Lander ES. CONTIGMAKER: software for physical map contig assembly. Available for downloading via anonymous ftp from genome.wi.mit.edu in the directory /distribution/software/ Contigmaker0.9 22. Cinkosky M, Dougherty R, Faber V, et al. Robust contig construction. In: Human Genome: 1991-92 Program Report. DOE/ER-0544P. Springfield, VA: National Technical Information Service, U.S. Department of Commerce, 1992, p. 141.
Mapping
the centre d‘Etude du Polymorphismc Humain. a human genome mapping center in Paris, France, that produced the YAC library that we are using to map human chromosome 1.2.
Clone
a segment of DNA that has been cloned.
Cloning
the process of taking a segment of DNA and inserting it into a bacterium or some other organism, so that many copies of the DNA segment can be produced for use in laboratory experiments.
Contig
a set of overlapping DNA fragments (in our case, YACs) whose pattern of overlap has been experimentally determined.
Cosmid,cloning
a technique for cloning DNA in ESch erichia coli. The segment of DNA is typically 30 to 40 Kbp in length.
GDB
the Genome Data Base genome mapping data repository in Baltimore, Maryland.
Genome marker
a genome location where there is a DNA pattern that can be experimen-
Terms tally identified, by one of a variety of techniques. In our project, each marker is defined by a unique DNA sequence.
Human genome
the complete somes.
Kbp
thousand base pairs.
Map assembly
the process of analyzing experimental mapping data to propose an order of markers and/or clones consistent with those data. In our project, the map involves an ordering of markers in a region of chromosome 12. and a corresponding pattern of overlap within a YAC contig.
Mbp
million base pairs.
PCR
the polymerase chain reaction, a versatile biologic technique that we are using to test for the presence of a genome marker on a YAC.
YAC (yeast artificial mosome) cloning
chro-
set of human chromo-
a technique for cloning DNA in yeast. The segment of DNA may be 1 Mbp or more in length.