and/or low carbohydrate intake, or high fat intake may alter microbial .... in free living young populations, no further details are available accord- ing to other key ...
articles
nature publishing group
Intervention and Prevention
Interplay Between Weight Loss and Gut Microbiota Composition in Overweight Adolescents Arlette Santacruz1, Ascensión Marcos2, Julia Wärnberg2,3, Amelia Martí4,5, Miguel Martin-Matillas6, Cristina Campoy6, Luis A. Moreno7, Oscar Veiga8, Carlos Redondo-Figuero9, Jesús M. Garagorri10, Cristina Azcona5, Manuel Delgado11, Miguel García-Fuentes9, Maria C. Collado1 and Yolanda Sanz1; the EVASYON Study Group The aim of this study was to determine the influence of an obesity treatment program on the gut microbiota and body weight of overweight adolescents. Thirty-six adolescents (13–15 years), classified as overweight according to the International Obesity Task Force BMI criteria, were submitted to a calorie-restricted diet (10–40%) and increased physical activity (15–23 kcal/kg body weight/week) program over 10 weeks. Gut bacterial groups were analyzed by quantitative real-time PCR before and after the intervention. A group of subjects (n = 23) experienced >4.0 kg weight loss and showed significant BMI (P = 0.030) and BMI z-score (P = 0.035) reductions after the intervention, while the other group (n = 13) showed 95% and interobserver reliability was >90%. The characteristics of the 36 selected
adolescents (18 female and 18 male; mean age: 14.5 years) to be submitted to the obesity treatment program are shown in Table 2. None of the volunteers were treated with antibiotics for at least 1 month before the intervention study and during the study. The study was conducted in accordance with the ethical rules of the Helsinki Declaration (Hong Kong revision, September 1989), following the EEC Good Clinical Practice guidelines (document 111/3976/88 of July 1990) and current Spanish law which regulates clinical research in humans (Royal Decree 561/1993 regarding clinical trials). Informed consent was obtained from all adolescents and their parents, and the study was approved by the local ethics committees. Intervention Over a 10-week period, the participants were subjected to the intervention based on an energy-restricted diet (a 10–40% reduction) established according to both obesity degree and regular physical activity (13). The maximum energy intake was 1,800 kcal/day for females and 2,200 kcal/ day for males. The physical activity was determined by accelerometry and exercise prescribe at least 1 h of moderate-to-vigorous intensity 3 or 5 days per week, depending of the individual physical activity level. The energy expenditure was estimated in metabolic equivalent’ values (14) for each activity and the frequency and intensity of the activities of the exercise program (walking, biking, running, swimming, etc.). The energy expenditure range obtained was from 15 to 23 kcal/kg of body weight per week. Diet energy content was set from the resting energy expenditure calculated with the Schofield equation multiplied by 1.3 as physical activity factor (13). Energy restriction was calculated in function of the subject obesity degree: 10% restriction when the subject had a BMI between 0 and 2 s.d. above the mean, 20% with BMI between 2 and 3 s.d. above the mean, 30% between 3 and 4 s.d., and 40% if the subject had a BMI >4 s.d. above the mean according to BMI local reference standards. Macronutrient distribution was 50% of energy from carbohydrates, 30% from fat, and 20% from proteins. Energy distribution during the day was: breakfast: 20% of daily energy; morning snack: 10–15% of daily energy; lunch: 30–35% of daily energy; afternoon snack: 5–10% of daily energy; and dinner: 20–25% of daily energy. Dietary assessment Food diary records were kept for 72 h (2 weekdays and 1 weekend day) both before the start of the study (baseline intakes) and after the intervention (week 10). Detailed information on how to record food and drink consumed using common household measures was provided. Food diary records were returned to their dietitian, and analyzed for energy, water, and nutrient contents based on the CESNID food composition database of Spanish foods (15). Starches were defined as complex
Table 1 Oligonucleotide primers used in this study Annealing temperature (°C) References
Target bacterial group/species
Sequence (5′↔3′)
Total bacteria
TGGCTCAGGACGAACGCTGGCGGC CCTACTGCTGCCTCCCGTAGGAGT
61
16
Bacteroides fragilis group
ATA GCC TTT CGA AAG RAA GAT CCA GTA TCA ACT GCA ATT TTA
50
16,17
Clostridium coccoides group
AAA TGA CGG TAC CTG ACT AA CTT TGA GTT TCA TTC TTG CGA A
50
16,17
Clostridium leptum group
GCA CAA GCA GTG GAG T CTT CCT CCG TTT TGT CAA
50
16,17
Escherichia coli
GTTAATACCTTTGCTCATTGA ACCAGGGTATCTAATCCTGTT
62
18
Lactobacillus group
GGAAACAG(A/G)TGCTAATACCG CACCGCTACACATGGAG
61
19,20
Bifidobacterium
CTCCTGGAAACGGGTGG GGTGTTCTTCCCGATATCTACA
55
16,17
Bifidobacterium longum
TTCCAGTTGATCGCATGGTC TCSCGCTTGCTCCCCCGAT
55
16,17
Bifidobacterium bifidum
CCACATGATCGCATGTGATTG CCGAAGGCTTGCTCCCAAA
55
16,17
Bifidobacterium breve
CCGGATGCTCCATCACAC ACAAAGTGCCTTGCTCCCT
55
16,17
Bifidobacterium adolescentis
CTCCAGTTGGATGCATGTC TCCAGTTGACCGCATGGT
55
16,17
Bifidobacterium catenulatum group
CGGATGCTCCGACTCCT CGAAGGCTTGCTCCCGAT
55
16,17
obesity | VOLUME 17 NUMBER 10 | october 2009�
1907
articles Intervention and Prevention carbohydrates and fiber was computed as total nondigestible carbohydrates (soluble and nonsoluble). Due to limitations of the food composition database (15) and also the inherent limitation of dietary assessment in free living young populations, no further details are available according to other key nutrients that are proved to serve as substrate for the gut microbiota (i.e., resistant starch, oligosaccharides, or fructans). Fecal and DNA sample preparation Fecal samples were kept immediately after collection at −20 °C and stored until analyzed. Samples were diluted 1:10 (wt/vol) in phosphatebuffered saline (pH 7.2), homogenized and one aliquot was used for DNA extraction by using the QIAamp DNA stool Mini kit (Qiagen, Hilden, Germany). Microbial analysis by quantitative real-time PCR Specific primers targeting different bacterial genera and species were used to characterize the fecal microbiota by quantitative real-time PCR (Table 1), essentially as described previously (16–20). Briefly, PCR amplification and detection were performed with an ABI PRISM 7000PCR sequence detection system (Applied Biosystems, Warrington, UK). Each reaction mixture of 25 μl was composed of SYBR Green PCR Master Mix (SuperArray Bioscience, Foster City, CA), 1 μl of each of the specific primers at a concentration of 0.25 μmol/l, and 1 μl of template DNA. Bacterial concentration from each sample was calculated by comparing the Ct values obtained from the standard curves. Standard curves were created using serial tenfold dilution of pure cultures of DNA, corresponding to 102–109 cells from the culture collection as determined by microscopy counts using 4′,6-diamidino-2-phenylindole. The following strains were used as references: Bacteroides fragilis DSMZ 2451, Clostridium coccoides DSMZ 933, Clostridium leptum DSMZ 935, Lactobacillus casei ATCC 393, Escherichia coli CECT 45, Bifidobacterium longum subsp. longum CECT 4503, Bifidobacterium bifidum LMG 11041, Bifidobacterium breve LMG 11042, Bifidobacterium pseudocatenulatum CECT 5776, and Bifidobacterium adolescentis LMG 11037. The strains were obtained from the Spanish Collection of Type Cultures (CECT) and the German Collection of Microorganisms and Cell Cultures (DSMZ). Statistical analyses Statistical analyses were done using the SPSS 11.0 software (SPSS, Chicago, IL). Due to non-normal distribution, microbial data are expressed as medians with interquartile ranges (IQRs) and differences in bacterial populations were determined by applying the Mann–Whitney U-test and the Wilcoxon signed-rank test. Correlations among variables were calculated using the Spearman’s correlation test. Differences in clinical and anthropometric data were also determined by applying the Mann–Whitney U-test. Dietary composition (means and standard deviations) was calculated for crude (unadjusted) nutrients from the 72 h dietary registers and data were averaged for the analysis. All dietary variables submitted to log-transformation showed fit normal distribution. Repeated-measures ANOVA adjusted for sex and age was used to examine differences in group mean intake before (baseline) vs. after the intervention. In every case, P 4.0 kg of weight loss after intervention, n = 23). The median of weight loss after 10 weeks under the intervention program for the first group was of 1.4 (0.75–2.00) kg, corresponding to 1.3% (IQR 0.85–2.25%) of body weight. This group did not showed Table 2 Clinical characteristics of the studied subjects Total subjects Age (years)
N = 36 14.5 (13.0–15.0)
BMI Before intervention
32.8 (29.4–35.2)
After intervention
30.6 (27.5–33.3)
Weight (kg) Before intervention
90.5 (81.8–102.2)
After intervention
84.4 (75.3–97.1)
Weight loss (kg)
4.7 (1.7–7.2)
Weight loss (%)
5.8 (2.2–8.6)
BMI z-score Before intervention
3.09 (2.31–4.08)
After intervention
2.71 (1.72–3.49)
Low weight–loss group Age (years)
N = 13 14.5 (13.0–15.0)
BMI Before intervention
30.7 (26.4–36.3)
After intervention
30.2 (26.2–35.9)
Weight (kg) Before intervention
85.9 (69.4–101.6)
After intervention
84.4 (68.2–100.7)
Weight loss (kg)
1.4 (0.75–1.8)
Weight loss (%)
1.3 (0.85–2.25)
BMI z-score Before intervention
2.95 (1.6–4.03)
After intervention
2.74 (1.5–3.93)
High weight–loss group Age (years)
N = 23 14.5 (14.0–15.0)
BMI Before intervention
33.1 (30.0–35.0)a
After intervention
31.1 (27.5–32.9)a
Weight (kg)
Results Subjects and obesity intervention program
The studied subjects, 50% female (18/36) and 50% male (18/36), were 14.5 years old (13.0–15.0 years) and maintained an apparently good health status during the study. Clinic and anthropometric characteristics did not differ significantly among subjects at recruitment time, particularly regarding weight (P = 0.266), BMI (P = 0.221), and BMI-z-score (P = 0.138) and, therefore, they were comparable (Table 2). The subjects showed marked differences in weight loss after intervention and, accordingly, subdivided into two groups as low weight–loss group (2.0 kg) Before intervention (n = 13)
High weight–loss group (>4.0 kg)
After intervention (n = 13)
Before intervention (n = 23)
After intervention (n = 23)
Mean
s.d.
Mean
s.d.
Mean
s.d.
Mean
s.d.
Energy (kcal)a,b
2,121.67
617.00
1,428.55
216.83
2,377.62
617.56
1,460.62
376.52
Water (g)a
1,325.40
377.84
1,109.62
290.99
1,912.94
657.90
1,999.0
708.51
101.30
23.47
75.59
11.66
109.82
29.92
77.04
19.56
18.90
3.08
22.58
2.59
18.62
3.34
21.96
2.40
Protein (g)a,b Energy from protein (%)
a,b
a,b
29.28
8.13
20.58
4.26
26.37
7.88
22.44
6.97
Plant protein (%)b
5.58
2.06
5.64
1.25
5.31
1.89
6.38
1.26
b
72.32
22.55
54.10
9.97
76.56
28.67
54.67
15.37
Animal protein (%)
12.80
3.11
16.21
2.41
13.43
6.54
15.77
2.37
Fat (g)
91.66
45.82
16.32
99.39
38.25
52.11
17.66
38.11
9.25
34.43
8.20
40.44
5.55
31.85
5.41
26.96
18.06
17.93
4.69
36.37
15.73
15.44
6.50
11.67
3.70
10.96
2.34
13.30
3.20
9.58
2.18
42.41
22.59
22.96
9.76
42.05
16.38
21.94
9.14
17.65
6.27
15.52
5.72
16.62
3.35
13.45
3.68
13.22
6.35
7.03
3.64
16.82
8.01
7.25
2.47
Plant protein (g)
Animal protein (g) a,b
Energy from fat (%)b Saturated fat (g)
a,b
Energy from saturated fat (%) MUFAs (g)a,b Energy from MUFAs (%)
b
PUFAs (g)a,b Energy from PUFAs (%)
b
Cholesterol (mg)a,b CH (g)a,b Energy from CH (%)
b
Simple CH (g)a,b
b
51
5.77
1.25
4.91
1.71
6.82
2.40
4.25
0.93
332.01
114.01
257.97
67.94
371.80
165.12
215.16
118.79
223.03
55.40
153.71
33.32
226.29
63.37
163.63
48.75
43.30
8.36
45.03
7.38
41.89
5.62
47.28
5.07
99.85
32.80
61.99
27.63
108.36
43.83
80.91
20.37
16.54
6.32
21.23
7.35
18.23
5.17
22.86
6.10
114.63
38.16
74.17
21.33
114.80
32.94
81.60
36.73
Energy from complex CH (%)
23.88
5.77
24.6
5.54
21.29
13.61
23.96
5.34
Dietary fiber (g)
18.31
7.78
17.9
4.63
17.47
7.60
21.38
7.66
Energy from simple CH (%)b Complex CH (g)a,b
CH, carbohydrates; MUFAs, monounsaturated fatty acids; PUFAs, polyunsaturated fatty acids. a Significant (P < 0.050) difference within the low weight–loss group between baseline and after the intervention. bSignificant difference within the high weight–loss group (based on age and sex adjusted ANOVA for repeated measurements of log-transformed dietary data). obesity | VOLUME 17 NUMBER 10 | october 2009�
1909
articles Intervention and Prevention Influence of intervention in fecal bacterial group composition
Interindividual differences on fecal microbiota composition for all studied adolescents were 0.77 (IQR 0.39–1.70) for B. fragilis group, −0.36 (IQR −0.82 to 0.29) for Bifidobacterium, −0.65 (IQR −0.98 to 0.27) for C. coccoides group, 0.02 (IQR −0.50 to 0.45) for C. leptum group, 0.10 (IQR −0.38 to 0.49) for E. coli, and 0.43 (IQR 0.09–0.83) for Lactobacillus group. The intervention in whole adolescent population (n = 36) resulted in increased counts of B. fragilis group (P = 0.001)
and Lactobacillus group (P = 0.030), and decreased counts of C. coccoides group (P = 0.028). No significant differences were found in the other bacterial groups analyzed. B. fragilis group (R = 0.55, P < 0.001) and C. leptum group (R = 0.52, P < 0.001) counts after the intervention significantly correlated with higher weight loss (kg), while the opposite correlations were found for the E. coli (R = −0.26, P = 0.025), C. coccoides group (R = −0.61, P < 0.001), Lactobacillus group (R = −0.40, P = 0.001), and Bifidobacterium (R = −0.37, P = 0.001) counts.
Table 4 Bacterial counts in fecal samples of low weight–loss (4.0 kg) group of adolescents, before and after intervention Bacterial countsa (log cells/g fecal sample), n = 23 Before intervention
Mann–Whitney U-test
After intervention
Bacterial group
Prb
Mean
Median
IQR
Pr
Mean
Median
IQR
P value
Total bacteria
23
14.8
14.6
14.0–15.6
23
14.5
14.8
13.1–16.1
0.450
Bacteroides fragilis
23
7.5
7.6
6.7–8.2
23
8.6
8.6
8.1–9.3
0.001*
Clostridium coccoides
23
8.7
8.6
8.3–9.0
23
7.9
7.7
7.4–8.5
0.001*
Clostridium leptum
23
9.5
9.6
8.7–9.9
21
9.5
9.7
9.1–10.0
0.666
Lactobacillus
23
6.4
6.4
5.9–6.9
23
6.9
7.0
6.3–7.1
0.007*
Escherichia coli
23
6.3
6.3
5.8–6.8
23
6.4
6.3
6.1–7.0
0.231
Bifidobacterium
23
8.3
8.1
7.7–8.6
23
8.2
8.2
7.4–8.6
0.692
Bifidobacterium longum
23
7.1
7.2
6.3–7.9
23
6.4
6.2
5.3–7.3
0.044*
Bifidobacterium breve
15
3.5
3.3
3.0–3.6
11
3.2
3.1
3.0–3.5
0.237
Bifidobacterium bifidum
19
5.9
5.6
4.5–7.1
17
5.6
5.6
4.3–7.1
0.490
Bifidobacterium adolescentis
23
7.6
7.9
6.8–8.8
23
6.9
7.0
6.0–8.1
0.082
Bifidobacterium catenulatum
22
7.6
7.7
6.7–8.5
23
7.2
7.6
6.3–8.4
0.594
Data are shown as medians and interquartile range (IQR) of cell number per gram of fecal samples. Prevalence (Pr) reflects the number of positive amplifications by quantitative real-time PCR from total samples (n = 23). *Statistical differences between bacterial counts before and after intervention were calculated by using the Mann–Whitney U-test and established at P < 0.050. a
1910�
b
VOLUME 17 NUMBER 10 | october 2009 | www.obesityjournal.org
articles Intervention and Prevention
Influence of intervention in bifidobacterium species composition
In the whole adolescent population (n = 36), total Bifidobacterium group counts were similar before and after intervention, while B. longum and B. adolescentis counts were significantly lower after intervention than before (P = 0.031 and P = 0.044, respectively). No significant differences were obesity | VOLUME 17 NUMBER 10 | october 2009�
Lactobacillus group (log cell/g)
a
11 10 9 8 7 6 5 4
R = 0.55, P < 0.001 4
E. coli group (log cells/g)
b 11
c
6 8 10 12 14 16 18 Weight loss after intervention (kg)
R = −0.37, P = 0.010
10 9 8 7 6 5 4
Bacteroides group (log cell/g)
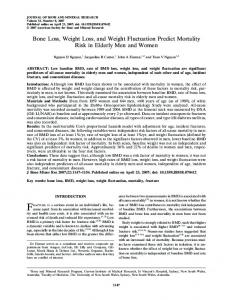
Changes in bacterial counts as a result of the intervention were also evaluated by considering separately the high and the low weight–loss groups (Tables 4 and 5). Significant differences were not found in bacterial counts of any of the analyzed groups before and after intervention in the low weight–loss group (n = 13 and 4.0 kg of weight loss; Table 5). In this last group, B. fragilis group and Lactobacillus group counts significantly increased (P = 0.001 and P = 0.007, respectively), while those of the C. coccoides group significantly decreased (P = 0.001) after 10 weeks of intervention. Moreover, the ratio of Bifidobacterium to C. coccoides group counts increased significantly after the intervention (P = 0.022) when compared to the ratio recorded beforehand, while the ratio of Bifidobacterium to B. fragilis group counts decreased (P = 0.001). When subjects of high weight–loss group were classified according to gender, certain significant differences were found between the two groups. In females, B. fragilis group significantly increased (P = 0.002) after the intervention, while C. coccoides group counts decreased (P = 0.023), which was in accordance with the results obtained when considering the total high weight– loss group of adolescents. Lactobacillus group increased but the differences were not statistically significant. In males, Lactobacillus and B. fragilis groups increased significantly (P = 0.001 and P = 0.033, respectively) after the intervention, whereas a significant (P = 0.007) reduction was found in the C. coccoides group, as was detected for the total high weight– loss group of adolescents. Significant correlations between bacterial counts after the intervention and weight loss were found in the high weight– loss group (Figure 1). Increased levels of B. fragilis group (R = 0.27, P = 0.055) and Lactobacillus group significantly correlated (R = 0.55, P < 0.001) with weight loss (kg), while the opposite correlation (R = −0.37, P = 0.010) was found for the E. coli (Figure 1). Similar correlations were recorded between Lactobacillus group (R = 0.53, P = 0.008) and B. fragilis group (R = 0. 44, P = 0.036) levels, and body weight-loss percentages. The reductions in BMI z-scores as a result of the intervention were also significantly correlated with increased levels of Lactobacillus group (R = 0.64, P = 0.001) and B. fragilis group (R = 0.46, P = 0.025). Reduced C. coccoides group levels were related to weight loss (R = −0.611, P = 0.001). The correlation between the reduction in Bifidobacterium to C. coccoides group ratio and weight loss was significantly (R = 0.25, P = 0.030), as well as the correlation between the reduction in Bifidobacterium to B. fragilis group ratio and weight loss (R = −0.62, P < 0.001) as a result of the intervention.
4
6 8 10 12 14 16 18 Weight loss after intervention (kg)
4
6 8 10 12 14 16 18 Weight loss after intervention (kg)
11 10 9 8 7 6 5 4
R = 0.27, P = 0.055
Figure 1 Correlations between fecal bacterial counts and weight loss after intervention in the high weight–loss group (n = 23; >4.0 kg weight loss) of adolescents. Lines showed the Pearson correlation (linear adjustment). (a) Lactobacillus group vs. weight loss, (b) Escherichia coli vs. weight loss, and (c) Bacteroides fragilis group vs. weight loss.
found in the other Bifidobacterium species analyzed. B. breve (R = −0.56, P < 0.001) and B. bifidum (R = −0.76, P < 0.001) counts after the intervention significantly correlated with lower weight loss (kg), while no correlations were found in the other species. Changes in Bifidobacterium species counts as a result of the intervention were also evaluated by considering separately the high and the low weight–loss groups (Tables 4 and 5). Bifidobacterium species counts showed significant differences as a result of the intervention in the high weight–loss group (Table 5), while not in the low weight–loss group of adolescents (Table 4). In the high weight–loss group, all Bifidobacterium species analyzed decreased after the dietary intervention, although only the changes in B. longum counts were significant (P = 0.044). Similar trends were found when comparing Bifidobacterium species composition in males or females. However, only B. adolescentis counts decreased significantly after intervention (P = 0.037) in males, whereas no significant differences were found in females. Significant correlations 1911
articles Intervention and Prevention Table 6 Bacterial counts in fecal samples of low and high weight–loss groups of adolescents, before and after intervention Low weight–loss group (4.0 kg) (n = 23)
IQR
Mann–Whitney U-test
Pr
Mean
Median
IQR
P value
Bacterial counts before intervention (log cells/g fecal sample) b
Total bacteria
13
13.2
12.9
12.8–13.9
23
14.8
14.6
14.0–15.6