Atmos. Chem. Phys. Discuss., 8, 7339–7371, 2008 www.atmos-chem-phys-discuss.net/8/7339/2008/ © Author(s) 2008. This work is distributed under the Creative Commons Attribution 3.0 License.
Atmospheric Chemistry and Physics Discussions
ACPD 8, 7339–7371, 2008
Interpreting column CO2 Data P. I. Palmer et al.
Interpreting the variability of CO2 columns over North America using a chemistry transport model: application to SCIAMACHY data P. I. Palmer1 , M. P. Barkley1 , and P. S. Monks2 1 2
School of GeoSciences, University of Edinburgh, UK Department of Chemistry, University of Leicester, UK
Received: 18 February 2008 – Accepted: 25 March 2008 – Published: 16 April 2008 Correspondence to: P. I. Palmer (
[email protected])
Title Page Abstract
Introduction
Conclusions
References
Tables
Figures
J
I
J
I
Back
Close
Full Screen / Esc
Published by Copernicus Publications on behalf of the European Geosciences Union. Printer-friendly Version Interactive Discussion
7339
Abstract
5
10
15
20
We use the GEOS-Chem chemistry transport model to interpret variability of CO2 columns and associated column-averaged volume mixing ratios (CVMRs) observed by the SCIAMACHY satellite instrument during the 2003 North American growing season, accounting for the instrument averaging kernel. Model and observed columns, ◦ ◦ largely determined by surface topography, averaged on a 2 ×2.5 grid, are in excellent agreement (model bias=3%, r>0.9), as expected. Model and observed CVMRs, determined by scaling column CO2 by surface pressure data, are on average within 3% but are only weakly correlated, reflecting a large positive model bias (10–15 ppmv) at 50–70◦ N during midsummer at the peak of biospheric uptake. GEOS-Chem generally reproduces the magnitude and seasonal cycle of observed CO2 surface VMRs across North America. During midsummer we find that model CVMRs and surface VMRs converge, reflecting the instrument vertical sensitivity and the strong influence of the land biosphere on lower tropospheric CO2 columns. We use model tagged tracers to show that local fluxes largely determine CVMR variability over North America, with the largest individual CVMR contributions (1.1%) from the land biosphere. Fuel sources are relatively constant while biomass burning make a significant contribution only during midsummer. We also show that non-local sources contribute significantly to total CVMRs over North America, with the boreal Asian land biosphere contributing close to 1% in midsummer at high latitudes. We used the monthly-mean Jacobian matrix for North America to illustrate that: 1) North American CVMRs represent a superposition of many weak flux signatures, but differences in flux distributions should permit independent flux estimation; and 2) the atmospheric e-folding lifetimes for many of these flux signatures are 3–4 months, beyond which time they are too well-mixed to interpret.
ACPD 8, 7339–7371, 2008
Interpreting column CO2 Data P. I. Palmer et al.
Title Page Abstract
Introduction
Conclusions
References
Tables
Figures
J
I
J
I
Back
Close
Full Screen / Esc
Printer-friendly Version Interactive Discussion
7340
1 Introduction
5
10
15
20
25
The importance of the natural carbon cycle in understanding climate is well established (IPCC, 2007). A better quantitative understanding of natural sources and sinks of carbon dioxide (CO2 ), in particular, is crucial if CO2 mitigation and sequestration activities relying on these natural fluxes are to work effectively. Estimation of sources and sinks of CO2 using inverted atmospheric transport models to interpret atmospheric concentration data has been generally effective but has had varied success in the tropics where there is relatively little data (Gurney et al., 2002). Previous inversion studies have used surface concentration data (Bousquet et al., 1999), representative of spatial scales of the order of 1000 km by virtue of their location; aircraft concentration data (Palmer et al., 2006; Stephens et al., 2007) representative of spatial scales of the order of 10–100 s km, and generally only available during intensive campaign periods; and concentrations from tall towers (Chen et al., 2007), representative of spatial scales of the order of 50◦ N and longitudes >100◦ W (as shown in top LHS panel). We exclude 1) cloudy scenes, identified by instrument polarization devices, 2) scenes with solar zenith angles >75◦ , 3) scenes with a retrieval errors of ≥5%, and 4) scenes that correspond to CVMRs outside of the range 340−400 ppmv.
Fig. 1. Monthly mean SCIAMACHY (left) and GEOS-Chem (middle) CO2 columns 21 −2 (10 molec cm ) over North America during April to September 2003 averaged over the ◦ ◦ GEOS-Chem 2 ×2.5 grid. The model is sampled at the time and location of the observed scenes, and using the SCIAMACHY averaging kernel as outlined in the main text. The RHS panels show scatterplots of the monthly mean data, with the number of data points n, correlation coefficient r, and the model bias inset. Red data denote columns over the region defined by latitudes >50◦ N and longitudes >100◦ W (as shown in top LHS panel). We exclude 1) cloudy ◦ scenes, identified by instrument polarization devices, 2) scenes with solar zenith angles >75 , 3) scenes with a retrieval errors of ≥5%, and 4) scenes that correspond to CVMRs outside of the range 340–400 ppmv. 7362
Full Screen / Esc
Printer-friendly Version Interactive Discussion
12
PALMER ET AL: INTERPRETING COLUMN CO2 DATA
ACPD GEOS-Chem CO2 [ppmv]
SCIAMACHY CO2 GEOS-Chem CO2
GEOS-Chem CO2 [ppmv]
APR
GEOS-Chem CO2 [ppmv]
MAY
GEOS-Chem CO2 [ppmv]
JUN
GEOS-Chem CO2 [ppmv]
JUL
AUG
8, 7339–7371, 2008
400 380 360
Bias = 1.76%
340 n = 455 r = -0.13 340 360 380 400 SCIAMACHY CO2 [ppmv] 400 380 360
Bias = 2.39%
340 n = 487 r = -0.11 340 360 380 400 SCIAMACHY CO2 [ppmv] 400
GEOS-Chem CO2 [ppmv]
340
360
380
400
[ppmv]
360
Bias = 2.88%
340 n = 430 r = 0.07 340 360 380 400 SCIAMACHY CO2 [ppmv] 400 380
Title Page Abstract
Introduction
Conclusions
References
Tables
Figures
J
I
J
I
Back
Close
360
Bias = 2.78% 340 n = 498 r = 0.24 340 360 380 400 SCIAMACHY CO2 [ppmv] 400 380 360
Bias = 2.26% 340 n = 422 r = 0.24
400 380 360
Bias = 1.99%
340 n = 491 r = 0.07 340 360 380 400 SCIAMACHY CO2 [ppmv]
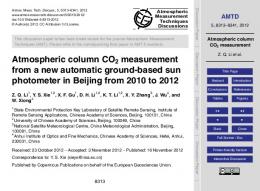
Fig. 2. Monthly mean SCIAMACHY and GEOS-Chem CO2 CVMRs (ppmv) over North America during April to September 2003 averaged over the GEOS-Chem 2◦ ×2.5◦ grid. The model and data descriptions are as Figure 1. The nearest ECMWF (1.125◦ ×1.125◦ ) and GEOS-4 (1◦ ×1.125◦ ) surface pressure data are used to convert from observed and model columns to CVMRs, respectively.
Fig. 2. Monthly mean SCIAMACHY and GEOS-Chem CO2 CVMRs (ppmv) over North America during April to September 2003 averaged over the GEOS-Chem 2◦ ×2.5◦ grid. The model and data descriptions are as Fig. 1. The nearest ECMWF (1.125◦ ×1.125◦ ) and GEOS-4 (1◦ ×1.125◦ ) surface pressure data are used to convert from observed and model columns to CVMRs, respectively.
7363
P. I. Palmer et al.
380
340 360 380 400 SCIAMACHY CO2 [ppmv]
SEP
Interpreting column CO2 Data
Full Screen / Esc
Printer-friendly Version Interactive Discussion
ACPD 8, 7339–7371, 2008
Interpreting column CO2 Data -135
-90
-45
0
45
90
135
60
30
NA
-90
-45
0
45
90
-30
Introduction
Conclusions
References
-60
-135
Abstract
-30
ROW
0
0
AS
Title Page
30
-60
P. I. Palmer et al.
BA
60
EU
Tables
Figures
J
I
J
I
Back
Close
135
Fig. 3. Source regions for the tagged CO2 simulation. The regions are denoted boreal Asia (BA), mainland Asia (AS), Europe (EU), North America (NA) and the rest of the world (ROW). See Table 1 for latitude and longitude region definitions and associated flux estimates.
Full Screen / Esc
Printer-friendly Version Interactive Discussion
7364
CO2 VMR [ppmv]
400
Estevan Point, British Columbia, Canada
383 367 GLOBALVIEW
GEOS-Chem
350 2002.5 2003.0 2003.5 2004.0 2004.5 Julian day
Harvard Forest, Massachusetts, United States
383 367 GLOBALVIEW
GEOS-Chem
350 2002.5 2003.0 2003.5 2004.0 2004.5 Julian day 400
Niwot Ridge, Colorado, United States
383 367 GLOBALVIEW
GEOS-Chem
350 2002.5 2003.0 2003.5 2004.0 2004.5 Julian day
CO2 VMR [ppmv]
ACPD
Barrow, Alaska, United States
383
8, 7339–7371, 2008
367 GLOBALVIEW
GEOS-Chem
350 2002.5 2003.0 2003.5 2004.0 2004.5 Julian day
CO2 VMR [ppmv]
GEOS-Chem
400
400
CO2 VMR [ppmv]
GLOBALVIEW
350 2002.5 2003.0 2003.5 2004.0 2004.5 Julian day
400
CO2 VMR [ppmv]
367
400
CO2 VMR [ppmv]
Alert, Nunavut, Canada
383
CO2 VMR [ppmv]
CO2 VMR [ppmv]
400
Interpreting column CO2 Data
Fraserdale, Ontario, Canada
P. I. Palmer et al.
383 367 GLOBALVIEW
GEOS-Chem
350 2002.5 2003.0 2003.5 2004.0 2004.5 Julian day
Title Page Abstract
Introduction
Conclusions
References
Tables
Figures
350 2002.5 2003.0 2003.5 2004.0 2004.5 Julian day
J
I
400
J
I
Back
Close
Park Falls, Wisconsin, United States
383 367 GLOBALVIEW
GEOS-Chem
Wendover, Utah, United States
383 367 GLOBALVIEW
GEOS-Chem
Full Screen / Esc
350 2002.5 2003.0 2003.5 2004.0 2004.5 Julian day
Printer-friendly Version
Fig. 4. Comparison of observed (GLOBALVIEW-CO2 , 2006) and model surface CO2 concen◦ ◦ trations (ppmv) over North America during 2003. Model concentrations, averaged on a 2 ×2.5 , have been sampled at the overpass time of SCIAMACHY when data are available.
7365
Interactive Discussion
ACPD 8, 7339–7371, 2008
Interpreting column CO2 Data
20 Altitude [km]
P. I. Palmer et al.
15 Title Page
10
Abstract
Introduction
Conclusions
References
Tables
Figures
J
I
J
I
Back
Close
5 0 0.0
0.5 1.0 Averaging Kernel [unitless]
1.5
Fig. 5. The mean averaging kernel (0–70◦ solar zenith angle, SZA) for the retrieval of CO2 from SCIAMACHY NIR measurements (Barkley et al., 2006c) and applied to the GEOS-Chem model. Individual averaging kernels, representative of a particular SZA, have been generated brute-force by perturbing the US standard atmosphere by 10 ppmv at 1 km intervals between 10 km and at 5 km intervals above 10 km.
Full Screen / Esc
Printer-friendly Version Interactive Discussion
7366
ACPD
370 360 Data (CVMR)
APR
350 30 40 50 60 70 80 Latitude [Deg]
390 Model (CVMR) Model (sfc VMR)
380 370 360
JUL Data (CVMR) 350 30 40 50 60 70 80 Latitude [Deg]
Model (sfc VMR)
380 370 360 Data (CVMR)
MAY
350 30 40 50 60 70 80 Latitude [Deg]
390 Model (CVMR) Model (sfc VMR)
380 370 360
AUG Data (CVMR) 350 30 40 50 60 70 80 Latitude [Deg]
CO2 CVMR and VMR [ppmv]
380
390 Model (CVMR)
CO2 CVMR and VMR [ppmv]
Model (sfc VMR)
CO2 CVMR and VMR [ppmv]
390 Model (CVMR)
CO2 CVMR and VMR [ppmv]
CO2 CVMR and VMR [ppmv]
CO2 CVMR and VMR [ppmv]
8, 7339–7371, 2008 390 Model (CVMR)
Interpreting column CO2 Data
Model (sfc VMR)
380 370
P. I. Palmer et al.
360 Data (CVMR)
JUN
350 30 40 50 60 70 80 Latitude [Deg]
390 Model (CVMR)
Abstract
Introduction
Conclusions
References
Tables
Figures
J
I
J
I
Back
Close
Model (sfc VMR)
380 370 360
SEP Data (CVMR) 350 30 40 50 60 70 80 Latitude [Deg]
Fig. 6. Monthly mean latitude gradients of SCIAMACHY and GEOS-Chem CO2 CVMRs (ppmv) and GEOS-Chem surface VMR (ppmv) over North America during April–September 2003 binned every 5◦ latitude. Model concentrations, averaged on a 2◦ ×2.5◦ , have been sampled at the overpass time of SCIAMACHY when data are available. Filled triangles denote mean values and open circles denote median values. Vertical lines denote the 1-standard deviation about the mean values.
7367
Title Page
Full Screen / Esc
Printer-friendly Version Interactive Discussion
FL NA FL EU FL BA
FL AS BB NA BB EU BB BA BB AS BS NA BS EU BS BA BS AS
APR
ACPD 8, 7339–7371, 2008
Interpreting column CO2 Data
MAY
P. I. Palmer et al. JUN Title Page
JUL
AUG
Abstract
Introduction
Conclusions
References
Tables
Figures
J
I
J
I
Back
Close
SEP
0.0
2.0
0.0
0.2
0.0
0.1
0.0
0.4
0.0
0.5
0.0
0.1
0.0
0.5
0.0
0.1
-4.0
3.0
-0.2
0.2
-2.0
1.0
-1.0
CVMR [ppmv] Fig. 7. Monthly mean GEOS-Chem CO2 CVMR contributions (ppmv) from continental sources and sinks during April to September 2003, averaged over the GEOS-Chem 2◦ ×2.5◦ grid. See Fig. 3 for source region definitions and Table 1 for regional CO2 flux estimates.
7368
1.0
Full Screen / Esc
Printer-friendly Version Interactive Discussion
ACPD 8, 7339–7371, 2008
Interpreting column CO2 Data P. I. Palmer et al.
Title Page Abstract
Introduction
Conclusions
References
Tables
Figures
J
I
J
I
Back
Close
Full Screen / Esc
Fig. 8. CO2 surface concentrations, columns, and CVMRs at the WLEF television tower, Wisconsin USA (45.94◦ N, 90.27◦ W, 442 m above sea level) during 2003. (A) GLOBALVIEW and GEOS-Chem model, averaged on a 2◦ ×2.5◦ grid, surface CO2 concentrations (ppmv), (B) SCIAMACHY (raw and 30-point running average) and GEOS-Chem CO2 columns 21 −2 [10 molec cm ], (C) SCIAMACHY (raw and 30-point running average) and GEOS-Chem CVMR (ppmv), and (D) GEOS-Chem CVMR contributions greater than 0.5 ppmv.
7369
Printer-friendly Version Interactive Discussion
ACPD 8, 7339–7371, 2008
Interpreting column CO2 Data P. I. Palmer et al.
Title Page Abstract
Introduction
Conclusions
References
Tables
Figures
J
I
J
I
Back
Close
Full Screen / Esc
Printer-friendly Version ◦
Fig. 9. CO2 surface concentrations, columns, and CVMRs at Wendover, Utah USA (39.9 N, ◦ −113.72 W, 1320 m above sea level) during 2003. Individual panels follow Fig. 8.
7370
Interactive Discussion
2
4 6 8 10 12 Month in 2003
FL AS 100 80 60 40 20 0 0
2
4 6 8 10 12 Month in 2003
BS BA 100 80 60 40 20 0 0
2
4 6 8 10 12 Month in 2003
BS EU 100 80 60 40 20 0 0
2
4 6 8 10 12 Month in 2003
BS AS 100 80 60 40 20 0 0
2
4 6 8 10 12 Month in 2003
dCVMR/dEmonth i
4 6 8 10 12 Month in 2003
dCVMR/dEmonth i
dCVMR/dEmonth i
2
dCVMR/dEmonth i
FL EU 100 80 60 40 20 0 0
BS NA 100 80 60 40 20 0 0
dCVMR/dEmonth i
4 6 8 10 12 Month in 2003
dCVMR/dEmonth i
2
dCVMR/dEmonth i
FL BA 100 80 60 40 20 0 0
dCVMR/dEmonth i
dCVMR/dEmonth i dCVMR/dEmonth i dCVMR/dEmonth i dCVMR/dEmonth i
FL NA 100 JAN FEB MAR APR MAY JUN 80 JUL AUG SEP OCT NOV DEC 60 40 20 0 0 2 4 6 8 10 12 Month in 2003
BB NA 100 80 60 40 20 0 0
ACPD 8, 7339–7371, 2008
2
4 6 8 10 12 Month in 2003
BB BA 100 80 60 40 20 0 0
P. I. Palmer et al. 2
4 6 8 10 12 Month in 2003
Title Page
BB EU 100 80 60 40 20 0 0
2
4 6 8 10 12 Month in 2003
Abstract
Introduction
Conclusions
References
Tables
Figures
J
I
J
I
Back
Close
BB AS 100 80 60 40 20 0 0
2
4 6 8 10 12 Month in 2003
5
Fig. 10. Monthly mean columns of the Jacobian matrix (ppmv/Tg CO2 ), scaled by 10 for presentation, calculated using a priori flux estimates (Table 1) and the corresponding GEOS-Chem CVMR contributions, averaged on a 2◦ ×2.5◦ grid over North America during 2003 (Fig. 7). Colours denote specific months . Each point represents the monthly mean sensitivity of North American CO2 columns to specific continental sources and sinks. Lines connecting the points have no physical significance.
7371
Interpreting column CO2 Data
Full Screen / Esc
Printer-friendly Version Interactive Discussion