Interval-Based Models for Run-Time DVFS Orchestration in SuperScalar Processors Georgios Keramidas
Vasileios Spiliopoulos
Stefanos Kaxiras
Industrial Systems Institute Patras, Greece
Department of Electrical and Computer Engineering University of Patras, Greece
Department of Electrical and Computer Engineering University of Patras, Greece
[email protected]
[email protected]
[email protected]
ABSTRACT
Keywords
We develop two simple interval-based models for dynamic superscalar processors. These models allow us to: i) predict with great accuracy performance and power consumption under various frequency and voltage combinations and ii) implement targeted DVFS policies at run-time. The models analyze program execution in intervals —steady-state and miss-event intervals. Intervals are signalled by miss events (L2-misses in our case) that upset the “steady state” execution of the program and are ended when the pipeline reaches again a steady state. The first model is fed by an approximation of the stall cycles (the time the processor instruction window is blocked) due to long-latency L2-misses. The second model improves on this approximation using as input the occupancy of the L2's miss-handling registers (MSHRs). Despite their simplicity these models prove to be accurate in predicting the performance (and energy) for any target frequency/voltage setting, yielding average errors of 2.1% and 0.2% respectively. Besides modelling, we show that the methodology we propose is powerful enough to implement (at run-time) various DVFS policies: “operate at optimal EDP” or “ED2P,” or even “reduce ED2P within specific performance constraints.” Approaches based on the two models require minimal hardware cost: two counters for measuring the duration of the steady state and the miss-event intervals and some comparison logic. To validate our methodology we use a cycle-accurate simulator and the benchmarks provided by the SPEC2K suite. Our results indicate that our proposed run-time mechanism is able to orchestrate different DVFS policies with great success yielding negligible errors —bellow 1.5% on average.
Dynamic Voltage and Frequency Scaling, Performance and Power Modeling, Superscalar Out-of-Order Processors.
Categories and Subject Descriptors C.0 [Genenal]: Modeling of computer architecture; C.1.3 [Processor Architectures]: Other Architecture Styles— Adaptable architectures.
General Terms Algorithms, Management, Design.
Permission to make digital or hard copies of all or part of this work for personal or classroom use is granted without fee provided that copies are not made or distributed for profit or commercial advantage and that copies bear this notice and the full citation on the first page. To copy otherwise, or republish, to post on servers or to redistribute to lists, requires prior specific permission and/or a fee. CF’10, May 17–19, 2010, Bertinoro, Italy. Copyright 2010 ACM 978-1-4503-0044-5/10/05...$10.00.
1. INTRODUCTION The power-aware architecture landscape has been dominated by techniques based on supply voltage and clock frequency scaling. Dynamic Voltage and Frequency Scaling (DVFS) offers great opportunities to dramatically reduce energy/power consumption by adjusting both voltage and frequency levels of a system according to the changing characteristics of its workloads. The great potential of the DVFS in energy/power savings has been widely studied in a variety of research communities (from circuit designers to system designers) and has been also used in commercial systems. Intel XScale and AMD Mobile K6 Plus are typical low-power processors that feature DVFS management capabilities. Example processors from the high-performance area are the AMD Opteron Quad-Core and the Intel Core i7 processor. In general, the heart of the DVFS techniques is the exploitation of the system slack or “idleness.” Their objective is to take advantage of slack so that performance is affected little by frequency scaling while at the same time a cubic benefit in power consumption (see Section 2) —with the help of voltage scaling— is achieved. Slack can appear at different levels and various approaches have been proposed for each level. According to [10], there are three major levels where DVFS decisions can be taken: i) the system level based on system slack, ii) the program or program-phase level based on instruction slack, and iii) hardware level based on hardware slack. More details can be found in [10]. In this work, we concern ourselves with the instruction slack due to the long latency memory operations (off-chip accesses). There is an abundance of prior work which aims to exploit instruction slack at run-time [7,8,13,17] as well as at compile-time [14,18]. In addition, the current trend from scaling the processor frequency to scaling the number of cores that can reside in a single die enables new opportunities for the DVFS i.e., per-core DVFS in CMPs [3,6]. In this paper, we explore the issue of run-time DVFS management of an out-of-order superscalar processor at the microarchitectural level. We provide two simple analytical models that are able to drive run-time DVFS decisions. These models allow us to predict with great success performance and power consumption under various frequency/voltage combinations. Our modeling methodology is inspired by the interval-based performance model presented initially by Karkhanis and Smith [9] and further refined by Eyerman et. al. [5]. Similarly to the performance model, we
Performance impact by Scaling the Frequency
Increase in Exec. Time
examine power consumption in dynamically scheduled superscalar processors by dividing their execution in intervals. Intervals are marked by miss-events that upset the “steady state” execution of the program. A miss-interval starts with a miss-event (off-chip load accesses in our case), and lasts until the pipeline reaches again a steady state (a period related to the memory latency). Periods between miss-intervals are steady–state intervals. The realization that drives this work is that core frequency scaling in these models is nothing more than changing the memory latency in cycles. The first model, called stall-based model, relies on the number of cycles during which the processor’s instruction window is blocked due to a long latency miss i.e., when the head of the reorder buffer (ROB) is occupied by a performance-critical L2 load miss. The second model, called miss-based model, is a refinement of the first model and uses as input the occupancy of the L2’s MSHRs (a common structure used in all modern processors). Both models require minimal input and allow us to accurately predict processor performance and energy consumption under any target DVFS setting (V/f points) relative to the situation where measurements are taken. This, in turn, allows us to derive directly (using calculations) the V/f points to optimize, for example, EDP or ED2P without having to go through a stepby-step search pattern of such points. The miss-based model is considerably more accurate than the stall-based model. This is because the stall-based model assumes that the stall time due to a long-latency miss is equivalent to the memory latency (measure in cycles). Although this is a good approximation, it is a source of error too. This is because, the stallbased model disregards the time the processor continues to issue useful instructions after an L2-miss. This time is not subject to frequency scaling or it does not depend on the latency of the main memory (Section 4). Recall that our conceptual view of the core frequency scaling is just a change in the memory latency measured in cycles. The miss-based model addresses this weakness. The miss-based model divides the miss-interval (the time upon the face of a new L2-miss till the program reaches again the steady state) into two distinct regions (Section 4). Of course the addition of the two regions equals the memory latency. The first region includes the amount of time (in cycles) it takes to fill the entire ROB (called ROB-fill) which is not vulnerable to clock frequency scaling, aka inelastic to frequency scaling. The second region accounts for the time the processor is stalled due to the L2-miss (no instructions are issued). This time is susceptible to clock frequency, aka fully elastic to frequency scaling. The end result is that the stall-based model produces performance estimates under various clock frequencies with an error of 2.1% (average), while the estimates of the miss-based model improve to less than 0.2% error (average). In addition to modeling, we show that our methodology is powerful enough to enforce various DVFS policies at run-time. The models allow us to directly calculate the effects on performance and energy of any possible DVFS setting of interest. We show how we can derive at run-time such DVFS points for three different policies: “operate at optimal EDP,” “operate at optimal ED2P”, and “minimize ED2P within specific performance constraints.” Using detailed cycle-accurate simulations and all the benchmarks of the SPEC2K suite, we show that the proposed runtime mechanism is able to drive the above DVFS policies with great success and achieves that with minimal hardware cost: just two counters for measuring the duration of the steady state and the miss-event intervals and some comparison logic.
800% 700% 600% 500% 400%
300% 200% 100%
fmax
fmax/2 crafty
fmax/4 parser
twolf
fmax/8 art
eon
swim
ammp
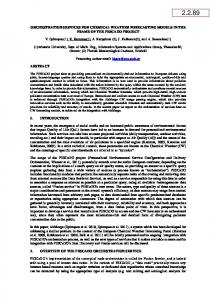
Figure 1. Performance impact by scaling the frequency in a subset of the SPEC2K benchmarks. Structure of the paper. The remainder of this paper is organized as follows: Section 2 motivates this work and discusses related work. Section 3 describes the experimental framework used in this paper. In Section 4 we present and evaluate the two proposed models. Section 5 shows how the proposed models can be used to calculate optimal EDP and ED2P V/f points. Section 6 provides the evaluation of our run-time DVFS management mechanisms. Finally, Section 7 offers our conclusions.
2. BACKGROUND, MOTIVATION AND RELATED WORK Dynamic power is proportional to f x Cload x V2 where f is the system clock frequency, Cload is the effective capacity, and V is the supply voltage [10]. If the voltage is reduced by some factor, then the dynamic power will be reduced by the square of that factor. Scaling down the voltage, however, requires a commensurate reduction in clock frequency, since transistor speed is reduced. The benefit of this is that within a given system, scaling supply voltage down offers the potential of a cubic reduction in power dissipation. This cubic relation explains the effectiveness of DVFS techniques in power/energy savings. The downside is that it may also linearly degrade performance. In addition to dynamic power benefits, reducing voltage, reduces also static power [10]. The great opportunities for power/energy savings offered by DVFS were a key incentive for designers to devise techniques for DVFS optimizations. Various techniques have been proposed that can be applied either offline, with analysis performed by the compiler, or online. As we have already mentioned, the exploitation of the system slack is at the heart of every DVFS technique. In this work, we target the instruction slack caused by long latency memory operations (off-chip accesses) i.e., we explore the use of the “memory boundeness” of a program as the key metric that should drive the DVFS decisions. Figure 1, which serves as a proof-of-concept of our work, depicts the performance impact of scaling the frequency in seven benchmarks of the SPEC2K suite. As we see, different benchmarks exhibit different DVFS behavior. It can be easily proven that the culprit is the number of off-chip memory operations. For example eon experiences a proportional increase in its execution time which means that eon represents a compute-bound application. At the other end is art, which is one of the most memory intensive benchmarks of the SPEC2K suite and as a result its performance is hardly affected by scaling the frequency. The slope is almost flat. The rest of the benchmarks stand between those two extremes. The
results presented in Figure 1 reveal that DVFS should be carefully applied to programs, otherwise system performance may be seriously hurt. Isci et. al. [6] utilize this linear relationship between the frequency and corresponding increase in execution time in order to guard the power consumed in a multiprocessor system, but as the authors point out accurate results can only be taken if the frequency is scaled within 15% of its nominal operating point. One of the first approaches for DVFS management was by Li et. al. [13]. The authors propose a heuristic mechanism, called VSV, for fine-grain DVFS management which employs an on-chip power network with two discrete supply voltages. Li et. al. employ two empirical FSMs —down and up FSM— to scale the frequency according to the amount of parallelism in the instruction stream (ILP). In the absence of ILP under an L2-miss, the voltage is scaled down and when the L2-miss is serviced the voltage is scaled up again. Although being a successful approach, Li et. al. take DVFS decisions based on heuristics and their proposal is not able to get benefit from the multiple available frequency settings that exist in modern contemporary microprocessors (e.g., 32 frequency steps in Transmeta Crusoe and 320 in the Intel XScale). In other words, Li et. al. provide a solution only for a single point of the design space. Wu et. al. [17] propose an analytical model by studying heuristic methods using dynamic compilation techniques. Their goal is to dynamically insert DVFS adjustments at locations determined to be most fruitful. To decide on the optimization, the analytic model determines whether a frequently-executing program region is memory or CPU bound. The categorization is done based on the number of the existing memory operations in each program region. If the region is clearly memory bound, it is instrumented with DVFS instructions. If the code is CPU–bound, it is left alone since slowing it down could seriously degrade performance [17]. While this model is good enough to determine the “memory-boundeness” of a program phase, it cannot predict the resultant DVFS benefit and as a consequence fails to give accurate instruction on how much to DVFS. In addition, Wu et. al. do not account for the impact of Memory-Level-Parallelism (whether a miss is isolated or occurs in parallel with other misses) and therefore their proposal leads to over-estimation of the DVFS potential. Analytical models for DVFS adjustments at compile-time have also been proposed by Xie et. al. [18] and by Maglis et. al. [14]. Xie et. al. produce an analytical model in order to explore the opportunities of compiler techniques, while Maglis et. al. use the compiler to insert reconfiguration instructions into applications using profile-driven binary rewriting, targeting mainly multiple clock-domain processors. However, compile-time techniques have limitations because they fail to capture the dynamic behavior of the applications, they require time and memory-consuming static analysis, and their results are usually input-dependent. Techniques for online DVFS management include the work of Isci et. al. [7,8]. Since most general-purpose processors include a suite of user-readable hardware performance counters, it is possible to record event counts to build up a history of program behavior. In particular, Isci et. al. demonstrate how these event counts can be viewed as identifying “fingerprints” of the program’s power behavior [8]. More recently, Isci et. al. elaborated on their technique by including a predictor that predicts future power behavior based on recently observed values [7]. Finally, while the large body of work on DVFS focused on minimizing the energy consumption, DVFS is also used for other
purposes. Srinivasan et. al. [15] utilize DVFS in order to improve the reliability of a uniprocessor system, while in [16] it is proposed to insert DVFS adjustments to mitigate the impact of process variation in CMPs. In [4,12], various techniques are proposed to avoid localized thermal problems in modern microprocessors.
3. EXPERIMENTAL FRAMEWORK Simulator and Benchmarks. The experiments are performed using a detailed, cycle-accurate simulator of superscalar processor. The execution core is a 4-way out-of-order processor. We simulate a 32K, 64 byte block, 4-way, dual-ported, 1-cycle latency, L1 data cache and a 256K, 8-way, 10-cycle, unified, on-chip L2 cache. The main memory has 200 cycles latency. The baseline configuration also includes a 64-entry ROB with a 32-entry instruction queue — smaller and larger instruction windows have also been explored and they show similar results. In this work, our intention is to assess the DVFS behavior of the applications based on their offchip data accesses, hence we use a relatively large instruction L1 to preclude instruction misses from polluting the L2. Energy estimates are based on the power models of Wattch [2]. The benchmark suite for this study consists of all the SPEC2K benchmarks. All benchmarks are run with their reference inputs. For each program, we skip the first 1B committed instructions. Finally, for the results in Section 4 (model validation), we simulate 200M committed instructions (to limit the simulation time in our experiments), while the experiments performed in Section 6 (runtime policies) are for 3B committed instructions (after skipping). Technology Parameters and DVFS Settings. We use process parameters for a 70nm CMOS technology and we assume that the highest supply voltage (Vmax) is 1V and the highest clock frequency (fmax) is 4 GHz. During frequency scaling, the voltage is scaled according to the equation: V = 0,12 f + 0,5 . As we show later in this paper, our methodology does not depend on the exact relationship between V-f (this relationship is simply an input to our models). Finally, we assume that the processor’s effective capacity (Cload) remains constant across different V/f settings. Static Power Consumption. In this work, we consider only dynamic power/energy as our target for optimization. However, our methodology can be easily extended to include leakage power; typically known during manufacturing for a range of V,f settings. On-chip and Off-chip Voltage Regulators. Traditionally, the full promise of the DVFS has been hindered by slow off-chip voltage regulators. The time overhead to switch the supply voltage using off-chip voltage regulators is in the order of microseconds and is also accompanied by a significant energy overhead [11]. Recently, significant work has been performed on integrating voltage regulators on-chip. On-chip voltage regulators offer fast voltage transitions at nanosecond time-scales and are much smaller in size compared to the off-chip voltage regulators. Unfortunately, their benefits are hampered by lower energy-conversion efficiencies. Thus, there is a trade-off between the size of the voltage regulators, the transition time they offer, and their conversion efficiencies. This trade-off is explored by Kim et. al. [11] in the context of a CMP system where per-core DVFS (using on-chip regulators) as well as chip-level DVFS (using off-chip regulators) were utilized. Our methodology does not depend on the time-scale in which DVFS decisions are taken. The two analytical models presented in the next section are able to drive informed DVFS decisions by exploring the slack due to long-latency, off-chip, memory
this area does not scale at all with frequency scaling
Instructions
Memory latency elastic inelastic area area L2 miss full stall IQ Drain ROB-fill Ramp-up
only this quantity scales proportionally with frequency scaling stall cycles as measured by the stall based model (do not scale proportionally with frequency scaling)
Steady State
Steady State c (total execution)
cycles
Figure 2. Useful instructions issued per cycle in the case of an isolated L2 load miss. Instructions miss
A
Memory latency IQ Drain
Ramp-up
ROB-fill
Steady State
full stall
c (total execution) Memory latency miss IQ Drain
ROB-fill
B Ramp-up
Steady State
full stall
c (total execution)
cycles
C
Memory latency
miss
cycles
IQ Drain Ramp-up
Steady State
ROB-fill
cycles
c (total execution) Memory latency
D
miss
ROB-fill
Steady State
c (total execution)
cycles
Figure 3. Useful instructions issued per cycle: case studies under different frequencies. operations, but over user-selected portions of the program. Thus, either fine-grained DVFS policies, using on-chip voltage regulators (at the micro-architectural level), or coarse-grain DVFS policies, using off-chip voltage regulators (at the OS level), can be orchestrated using these models.
4. INTERVAL-BASED MODELS Interval-based models, introduced by Karkhanis and Smith [9] and later refined by Eyerman et. al. [5], break the execution of a program to intervals. Steady-state intervals —where the issue rate is constrained by the width of the machine and the program’s ILP— are punctuated by miss-intervals which introduce stall cycles in the machine. Miss-intervals are due to branch mispredictions, L1 instruction and data misses, and L2-misses. By far, the L2 miss-events are the most destructive for performance and the ones bound to introduce the most stalls.
The contribution of our work in relation to previous models is twofold: 1) we use very simple models that are geared towards easy input capture at runtime; 2) we use them to model the effects of DVFS on performance and energy: performance-wise we model frequency scaling as a change in the memory latency (measured in clock cycles) and energy-wise we account for both frequency scaling and voltage scaling. The premise of our models is simple: since DVFS only affects memory latency in cycles, the only miss-intervals that are affected from frequency scaling are the ones due to the L2-misses (from an another point of view, the core, the L1 and the L2 cache are scaled as a single quantity during DVFS management). The duration of no other miss-intervals (i.e., misprediction, L1 miss-intervals) scale, in terms of clock cycles, as the frequency changes. Thus, we only need to account for the L2 miss-intervals. We discard any other miss-event since our goal is to model the relative performance/energy changes brought by DVFS. The main issue that we need to address in order to derive practical models is how to account for the cycles which are related to an L2-miss (L2-stalls). We present two models that are based on successively more accurate approximations of the L2-stalls. The stall-based model is a rough approximation that assumes that the number of stall cycles due an L2-miss is equal to the memory latency thus proportional to frequency. This is not an accurate assumption since in this way the amount of useful work gets done under an L2-miss is ignored (the stall cycles equal memory latency minus the cycles needed until the head of the ROB will be occupied by the L2-miss). In other words, the cycles in which the processor is blocked due to an L2-miss do not scale proportionally with frequency. The second model, called miss-based model, is a refinement of the first in that it ackowledges that the number of stall cycles is not proportional to frequency; the whole missinterval scales proportionally with frequency since this interval equals memory latency. Despite their approximations, these models prove to be valuable and accurate for modeling DVFS; because of their approximations, the run-time information these models need is exceedingly easy to capture. Figure 2 shows a typical L2 miss-interval of an isolated miss. The y-axis represents the useful instructions issued and the x-axis represents core cycles. Upon the occurrence of a performance critical load L2-miss, the processor continues to issue instructions at the steady-state rate for a few cycles until the ROB fills up (ROB-fill). When the miss reaches the ROB head, no more instructions can enter the issue window and the issue rate starts to drop. From this point on we have stall cycles in the processor. After a few cycles more the issue rate drops to zero —no further instruction can be issued because all the remaining instructions are
Memory latency y Memory latency
Instructions MISS1
MISS2 ST1
x
ST2
ROB-fill
Steady State cycles
c (total execution)
Figure 4. Useful instructions issued per cycle in the case of overlapping L2 load misses. dependent on the L2-miss which is still outstanding. When the requested data arrive from main memory (after Memlat cycles), the miss retires, new instructions can enter the issue window and the issue rate ramps-up until it reaches again the steady-state rate. To reason about the effects of frequency scaling we must understand how the miss-interval is affected when varying memory latency in cycles. From Figure 2 we can discern four areas in the miss-interval (starting at the L2-miss and ending when the issue rate reaches the steady state again): ROB-fill, independent instruction drain, full stall, and ramp-up (Figure 3.A). These areas are affected differently as the memory latency is reduced. The area that shrinks immediately is the full stall (Figure 3.B). When the memory latency drops to the point where the full stall area is eliminated then the drain and ramp-up areas start to shrink simultaneously (Figure 3.C). Finally, when the memory latency becomes as low as the ROB-fill time then we have eliminated all possible stalls due to the miss (Figure 3.D); further reducing memory latency cannot benefit architectural performance (IPC). We say that the ROB-fill is inelastic (Figure 2) to frequency scaling since it does not change with memory latency. In contrast, the drain and full stall areas are elastic to frequency scaling, that is, change in relation to memory latency (but not proportionally; the only quantity that changes proportionally to frequency is the memory latency). We can safely ignore the ramp-up since it only changes in conjunction with drain (when the one piggy-backs the other) and this happens only for their duration.
4.1 Stall-based Model In the simplest model we assume that ROB-fill is negligible and therefore the bulk of the L2 miss-interval is elastic to frequency scaling. As can be seen from Figure 2: Mem lat = Stall cycles + ROBfill Assuming that ROB-fill is negligible:. Stall cycles Mem lat 1 Up to now, we have been concerned with the case of an isolated L2-miss. When multiple L2-misses overlap (Figure 4), the issue rate begins to rise after the first miss has serviced but drops again when the second miss reaches the ROB head. When the data of the second miss arrive from the main memory, the issue rate rises until it reaches the steady-state rate. In Figure 4 we assume that the second miss occurs y cycles after the occurance of the first miss also the second miss reaches the ROB head x cycles after the first miss has been serviced. As a result, two separate stall intervals appear: ST1 and ST2. Observe that: ST1 + ST2 = y + Mem lat – ROB fill – x
Again if we disregard the term y-ROBfill-x we conclude that: ST1 + ST2 Mem lat 2 In the stall-based model we assume that (i) the stalls generated by an isolated miss and (ii) the sum of stalls generated by overlapping misses are both approximately equal to the memory latency (in cycles). Because memory latency is proportional to core frequency, these quantities are approximately proportional to frequency as well. Consequently, the total number of stall cycles is approximately proportional to frequency, while the total number of non-stall cycles (steady state) is independent of frequency (measured in cycles). Let c be the total cycles of a program execution and ST be the total number of stall cycles in max frequency fmax. In core frequency fmax/k the total number of cycles would be: ST c new = c – ST + ------ 3 k If the clock period under frequency fmax is Tfmax, then under frequency fmax/k the clock period is k×Tfmax. The execution time under frequency fmax/k is: t new = c new kT max = c k – ST k + ST T fmax
4
Using equation (4) we are able to predict the execution time under different frequencies by counting the total cycles and the stall cycles under frequency fmax (two counters and some comparison logic are the only hardware needed to capture the required functionality). On the other side, if the starting point is a frequency f where f=fmax/l, we can predict the corresponding values for the max frequency cfmax=c-ST+STxl and STfmax=STxl and then use in equation 4 cfmax and STfmax instead of c and ST. The advantage of this model is that only in-core information is used to predict performance under various frequencies. However, the model assumes that ROB-fill is negligible, which is a source of errors especially in benchmarks characterized by little dependence between instructions and thus large ROB-fill time.
4.2 Miss-based Model While in the stall-based model we assume that the number of stall cycles is approximately equivalent to the memory latency for both isolated and overlapping misses, in the second model we recognize that there is an inelastic area in the miss-intervals (the ROB-fill time) that does not scale with frequency (in cycles). While we do not attempt to model or measure this directly, we model its implications, especially with respect to overlapping misses. In the second model we assume that the stall cycles of only the first miss of a group of overlapping misses or the stall cycles of an isolated miss should be taken into account for DVFS.
y
Memory latency
MISS1
MISS3 serviced
x
Memory latency x MISS2
Instructions
y MISS3 MISS4
MISS4 serviced y cycles after MISS3
ROB-fill
Steady State cycles
c (total execution)
20
20.26%
Stall-based Model
15 10 5 twolf
vortex
vpr
wupwise
avg
vpr
wupwise
avg
swim swim
vortex
perlbmk perlbmk
twolf
mesa
parser
mesa
parser
mcf
mgrid
mcf
gzip
lucas
galgel
fma3d
gcc
mgrid
10
gap
facerec
eon
equake
crafty
art
bzip2
apsi
applu
ammp
0
Miss-based Model
8 6 4 2
f -> f/2
f -> f/4
lucas
gzip
galgel
fma3d
gcc
gap
facerec
equake
eon
crafty
bzip2
art
apsi
applu
0 ammp
prediction error (%)
prediction error (%)
Figure 5. A complex policy indicating the category of misses that have to be counted by the miss-based model.
f/4 -> f/2
f/4 -> f
Figure 6. Error for predicting the execution time using the stall-based model (top) and the miss-based model (bottom). We consider this approach much more viable as we only have to count misses that do not happen in the presence of other misses. Since this can easily be determined even on the memory system side, we call the second model miss-based. The information needed can be easily derived from the miss-handling registers (MSHRs) present in most modern processors. Let us investigate the following scenario shown in Figure 5. A miss occurs and before the issue rate drops to zero a second (overlapping) miss also occurs. The issue rate then drops to zero. After the completion of the first miss, the issue rate rises and then drops again because of the forwarding of the second miss to the ROB head. A third and a fourth miss occur as the issue rate rises and falls. When the first miss occurs, no other miss is in progress. This miss will be serviced after Memlat cycles. Any miss that occurs x cycles after that miss (x