TERAGRID 2007 CONFERENCE, MADISON, WI
1
Interweaving Data and Computation for End-to-End Environmental Exploration on the TeraGrid L. Zhao, C. X. Song, V. Merwade, Y. M. Kim, R. Kalyanam, D. Ebert, B. Engel, R. Govindaraju, M. Huber, C. T. Jafvert, D. Niyogi, and S. Prabhakar Abstract— This paper presents the design and implementation of a cyberinfrastructure for End-to-End Environmental Exploration (C4E4). The C4E4 framework addresses the need for an integrated data/computation platform for studying broad environmental impacts by combining heterogeneous data resources with state-of-the-art modeling and visualization tools. With Purdue being a TeraGrid Resource Provider, C4E4 builds on top of the Purdue TeraGrid data management system and Grid resources, and integrates them through a service-oriented workflow system. It allows researchers to construct environmental workflows for data discovery, access, transformation, modeling, and visualization. Using the C4E4 framework, we have implemented an end-to-end SWAT (Soil and Water Assessment Tool) simulation and analysis workflow that connects our TeraGrid data and computation resources. It enables researchers to conduct comprehensive studies on the impact of land management practices in the St. Joseph watershed using data from various sources in hydrologic, water quality, atmospheric, and other related disciplines. Index Terms— TeraGrid, Scientific Workflow, Web Services, Cyberinfrastructure, Environmental Modeling, SWAT
—————————— ——————————
1 INTRODUCTION Holistic or integrated approaches for understanding and addressing broad environmental impacts have heretofore been absent because sustained, multidisciplinary (e.g., hydrologic, water quality, atmospheric, agricultural) study of the complex and interlocking systems has not been feasible. The lack of an integrated source of relevant data and analysis tools has been a major stumbling block. Although there have been efforts in constructing multimodal simulation systems, they have been limited by unresolved heterogeneity of data, the inability to make data inputs transparent for a larger community of potential stakeholders, and outdated modes of access to data resources. With the ever increasing availability of experimental data today, it is very difficult for domain scientists to understand and be able to process the various data sources themselves.
challenges of environmental data management and integration in real-world settings. C4E4 will allow researchers to perform end-to-end environmental exploration by combining heterogeneous data resources with advanced tools for accessing, modeling, analyzing, and visualizing data.
The C4E4 project (Cyberinfrastructure for End-to-End Environmental Exploration) at Purdue aims at filling this gap by creating a facility that combines heterogeneous data resources with state-of-the-art modeling and visualization tools and easy access to researchers from multiple research communities. Distributed resources, such as those on the TeraGrid, are a major part of the infrastructure that supports C4E4 computation and data analysis. Our goal is to create a web-based platform that will enable the environmental research and remediation community to address the
The scientific questions that drive the C4E4 concern the effects of human activity on the quality of air, land and wa‐ ter resources. Environmental events occur and interact at manifold spatial and temporal scales. Monitoring, predic‐ tion, and control of adverse effects require intelligent com‐ bination of existing data with proven and novel methods of analysis, visualization, and experimental design.
————————————————
• L. Zhao, C. X. Song, Y. M. Kim, R. Kalyanam, Rosen Center for Advanced Computing, Purdue University. Email: {lanzhao, carolxsong,ymkim, rkalyana}@purdue.edu • V. Merwade, R. Govindaraju, C. T. Jafvert, Department of Civil Engineering, Purdue University. Email: {vmerwade, govind}@purdue.edu,
[email protected] • D. Ebert, Department of Electrical and Computer Engineering, Purdue University. Email:
[email protected]. • B. Engel, Department of Agricultural and Biological Engineering, Purdue University. Email:
[email protected] • M. Huber, Department of Earth and Atmospheric Sciences, Purdue University. Email:
[email protected] • D. Niyogi, Department of Agronomy, Department of Earth and Atomospheric Sciences, Purdue University. Email:
[email protected] • S. Prabhakar, Department of Computer Science, Purdue University. Email:
[email protected]
The rest of the paper is organized as follows. Section 2 discusses the scientific motivation. Section 3 describes the design of C4E4 based on a web service-enabled workflow system. Section 4 describes in greater detail the implementation in workflow composition and monitoring using the SWAT model as a real world example. Section 5 discusses related work. Section 6 presents our conclusions.
2 MOTIVATION
For example, watershed managers are concerned about sediment, nutrient, and contaminant loads at the outlet of the watershed [5, 6]. The C4E4 approach to these questions can be seen in terms of three end‐to‐end scenarios. After a major rainfall, managers want to assess how best manage‐ ment practices (BMPs) in place in, for example, the Black Creek Watershed have helped or hindered the reduction of sediment and nutrient losses. The C4E4 capabilities enable them to search databases to establish the existing BMPs in that watershed and to find any previous studies related to their efficacy. They can then search for an existing model that can be used directly or modified as needed to perform the assessment on the basis of current data. Given the pre‐ vious and current data, the C4E4’s knowledge tools may suggest appropriate model calibrations using measure‐
2
TERAGRID 2007 CONFERENCE, MADISON, WI
ments and may calculate levels of uncertainty associated with model predictions. Other science questions being addressed by C4E4 include: •
What is the impact of assimilating local information such as land use, precipitation, and meteorology on the prediction of environmental quality? Are we able to improve our predictive capabilities, and/or quantify predictive uncertainties in a better fashion?
•
How can an interface be developed for multimedia analysis involving air quality, meteorology, and water quality, as well as point, spatial, intermediate, and continuous data?
•
Are we able to better assess the sources and fluxes of sediments, nitrates and pesticides?
3 C4E4 SYSTEM DESIGN As discussed in Section 2, many vital questions in environ‐ mental sciences cannot be answered without conducting comprehensive studies based on data from various sources and disciplines. As a result, our overall goal for C4E4 is to design and develop a distributed infrastructure that enables the environmental research and remediation community to combine heterogeneous data resources with modeling and visualization tools, in order to perform end‐to‐end scientific investigation in various environmental areas. There are several significant challenges in the development of C4E4, including the heterogeneity and distribution of data sources, the lack of existing metadata and metadata stan‐ dards, the diversity of data types, formats, scales and avail‐ able access interfaces, the lack of interoperability among domain‐specific data systems, as well as the complexity of integrating diverse data sources in domain‐specific envi‐ ronmental models.
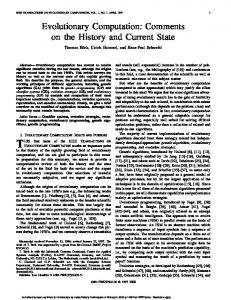
The architecture of the C4E4 system is shown in Figure 1. It consists of multiple layers. At the bottom are the distrib‐ uted data and computation resources available to the sys‐ tem. On top of it are the Purdue TeraGrid data management system and other middleware systems that manage and provide access to the underlying data and computation resources [17]. A collection of software components that perform basic tasks, including data/metadata extraction, ingestion, transformation, modeling, and visualization, are developed using the middleware interfaces. Some opera‐ tions may be developed for general use, while others have to be developed for domain‐specific research problems. At the workflow runtime environment layer, we leverage the workflow engine and visual composer of JOpera, an open‐ source workflow system developed at ETH at Zurich, for workflow composition, execution, and debugging [12]. In addition, we have developed a general‐purpose workflow monitoring service (WMS) component that supports work‐ flow status monitoring and error reporting for workflow client applications [9]. At the application layer, customized applications can be developed to invoke and monitor the workflows constructed.
Given the above challenges, our solution is to develop a web‐based integrated workflow system for environmental data modeling, analysis, and visualization. It allows a vari‐ ety of users to easily access and manipulate data relevant to Fig. 1. Architecture of C4E4 environmental workflow system the task of interest without worrying about the details of identifying, extracting, and transforming the data. With the 4 SERVICE ORCHESTRATION IN C4E4 workflow system, researchers could construct data‐driven As described above, one of the most important features of workflows, each of which consists of a pipeline of opera‐ the C4E4 architecture design is that the platform is generic tions that involves data discovery, movement, filtering, as and flexible which can be used to develop integrated, endwell as computationally intensive data processing and to-end data analysis and visualization experiments across visualization using local and TeraGrid resources. Each op‐ the environmental domain. To demonstrate this, we identieration is implemented as reusable software modules with fied a selective set of key scientific scenarios and focused on standard interfaces that could be dynamically plugged into the implementation of the corresponding workflow conpipelines to perform different end‐to‐end scientific experi‐ struction using the C4E4 framework. We started with dements. Users interact with the system through a web inter‐ veloping an end-to-end workflow using the SWAT model face which provides an interactive processing environment to study the impact of land management practices in the St. for iteration and exploration of various data interpolation Joseph watershed. This workflow consists of several web and processing options. By using the distributed TeraGrid service modules that compose and submit SWAT modeling computing resources, a user is able to run multiple jobs and jobs to a Condor cluster using Globus, transfer and parse compare results efficiently. It delegates computationally simulation results, generate plots that analyze the simulaintensive data processing to resources available through the tion results, publish the data for online viewing and TeraGrid and offers user downloadable products in com‐ downloading, and finally send a user notification upon mon file formats. completion.
ZHAO ET AL.: INTERWEAVING DATA AND COMPUTATION FOR END-TO-END ENVIRONMENTAL EXPLORATION ON THE TERAGRID
4.1 SWAT Model Adaptation The SWAT model is a comprehensive watershed management model that encompasses several disciplines. It is developed and supported by the USDA Grassland, Soil and Water Research Laboratory, Temple, Texas. It is currently only available for the MS Windows platform. In order to run SWAT on the TeraGrid Linux resources, we ported the source code of SWAT 2005 to Linux, using the Intel FORTRAN 90 compiler. The runtime performance of the adapted SWAT executable has been significantly enhanced, and a large number of SWAT runs can be dispatched and processed in parallel on the TeraGrid resources.
3
engine which is the runtime environment for the execution of workflow steps which are reusable modules written in various programming and scripting languages as well as web services invocation code. The rest of the system includes visual composer interface, status tracking, and error detection support. We have tested several popular workflow systems and decided to incorporate the JOpera workflow engine and runtime environment into the C4E4 architecture. The main advantages achieved are flexible and extensible system design, easy debugging for workflow developers in Eclipse IDE environment, and comprehensive support for different types of workflow components.
4.2 Web Services Interfaces The web services interfaces used in the SWAT workflow are implemented using Apache Axis API. The interfaces are published as WSDL by using Java2WSDL command. The implementation of the standard web services interfaces not only allows the reuse of services and components on disparate platforms, it also allows the service modules that perform basic operations to be combined easily to provide an integrated service at higher levels. The SWAT workflow modules invoke the following web services interfaces: (1) submitJob: This interface composes a SWAT simulation job based on the input parameters provided by the caller, and submits the job to the Globus Condor job manager running on the Purdue TeraGrid gatekeeper using Globus GRAM Java API [7]. It returns when the job completes its execution in the TeraGrid Condor pool. The output of the job is archived in a tar file and sent back to the submission node. (2) extractOutput: This interface extracts the specific target output files out of the tar file generated in the first step based on the simulation information the user is interested in. For example, in the case of surface runoff contribution to stream flow, the output file output.std will be extracted. (3) getData: This interface parses the extracted output file and transforms the specific simulation information into a form readable for gnuplot, a portable command line interactive plotting utility [1]. (4) gnuplot: This interface converts the data in the transformed result file into two-dimensional graphs using gnuplot Java library. The plot data is stored in portable network graphics (PNG) file format and can be viewed or downloaded through a web server. (5) sendMail: This interface receives as input the URL to the plot and sends it in an email to the user so that s/he can view the result online. Steps 3 and 4 can be invoked multiple times depending on the number of simulation field values that the user is interested in analyzing.
4.3 Workflow Composition Using JOpera Current workflow systems are mostly designed to run as a desktop application. Their core component is a workflow
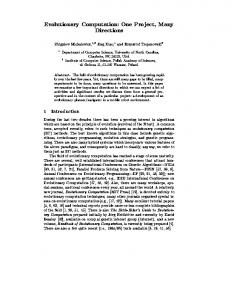
Fig. 2. Distributed SWAT workflow execution diagram
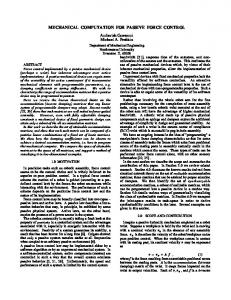
With the reusable data and computation services implemented in section 4.2, it is relatively easy to construct and execute a higher level workflow by importing WSDL files into the JOpera workspace. It automatically generates SOAP-based programs that implements each of the operations defined in the WSDL. With minimal coding effort, a prototype SWAT modeling pipeline has been constructed that composes a SWAT simulation, runs it on the TeraGrid Condor flocks, fetches the output, transforms, plots, and publishes the result, and finally sends an email notification to the user. The logical mapping of the workflow is shown in Figure 2, and the low level data flow view of the composed SWAT experiment is shown in Figure 3. The composed workflow is automatically published by the JOpera engine as a web service that could be invoked directly by either a desktop application or a web portal.
4.4 Workflow Monitoring and Error Reporting When the composed workflow is launched through a web portal interface, it is important to provide status and error information from the workflow back-end to the front-end web interface to keep the user informed of what is going on. Although JOpera provides status monitoring functionalities, they are tightly integrated with its desktop GUI client. To overcome this limitation, we have developed WMS [9], a general-purpose add-on service that provides execution status and error information to a central database, which can later be queried by third party applications in-
4
cluding web-based systems. WMS consists of a MySQL database and a web service interface that logs the status of execution of the workflow and any user defined messages. The interface accepts the user name, job id, a status string, and a message string which can be any user defined message. It can be inserted at each step of the workflow to create a record in the database indexed by the id of the current job.
TERAGRID 2007 CONFERENCE, MADISON, WI
product of the SWAT simulation, Figure 5 illustrates a data validation plot that compares the model stream flow output with the observed monthly values for the St. Joseph River.
Fig. 4. Control flow of SWAT workflow with WMS status update
Fig. 3. Data flow view of SWAT workflow
WMS also provides a web service interface for querying the status records from the database for a given job id or user name. This mechanism can be used to interface with a web portal to display the current workflow execution status by either manual polling, which involves users performing a form refresh, which then queries the database for the current status and refreshes the output page, or an automatic polling mechanism could be created by registering a listener which can poll for updates to the status records. The high level control flow view of the SWAT experiment with status tracking support is shown in Figure 4.
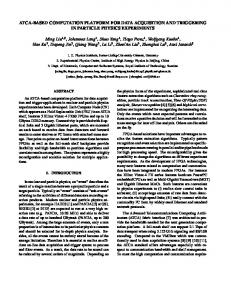
4.5 Workflow Visualization The SWAT workflow is the initial service pipeline composed that demonstrates C4E4’s capability to support an end-to-end data-driven environmental modeling and visualization experiment. It helps enable researchers to focus on the high level application questions instead of the low level details on data movement, transformation, and job submission. As a result, researchers could easily configure the parameters through a user-friendly web interface, launch an experiment, and then view the results online with no programming required. As an example visualization data
Fig. 5. Visualization of SWAT simulation result: surface runoff contribution to stream flow compared to the measured data downloaded from United States Geological Survey (USGS) National Water Information System (NWIS) website
5 RELATED WORK There are many existing workflow management systems that seek to provide a means of implementing scientific data processing pipelines [2, 4, 10, 11]. The SRB Matrix system is strongly tied to the SRB framework and provides a wrapper around specific SRB operations [16]. It uses DGL (Data Grid Language) to develop a workflow for the Matrix runtime. The Kepler system provides an interface to SRB operations. Like JOpera, it also allows users to plug-in WSDL-defined web services [2]. Taverna is another popular workflow tool focusing on web service-based bioinformatics domain and is being used in the eScience community [11]. Its latest release provides provenance support as well as a command line launcher. Chimera and Pegasus are scientific workflow tools that are tightly integrated with the
ZHAO ET AL.: INTERWEAVING DATA AND COMPUTATION FOR END-TO-END ENVIRONMENTAL EXPLORATION ON THE TERAGRID
Grid environment. It translates and optimizes abstract workflows into concrete workflows and then submits them to Condor DAGMan [4]. In the Linked Environments for Atmospheric Discovery (LEAD) project, adaptive workflows are constructed using a workflow composer XBaya to study severe thunderstorms [13]. It also uses a web interface and the java-based workflow composer could be launched via webstart. The main difference between XBaya and JOpera based workflow is the output format and how it affects testing and execution of the workflow. While XBaya exports the composed workflow to either BPEL [3] or Jython scripts, JOpera typically deploys the composed workflow as a web service to an internal web server.
6. CONCLUSION We have described the development of C4E4, an enabling infrastructure for environmental scientists to conduct holistic research at different scales using distributed and heterogeneous datasets and computation resources on the TeraGrid. C4E4 is a generic, extensible framework that uses workflow composition to support the integration of data management, discovery, transformation, and domain specific applications. Our initial work - an end-to-end service workflow based on SWAT model - demonstrates the efficiency and effectiveness of C4E4 in helping scientists study land management practices in the St. Joseph watershed. It also demonstrates the extensibility of applying this infrastructure in the study and understanding of other vital environmental issues at regional and national scales. While this paper describes the implementation and tests with a hydrological model, efforts are underway for similar tests with coupled atmospheric modeling systems such as the Weather Research and Forecasting (WRF) model, as well as the integration of heterogeneous datasets.
ACKNOWLEDGMENTS This research is sponsored in part by the National Science Foundation under grant DBI-0619086 and TeraGrid Resource Partners grant OCI-0503992.
REFERENCES [1] gnuplot homepage, http://www.gnuplot.info [2] I. Altintas, C. Berkley, E. Jaeger, M. Jones, B. Ludäscher and S. Mock, Kepler: An Extensible System for Design and Execution of Scientific Workflows, Scientific and Statistical Database Management (SSDBM'04), 2004. [3] T. Andrews, F. Curbera, H. Dholakia, Y. Goland, J. Klein, F. Leymann, K. Liu and D. Roller, Business process execution language for web services. Version 1.1, Tenical Report, IBM, May 2003. [4] E. Deelman, J. Blythe, Y. Gil, C. Kesselman, G. Mehta, K. Vahi, K. Blackburn, A. Lazzarini, A. Arbree, R. Cavanaugh and S. Koranda, Mapping Abstract Complex Workflows onto Grid Environments, Journal of Grid Computing, 1 (2003), pp. 25-39. [5] J. W. Duris, H. R. Reeves and J. L. Kiesler, "Atrazine concentrations in stream water and streambed sediment pore
5
water in the St. Joseph and Galien River basins, Michigan and Indiana, May 2001-September 2003". U.S. Geological Survey, Open-File Report 2004-1326, 19 p., 2004. [6] D. C. Flanagan, S. J. Livingston, C. H. Huang and E. A. Warnemuende, "Runoff and pesticide discharge from agricultural watersheds in NE Indiana". ASAE Paper No.032006, American Society of Agricultural Engineers, St. Joseph, MI., 2003. [7] I. Foster, Globus Toolkit Versin 4: Software for ServiceOriented Systems, IFIP International Conference on Network and Parallel Computing, Springer-Verlag LNCS 3779, 2005, pp.2-13. [8] I. Foster and C. Kesselman, "Globus: A metacomputing infrastructure toolkit", International Journal of Supercomputer Applications, 11(2) (1997). [9] R. Kalyanam, L. Zhao, T. Park and S. Goasguen, A Service-Enabled Distributed Workflow System for Scientific Data Processing, Proceedings of IEEE Int’l Workshop on Future Trends of Distributed Computing Systems (FTDCS’07), Sedona, AZ, March, 2007. [10] S. Majithia, M. S. Shields, I. J. Taylor and I. Wang, Triana: A Graphical Web Service Composition and Execution Toolkit, Proceedings of the IEEE International Conference on Web Services (ICWS'04), 2004. [11] T. Oinn, M. Addis, J. Ferris, D. Marvin, M. Senger, M. Greenwood, T. Carver, K. Glover, M. R. Pocock, A. Wipat and P. Li, Taverna: A tool for the composition and enactment of bioinformatics workflows, Bioinformatics Journal 20(17) (2004), pp. 3045-3054. [12] C. Pautasso, JOpera: An Agile Environment for Web Service Composition with Visual Unit Testing and Refactoring, VL/HCC, 2005. [13] S. Shirasuna and D. Gannon, Xbaya: A graphical workflow composer for the web services architecture, Technical Report 004, LEAD, 2006. [14] D. Thain, T. Tannenbaum, and M. Livny, "Condor and the Grid", in Fran Berman, Anthony J.G. Hey, Geoffrey Fox, editors, Grid Computing: Making The Global Infrastructure a Reality, John Wiley, 2003. ISBN: 0-470-85319-0. [15] G. Vazquez-Amabile, B. A. Engel and D. C. Flanagan, "Modeling and risk analysis of non point-source pollution caused by Atrazine using SWAT", Transactions of the American Society of Agricultural and Biological Engineers ISSN 00012351,Vol. 49(3): 667−678, 2006. [16] J. Weinberg, A. Jagatheesan, A. Ding, M. Fareman and Y. Hu, Gridflow Description, Query, and Execution at SCEC using the SDSC Matrix, Proceedings of the 13th IEEE International Symposium on High-Performance Distributed Computing (HPDC), June 2004. [17] L. Zhao, T. Park, R. Kalyanam and S. Goasguen, Purdue Multidisciplinary Data Management Framework Using SRB, SRB Workshop, San Diego, CA, February 2006, pp. 611.