clustered and that these clusters are periodic in their distri- bution across the surface of visual cortex (1-3), other senso- ry cortical areas (4-7), and non-sensory ...
Proc. Natl. Acad. Sci. USA Vol. 82, pp. 935-939, February 1985
Neurobiology
Intrinsic projections within visual cortex: Evidence for orientationspecific local connections (cortical organization/iso-orientation bands/ocular dominance/horseradish peroxidase/topography)
J. MATSUBARA*t, M. CYNADER*t, N. V. SWINDALE*t,
AND
M. P. STRYKER§
Departments of *Psychology, tAnatomy, and tPhysiology, Dalhousie University, Halifax, NS, B3H 4J1, Canada; and Department of Physiology, University of California, San Francisco, CA 94143
Communicated by Richard Held, October 1, 1984
MATERIALS AND METHODS
The functional organization of intrinsic conABSTRACT nections within area 18 of cat visual cortex was studied using combined electrophysiological and anatomical techniques. Physiological recordings were first used to map the distribution of orientation preference, ocular dominance, and receptive-field location relative to the cortical surface. Next, localized injections of lectin-conjugated horseradish peroxidase were made into physiologically identified regions within area 18. We found that (i) the local cortical interconnections are made preferentially between cell populations with orthogonal preferred orientations and are independent of the ocular dominance of the cortical cells, (it) the map of visual space in the cortex is anisotropic with the magnification factor for vertical at least twice that for horizontal visual space, and (iii) the pattern of cortical projections compensates for the functional asymmetry so that a population of interconnected cells represents a roughly circular region of visual space.
Our studies were conducted in cortical area 18 of nine normal cats. The naturally flattened surface of area 18 was ideal for mapping the surface distribution of response properties. After removal of -1 cm2 of skull and dura, we photographed the exposed brain surface. The stereotaxic position of the exposed brain surface ranged from -2.0 to +6.0 mm (posterior to anterior) and from 0.0 to 5.0 mm (lateral). The cortex was viewed through a dissecting microscope and the electrode was positioned above areas free of blood vessels. A multiple-unit recording was made at each penetration at a depth of 200-400 ,Am from the surface using extremely fine glass-coated, platinum/iridium microelectrodes (21, 22). Penetrations were spaced at '300-,um intervals in a grid-like array using the micrometer settings on a Narashige electrode holder. Each penetration was numbered and labeled on an enlarged photograph of the exposed cortical surface using the pattern of blood vessels and the micrometer readings to determine its position accurately. At each recording locus, we examined ocular dominance, orientation preference, and receptive field location. Small areas of cortex (-9 mm2) were mapped in detail, and the spatial organization of these physiological response properties was studied in relation to the cortical surface. Usually, we accumulated between 80 and 125 data points over a period of 2 days. Orientation preference, ocular dominance, and cortical positional coordinates were then entered into a computer program. The power spectra for preferred orientation and ocular dominance were obtained from a Fourier transform and the position of the peak in the spectrum was used to determine the periodicity of the response properties. Approximately 24-36 hr before the end of the recording session, horseradish peroxidase (HRP; 20% in sterile saline, cases JMM1, JMM4, 4SP) or wheat-germ agglutinin (WGA) conjugated to HRP (WGA-HRP, 1% in sterile saline, cases 6SP, 12SP, 13SP, 19SP, 35SP) was pressure-injected via glass micropipettes (tip inner diameter, 8-10 gum). Injections were made into cortical areas with similar preferred orientations or into areas with similar eye preferences. Opportunities to place an injection into a single area that possessed both similar preferred orientations and similar eye preferences were rare. Since the physiological recordings were from neurons above layer 4 (as determined by the micrometer depth readings and the absence of neural background responses associated with the inputs from the lateral geniculate nucleus), we focused the injection of tracer into the superficial cortical layers and analyzed only those labeled cells found in horizontal sections corresponding to cortical layers I-IV. The micropipette was placed initially at a depth of 700-
A variety of anatomical methods have revealed that projections of cortical neurons to other cortical areas are often clustered and that these clusters are periodic in their distribution across the surface of visual cortex (1-3), other sensory cortical areas (4-7), and non-sensory cortical structures (8, 9). More recently, periodically clustered projections have been shown to occur within a single cortical area (10-13). What role might these clustered projections play in cortical processing? In visual cortex, it is possible that such projections play a functional role related to feature extraction properties of cortical neurons. This conjecture receives support from studies showing that neurons with particular physiological characteristics are arranged in clusters on the cortical surface (14-19), and it has been the subject of theoretical discussion (20). However, to date there is no direct evidence for any relationship between local anatomical connections and physiological response properties. In an attempt to understand the rules governing the intrinsic projections of visual cortex we combined physiological recording and anatomical tracing techniques in a study of cortical area 18 of the cat. We report here evidence for the roles of orientation selectivity and topographic representation on the specificity of local intracortical connections. Our findings indicate that (i) cortical cells receive a projection from nearby cortical cells whose averaged best orientation is approximately orthogonal to their own, (ii) the cortical magnification factor is anisotropic, and (iii) the local projections compensate for the anisotropy in the cortical magnification factor so the overall area of visual space represented by a population of interconnected cells is roughly circular. The publication costs of this article were defrayed in part by page charge
payment. This article must therefore be hereby marked "advertisement"
Abbreviations: HRP, horseradish peroxidase; WGA, wheat germ agglutinin.
in accordance with 18 U.S.C. §1734 solely to indicate this fact.
935
936
Proc. NatL Acad Sci. USA 82
Neurobiology: Matsubara et alt
,rit..4.C.K
1%
3-.
3m
,::
3
(1985)
114
6 4&,0
'i
1 e-,O,
1*631-4. 4 04.
A9N
I
I
4"
* t ,
4'i
*
*'
*Ii
=
4%i
*
4T a
*
,Jf. I,
$
* -
,.
4
*
' .% CotrolJ *>8is
S
.4
,
*
s..
*@s##''t'u'.
4..
..' F. .-
'a
. *
. p;
Injection
Projection
00
00 ca
E. F.
O-
l
n= 26
n= 14
8 4 .
00
p = 1900
= 105°
n=4
8 4-
Control
6SP
8]
6SP
1 23 456
1 234 56 7
1
FIG. 1. (Legend appears at the bottom of the
2 34 567
next
page.)
e
Neurobiology: Matsubara et aL 800 ,m from the cortical surface. At this depth, 10-15 nl (measured as a calibrated drop in the meniscus level of the micropipette) of HRP or WGA-HRP was injected by pressure. The micropipette was then immediately brought up to a depth of 300-400 gm from the surface and left in situ for 5 min. This procedure resulted in a conical-shaped injection site: the diameter of the injection site was largest in the upper cortical layers and gradually tapered toward white matter. Fluorescent dyes were injected into other nearby cortical areas and served as landmarks for histological reconstructions. Twenty-four to 36 hr later, the animals were deeply anaesthetized and perfused with phosphate buffer followed by either 4% buffered paraformaldehyde, or a mixture of 2.5% buffered paraformaldehyde and 0.5% buffered glutaraldehyde. This was then rinsed with a solution of 10% buffered sucrose. Cortical blocks were sectioned horizontally, tangential to the surface of area 18. The ipsilateral lateral geniculate nucleus was sectioned in the coronal plane. Sections were cut at a thickness of 40-60 Aum and were processed by the tetramethylbenzidine procedure (27).
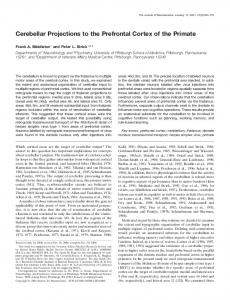
RESULTS Our physiological data revealed the following topographic features of neuronal responses in area 18: (i) The vertical (elevational) and horizontal (azimuthal) components of receptive-field location are mapped in the cortical anteroposterior and mediolateral planes, respectively (23). We observed a marked anisotropy in the retinotopic map with the magnification factor for vertical being at least twice that for the horizontal (24). (ii) Neurons with similar eye dominance properties were clustered. In six animals, the periodicity of these clusters as determined by spectral analysis ranged between 1.2 and 1.8 mm. We did not observe a consistent direction of elongation of these clusters (25). (iii) In the same six animals, the cells responding best to a given range of stimulus orientations were located within elongated, branching bands running approximately from posteromedial to anterolateral across the cortical surface (Figs. 1 A and B and 2 A and B). The period of these isoorientation bands, as determined by spectral analysis, was remarkably constant and averaged 1.23 ± 0.03 mm (25). Injections of HRP and WGA-HRP produced several aggregates of labeled cell bodies within 2 mm of the injection
Proc. NatL. Acad. Sci. USA 82 (1985)
937
site. In addition, the WGA-HRP-labeled cells were surrounded by a granular type of reaction product characteristic of anterograde and/or collateral transport. An example of the number and size of the clusters of labeled cells is shown in Fig. 1 C and D. Charts of the injection sites, marker sites, and labeled cell bodies were drawn at both low and high magnification using drawing tubes attached to a Wild dissecting microscope and a Leitz compound microscope. The charts were enlarged or reduced to the same magnification as the photograph of the cortical surface and then aligned with it using the injection site and marker lesions as references. Thus, we were able to make a direct comparison of the location of the labeled cell bodies in the upper two-thirds of the cortex and the topographic maps describing the physiological responses (Figs. 1 A and B and 2 A and B). This comparison provided the following correlations: (i) Injections into iso-orientation domains with a range of 450 or less labeled cell bodies in regions where orientation preferences were roughly orthogonal to those of the injection site cells. We observed this for four cases in which the injection site was confined to an iso-orientation domain of 450 or less (Figs. 1E and 3A). The angular differences between the mean preferred orientation (26) of the injection site (a) and the projection areas (,3) in these four cases are 850 (6SP), 76° (4SP), 860 (19SP), and 760 (12SP, not shown). In two other cases, the injection site spanned a greater range of preferred orientations (450-900), and the projection areas also spanned greater orientation ranges. Nevertheless, the angular differences between averaged orientation values for injection and projection areas were 730 (35SP) and 860 (13SP). (ii) The cortical region in which labeled cells were found extended further in the anteroposterior than the mediolateral direction (Figs. 1 and 2). This was observed for all six WGAHRP injections regardless of the best orientation of the cells within the injection site and is consistent with earlier studies on silver-stained material, indicating that the majority of fibers run along the anteroposterior axis in cat visual cortex (28). The anisotropy in the cortical magnification factor is complemented by the anisotropy in the local anatomical connections such that the accumulated receptive field for a population of labeled cells (arising from a single injection) corresponds to a roughly circular area of visual space (Fig. 4). (iii) No correlation between the ocular dominance distri-
FIG. 1 (on preceding page). Physiological responses (A, B, E, and F) and tetramethylbenzidine-reacted tissue (C and D) of case 6SP. (A and B) Preferred orientations (A) and ocular dominance values (B) are labeled over the recording sites in the dorsal surface diagrams of the exposed cortical tissue. For clarity, only the major blood vessels are illustrated. A, B, and C represent the same area of tissue and the anterior (A) and medial (M) axes are labeled in C. Ocular dominance values were determined using a seven-point scale (C = 1-3, B = 4, I = 5-7) and best orientations were defined in hour and minute values on a clockface (6:00, vertical; 3:00, horizontal). Cortical areas with preferred orientations centered at horizontal (range, ±450 or clockface values of 1:30 to 4:30 exclusive) are shaded. These iso-orientation domains form elongated branching bands running approximately posteromedial to anterolateral. A microinjection of WGA-HRP was placed into a group of cells with best orientation angles slightly off horizontal (hatched circular area). Labeled cell bodies are represented as stippled squares (each square represents 10 cell bodies). Three of the four clusters of labeled cells were within physiologically identified areas. Our analysis does not include the clusters of labeled cells that fell outside the physiologically identified areas. (C and D) Processed tissue was photographed in dark-field through cross-polarizing filters (C). Clusters of labeled cell bodies (arrows) were charted for sections of tissue and were aligned with the physiological map using marker injections (not illustrated). As in all our cases, the region over which we found labeled cells extended further in the antero-posterior than in the mediolateral direction. A bright-field enlargement of one cluster of labeled cells (outlined in dashed box in C) is shown in D. (E and F) Raw data of A and B are schematized. The orientation preferences (E) and ocular dominance distribution (F) of the cells within the injection site (Injection) are compared to those within the areas containing labeled cell bodies (Projection). In E, the orientation of each line represents the preferred orientation angles of each recording site, while the length of each line is proportional to the number of recording sites at which that best orientation was obtained. The number of recording sites (n) contained within the injection site or the labeled cell regions is indicated. Averaged preferred orientation, calculated by the double-angle method of Krumbein (26), for the set of cells within the injection site (a) and the projection areas (X3), is shown (open line with asterisk). Angular difference between a and f3 for 6SP is 85°. To examine the specificity of this projection, we then determined the orientation preferences of all cells within a circular region surrounding (but not including) the injection site (Control). We used the maximum distance between the injection site and labeled cells as the radius of the control area. Note that a variety of preferred orientations are represented in the Control column, yet the labeled cell bodies were found specifically in those areas with orientation preferences centered roughly orthogonal to the average preferred orientation of the injection site cells. The ocular dominance distribution of the injection site, projection areas, and surrounding control areas for case 6SP is shown in F. In this case as well as all others (some of which are shown in Fig. 3B), we found no consistent rule relating the ocular dominance distribution of cells within the injection site to that of the projection areas.
938
Neurobiology: Matsubara et al.
Proc. NatL Acad Sci. USA 82 Projection
Injection
A
LA
00
a=
(1985)
Control 00
530
1290
A n=8 n=8 00 a = 1060
>4
n= 7
15
81
B
n=
1234567
4SP
00
1920
n=37 9 24
0
SP
16
8]
[ 4o
46
1 234567
1234567 24-
o
16-
8-
81
l
rnq3 1234567
1234567
A
0
3 1 2 345 6 7
butions of the injected and labeled cells was evident even when the injections were centered on contralateral or ipsilateral eye clusters (Figs. 1 B and F, 2B and 3B). In two cases, the injections were centered on cortical sites at which visual responses were evoked primarily through the contralateral
1JMM1
1234567
24-
L_)
FIG. 2. Distribution of physiological responses in relation to the cortical surface of case 19SP. As in Fig. 1 A and B, preferred orientation (A) and ocular dominance (B) are labeled over the recording sites in the surface diagrams of the cortical tissue. In A, the cortical areas with preferred orientations centered around horizontal (range, ±45°) are shaded. A microinjection of WGA-HRP was placed in a group of cells with orientation preferences centered slightly off the horizontal (hatched circle). Labeled cell bodies were found in distinct clusters surrounding the injection site, and two of the three clusters were within the physiologically mapped area. Both of these clusters were in areas previously shown to have orientation preferences centered near vertical (6:00). Each stippled square represents 20 labeled cell bodies. The population of labeled cells are distributed further in the anteroposterior rather than in the mediolateral direction. The ocular dominance distribution of the cells within the injection site is shown in B. The site of the injection was chosen for its homogeneous orientation preferences. Ocular dominance distribution includes ipsilateral-, binocular-, and contralateral-eye-dominated points. Data are graphed in Fig. 3.
9
01
0
01234567
06
JMM4 1 2 34 56 7
FIG. 3. Physiological responses of cells within injection sites and projection areas. (A) As in Fig. 1E, the orientation preferences of responses within an injection site (Injection) are compared with those within areas containing labeled cell bodies (Projection). The orientation of each line represents the preferred orientation angles of neurons recorded at each site, while the length of each line is proportional to the number of recording sites at which that best orientation was obtained. As in Fig. 1, the number of recording sites (n) within the injection site, labeled cell regions, and control areas are indicated. For case 4SP, the mean angle (a) of the preferred orientations for recording loci within the injection site is 530 (open line with asterisk). Labeled cell bodies were found in areas with a mean preferred orientation (/3) of 1290. The difference between a and is 76°. The injection site in 19SP was centered on a group of cells with preferred orientations slightly off the horizontal (mean angle a = 1060). Labeled cell bodies were found in areas with a mean preferred orientation (,B) of 1920. The difference between and in 19SP is 860. As in Fig. 1E, the column labeled Control represents the orientation preferences of recording sites surrounding but not including the injection site. Again, note that virtually all orientations are represented in the Control column for both 4SP and 19SP, yet the local connections are made specifically between sets of cells with roughly orthogonal preferred orientations. (B) Ocular dominance distribution of cells labeled after injections of HRP into cortical areas in which visual responses were evoked primarily through the ipsilateral eye (19SP and JMM1) or the contralateral eye (JMM4). Ocular dominance distribution of the areas that contain labeled cells (Center) is not qualitatively different from those of the Controls (Right). Controls were calculated as described for the preferred orientations (Fig. 1E). a
In one of these (6SP), the labeled cell bodies were found in areas in which visual responses were evoked through the contralateral eye as well as in other areas in which the responses were evoked primarily through the ipsilateral eye. In the other case (JMM4), the labeling was found in areas in which visual responses were evoked primarily through the contralateral eye. In 19SP and JMM1, the injection sites were centered on
eye.
Neurobiology: Matsubara et aL
Proc. Natl. Acad. Sci. USA 82 (1985)
120100 80 60 40 20 vm -
80 *
1 P 2*
100
*
*
*t
120
*
14
*
**
12SP
cause the anatomical connections extend further in the anteroposterior than in the mediolateral direction. The anisotropy in the cortical projections compensates for the anisotropy in the cortical magnification factor, which causes a given circular area of cortex to map onto a horizontally elongated elliptical zone in visual space. Hence, the intrinsic connections restore a functional symmetry to receptive field location in visual space at the expense of anatomical symmetry.
*
*
.16
939
13SP
FIG. 4. Receptive field centers of cells in the injection site and the projection areas in 12SP and 13SP. Centers of receptive field locations of cells recorded within the injection site (open symbols) and the projection areas (solid symbols) are plotted onto axes of visual space. Contralateral hemifield is represented on the left of the vertical meridian (vm); recording sites were confined to the representation of the lower visual field. Because vertical and horizontal components of visual space are mapped onto the cortex unequally, the receptive field centers of cells within the circular injection site cover a horizontally elongated region of visual space. If the projection cells were distributed within a circular area surrounding the injection site, then the accumulated receptive field centers of all the projection cells (solid symbols) would also cover a horizontally elongated region of visual space. Instead, the projection cells spread further along the anterior-posterior axis in the cortex. Hence, the projection cells cover a roughly circular region of visual space surrounding that corresponding to the injection site.
cortical areas influenced mostly by stimuli viewed through the ipsilateral eye, and in both cases the majority of labeled cells was found in areas influenced primarily by stimuli viewed through the contralateral eye. However, because stimuli viewed through the contralateral eye influenced the majority of cortical responses surrounding these injection sites, the specificity may be more apparent than real (Fig. 3B, Control).
DISCUSSION Our results show that injections of a retrograde tracer into iso-orientation domains fill cell bodies in surrounding cortical areas that were shown by physiological recordings to have orientation preferences, on average, orthogonal to those of the cells within the injection site. It seems likely that such a connection (e.g., horizontally oriented cells projecting to vertically oriented cells) is y-aminobutyric acid (GABA)-mediated. Such inhibitory connections would enhance orientation selectivity by narrowing the range of stimulus orientations that excite a given cortical cell. Indeed, previous physiological studies have shown that the orientation specificity of cortical cells decreases and is often eliminated completely after the application of bicuculline, a GABA antagonist (29-31). An alternative hypothesis (20), that of cells connecting to other cells with similar (i.e., parallel not orthogonal) orientation preferences is inconsistent with our findings. There exists another relationship between the intrinsic anatomical connections and the physiological response properties. Cells projecting to a given region in cortex have receptive fields that, when taken as a population, evenly surround the receptive fields of the injected cells (Fig. 4). However, this circular surround in visual space is achieved only be-
We wish to thank L. Colpitts and J. Hickey for excellent technical assistance and Drs. B. Moore, C. Baker, D. Phillips, K. Grasse, and T. Platt for helpful suggestions throughout the project. This work was funded by Medical Research Council of Canada Postdoctoral Fellowship (J.M.) and Medical Research Council Grant PG-29 (M.C.), Natural Sciences and Engineering Research Council of Canada Grant A-9939 (M.C.), National Foundation-March of Dimes Grant K04-EY 00213 (M.P.S.) and National Institutes of Health Grant R01-EY 02874 (M.P.S.). 1. Livingstone, M. & Hubel, D. (1983) Nature (London) 304, 531532. 2. Gilbert, C. D. & Kelly, J. (1975) J. Comp. Neurol. 163, 81-106. 3. Gilbert, C. D. (1983) Annu. Rev. Neurosci. 6, 217-247. 4. Imig, T. & Brugge, J. (1978) J. Comp. Neurol. 182, 637-660. 5. Imig, T. & Reale, R. (1980) J. Comp. Neurol. 192, 293-332. 6. Jones, E., Burton, H. & Porter, R. (1975) Science 190, 572574. 7. Friedman, D. (1981) in Cortical Sensory Organization: Multiple Somatic Areas, ed. Woolsey, C. (Humana, Clifton, NJ), Vol. 1, pp. 121-161. 8. Goldman-Rakic, P. & Schwartz, M. (1982) Science 216, 755757. 9. Goldman, P. & Nauta, W. (1977) Brain Res. 122, 393-413. 10. Gilbert, C. & Wiesel, T. (1983) J. Neurosci. 3, 1116-1137. 11. Rockland, K. & Lund, J. (1982) Science 215, 1532-1534. 12. Rockland, K. & Lund, J. (1983) J. Comp. Neurol. 216, 303318. 13. Rockland, K., Lund, J. & Humphrey, A. (1982) J. Comp. Neurol. 209, 41-58. 14. Hubel, D. & Wiesel, T. (1962) J. Physiol. (London) 160, 106154. 15. Hubel, D. & Wiesel, T. (1968) J. Physiol. (London) 195, 215243. 16. Hubel, D. & Wiesel, T. (1974) J. Comp. Neurol. 158, 267-294. 17. Hubel, D., Wiesel, T. & Stryker, M. P. (1978) J. Comp. Neurol. 177, 361-380. 18. Albus, K. (1979) Exp. Brain Res. 37, 609-613. 19. Singer, W. (1981) Exp. Brain Res. 44, 431-436. 20. Mitchison, G. & Crick, F. (1982) Proc. Natl. Acad. Sci. USA 79, 3661-3665. 21. Cynader, M., Berman, N. & Hein, A. (1976) Exp. Brain Res. 25, 139-156. 22. Wolbarsht, M. C., MacNichol, E. F. & Wagner, H. G. (1960) Science 132, 1309-1312. 23. Tusa, R., Rosenquist, A. & Palmer, L. (1978) J. Comp. Neurol. 185, 657-678. 24. Matsubara, J. & Cynader, M. (1983) Soc. Neurosci. 13, 141.6
(abstr.). 25. Cynader, M., Matsubara, J. & Swindale, N. V. (1983) Soc. Neurosci. 13, 141.5 (abstr.). 26. Batschelet, E. (1981) in Circular Statistics in Biology, ed. Batschelet, E. (Academic, London), pp. 231-256. 27. Mesulam, M. (1982) in Tracing Neural Connections with Horseradish Peroxidase, ed. Mesulam, M. (Wiley, New York), pp. 1-212. 28. Colonnier, M. (1964) J. Anat. 98, 327-344. 29. Concetta Morrone, M., Burr, D. & Maffei, L. (1982) Proc. R. Soc. London Ser. B 216, 335-354. 30. Sillito, A. (1977) J. Physiol. (London) 271, 699-721. 31. Sillito, A. (1979) J. Physiol. (London) 289, 33-50.