Introducing the Evaluation of Complexity in Functional Size Measurement: a UML-based Approach Luigi Lavazza
Gabriela Robiolo
Dipartimento di Informatica e Comunicazione Università degli Studi dell’Insubria Via Mazzini, 5 – 21100 Varese, Italy +39 0332 218930
Facultad de Ingeniería Universidad Austral Av. Juan de Garay 125, 1063 Bs.As., Argentina +54 11 5921 8000
[email protected]
[email protected]
ABSTRACT Functional Size Measures are often used for effort estimation. However, these measures do not take into account the amount and complexity of elaboration required, concentrating instead on the amount of data accessed or moved. Methods for measuring the functional complexity have been proposed, but, being based on the textual description of requirements, are not very easy to apply. In this paper we show that measurement-oriented UML modeling can support the measurement of both functional size and functional complexity. We show, by means of a case study, that it is reasonably easy to derive different types of functional size measures, as well as complexity measures, from UML models. We show also that it is possible to build models for effort estimation that use the functional size and complexity measures as independent variables.
Categories and Subject Descriptors D.2.8 [Software Engineering]: Metrics – product metrics.
General Terms Measurement.
Keywords Functional size measurement; Function Points, COSMIC function points; UML-based measurement; effort estimation; Use casebased measurement; functional complexity measurement.
1. INTRODUCTION In software industry, Functional Size Measurement (FSM) is currently the most popular way of measuring software requirements for cost estimation purposes. In the 70’s Allan Albrecht introduced Function Point Analysis (FPA) as a way of measuring “the function value delivered to our customer” [1]. FSM was soon recognized as a valid alternative to the use of lines of code in effort estimation: since it is applicable to requirements, it can give an idea of the size of the product in
Permission to make digital or hard copies of all or part of this work for personal or classroom use is granted without fee provided that copies are not made or distributed for profit or commercial advantage and that copies bear this notice and the full citation on the first page. To copy otherwise, or republish, to post on servers or to redistribute to lists, requires prior specific permission and/or a fee. ESEM’10, September 16-17, 2010, Bolzano-Bozen, Italy. Copyright 2010 ACM 978-1-4503-0039-01/10/09…$10.00.
the early stages of development, when effort estimation is most needed. The original proposal by Albrecht was adopted by the International Function Point User Group (IFPUG), which managed the evolution of the technique through several releases of the Function Point (FP) counting manual [10]. Function Points (in their unadjusted version) were also recognized as an international standard [12]. Several variations of FP (Mark II [11], NESMA [14], FiSMA [15]) were also defined and standardized. Finally, COSMIC has proposed yet another variation of FSM [13][7], intended to correct a few theoretical and practical problems with FPs. However, all the mentioned variations of FSM have a limitation, quite well described in the COSMIC Function Point measurement manual [7]. Requirements specifications typically describe a set of processes (named elementary processes or transactions in FPA, and functional processes in the COSMIC method) which consist of data elaborations and data movements. Neither FPA nor COSMIC addresses the measurement of data elaborations. This implies that two applications that perform the same amount of data movements but a different amount of data elaborations are considered of the same size. This is a problem, since in general the application involving more data elaborations requires a bigger development effort. Today the problem is party solved by moving the evaluation of the amount of elaboration from the functional size measurement to the effort estimation activity. In fact, most effort estimation models require as input not only the functional size, but also a set of parameters that describe the product to be developed, including parameters that characterize the elaboration being performed. In some cases the effort estimation is based on rough approximations: all the developments of a given class of applications are considered characterized by the same productivity. In other cases, more specific characterizations are requested: for instance COCOMO [4][5] requires that the ‘complexity’ of the elaboration is estimated. Robiolo et al. proposed to enhance the effort prediction capability of FSM by counting the ‘transactions’ (T) and ‘paths’ (P) that are described in use cases [29][30][31]. The concept of transaction described in [31] is similar to the concept of transaction in FPA, in that it concerns the interactions of the external users with the system, but it is substantially different as in [31] transactions are identified at a finer granularity level (a FPA transaction can correspond to multiple T transactions). On the contrary, the measurement of paths is completely new with respect to FPA: it addresses the complexity of use cases, thus providing a measure of the amount of elaboration performed in a given transaction. In
fact, in [30] it is shown that measurement of transactions and paths can substantially improve the precision of effort prediction with respect to FP-based estimations. Note that at the considered abstraction level, i.e., at the level of requirements specifications, the concepts of ‘amount of elaboration’ and ‘complexity of the elaboration’ are practically equivalent. In particular, the measure of transactions described in [31] is a measure of the amount of elaboration, since it takes into consideration how many different types of processing may occur in use cases; it is also a measure of complexity, at least in the sense of McCabe’s complexity [26], as explained in Section 3. Lavazza et al. have shown that the measurement of both FP and CFP can be based on suitable UML models [22][23][24][25]. For organizations that adopt UML as the notation for requirements specification and design, basing FSM on UML diagrams has the benefit that measurement requires very little additional effort, and is more reliable, since there is little risk that the requirements specification artifacts are not correctly understood. Quite interestingly, UML models that are suitable for supporting FSM include the description of use cases and scenarios, through use case diagrams and sequence diagrams. It is therefore natural to think of combining the metrics proposed by Robiolo et al. with UML based measurement, exploiting the description of use cases which are available in UML diagrams. In this paper we explore the possibility of enhancing purely functional measures with measures of complexity that are derived from the UML description of use cases. The expected results are: –
–
A more rigorous and precise definition of the concepts illustrated in [30], thanks to the underlying UML model that describes the elements being counted. A measurement technique that is applicable both for deriving new measures (the transactions and paths) and to enhance existing FSM techniques, namely FP and CFP. In fact, maintaining a certain level of compatibility with existing proposals is important in order to make the new measures applicable in industrial contexts, with existing tools and in combination with historical data sets. External_library
–
Measurement procedures that are applicable to UML models in a quite straightforward way. This is important to favor the acceptance of the method in UML-based development processes. In the future it will even be possible to address the automation of the proposed measurement procedures. The paper is organized as follows: section 2 illustrates a case study that is used throughout the paper; section 3 summarizes the measure of transactions and paths proposed by Robiolo; section 4 describes the UML-based measurement of the proposed metrics; section 5 discusses the use of path measures in combination with functional size measures in the prediction of effort; section 6 accounts for related work, while section 7 draws some conclusions.
2. CASE STUDY We consider a simplified version of a library management system. Because of space limits, only two use cases are illustrated: the login process and the process of borrowing a book (see Figure 1). System BorrowBook
TheUser
ForgottenPasswdManagement EmailSystem
Figure 1. Use case diagram of the simplified library management system. Figure 2 describes the system, highlighting the interfaces that make external interactions possible, and the logical data managed within and outside the system. Throughout this section the system to be measured is modeled according to the measurement-oriented modeling technique described in [22].
+SecretQuestion(question) +Show(message) BookBorrowInterf +Request(book) +Reserve(book)
EmailInterf +SendEmail(address, message)
+Login(UserID, Passwd) +ForgottenPasswd(UserID) +SecretAnswer(answer)
UserInterf
ExternalLibrary
Login
+IsOwned(book) +Require(book)
RetrieveBookFromExternalLibrary
User
ExternalLibInterf
LoginInterf
BookReservation
EmailServer
TheSystem
SystemState
BookCatalogue Book_Catalogue
State
RegisteredUsersInterf +VerifyLogin(UserID, Passwd) +GetSecretQuestion(UserID) +GetSecretAnswer(UserId) +GetPasswd(UserID) +getAddress(UserID)
RegisteredUsers UserCatalogue
Figure 2. The component diagram describing the structure of the simplified library management system.
The login process involves the management of two possible situations: –
user can try to log in. The user does not remember the password. In such a case, the system issues a question that was decided by the user during the registration process. If the answer of the user is correct, the password is sent by email to the address specified by the user during the registration. These two possible situations correspond to two “scenarios” in use case terminology: the main scenario is illustrated in Figure 3, while the alternative scenario is given in Figure 4.
–
The user tries to log in by providing a UserID and a Password. The system, which contains a catalogue of registered users, where the pairs of the registered users are stored, verifies if the pair provided by the user is correct: if so, the user is enabled and the process terminates; otherwise, a diagnostic message is issued, and the user can retry to log in. For simplicity, here we do not limit the number of times the sd Login_main_scenario : TheUser
: TheSystem
: RegisteredUsers
: SystemState
alt [User remembers password] loop [not Enabled]
1 : Login(UserID, Passwd)
2 : Verif yLogin(UserID, Passwd) 3 : Enabled
alt 4 : Set_current_user(UserID)
[Enabled == Ture] 5 : Show("LogIn Accepted")
[else]
[else]
6 : Show("Login Rejected")
ref Login_alternate_scenario
Figure 3. Login process: main scenario. sd Login_alternate_scenario : TheSystem
: TheUser
1 : ForgottenPasswd(UserID)
4 : SecretQuestion(question)
: RegisteredUsers
2 : GetSecretQuestion(UserID) 3 : question
5 : SecretAnswer(answer) 6 : GetSecretAnswer(UserId) 7 : secret_answer alt
8 : GetPasswd(UserID)
[answer == secret_answer]
9 : passwd 10 : getAddress(UserID) 11 : address 12 : SendEmail(address, message)
13 : Show("Password emailed“)
[else]
14 : Show("Incorrect answer“)
Figure 4. Login process: alternative scenario.
: EmailServer
A common problem with scenario modeling is deciding the correct level of granularity of the description. In fact, the modeler can decide to put more or less details in the description of the use case. In our case, the correct level of detail is suggested by the FSM method being adopted. Suppose we want to measure the system in a manner that is compatible with FPA: we should represent the File Types Referenced (FTR) –RegisteredUsers and SystemState– and the external elements –TheUser, the EmailServer– as the component instances that exchange messages, and the parameters of the messages that cross the boundaries of the system –UserID, Passwd, Enabled, question, answer, etc.– since they indicate the Data Element Types (DET) to be counted.
sure that movements involving the Internal Logic Files (ILF) are modeled. The borrowing process starts when the user asks for a book and evolves in two possible ways: –
The library owns the book: if the book is available the loan is immediately granted to the user; otherwise (i.e., the book is currently borrowed by another user), the current user can reserve it (possibly joining a queue). – The library does not own the book. The system checks whether the book is available at other libraries. If so, the user can make a reservation. The borrowing process is described by Figure 5, which represents the main scenario, and Figure 6, which represents the alternative scenario.
It must be noted that choosing a different FSM method generally implies minor differences in the level of detail: for instance if we used the COSMIC FSM, we should model data movement at the class level instead of the attribute level; moreover we should make sd Borrow_book_main_scenario : TheSystem
: TheUser 1 : Request(book)
: BookCatalogue
2 : IsOwned(book) 3 : owned
alt ref [owned == False] Borrow_book_alternative_scenario
4 : IsAvailable(book)
[else]
5 : available alt
6 : Get_current_user()
[available == True]
7 : user_id
8 : Register_loan(book, used_id) 9 : Show("Loan granted")
[else]
opt
10 : Show("Book unavailable. Reserve?")
11 : Reserve(book) 12 : Reserve(book)
Figure 5. Book borrowing process: main scenario.
: SystemState
sd BorrowBook_alternative_scenario : External_library
: TheSystem
: TheUser
: SystemState
: BookCatalogue
1 : IsOwned(book) 2 : owned
opt [owned == True] 3 : Show("Available at other library. Reserve?") opt 4 : Reserve(book): void
5 : Require(book) 6 : Get_current_user() 7 : user_id 8 : Reserve_external(book, user_id)
9 : Show("Reservation from external library requested")
Figure 6. Book borrowing process: alternative scenario.
3. TRANSACTIONS AND PATHS Use Cases are widely used for requirements definition. Because of their popularity, researchers have tried to define units of size based on use cases for effort estimation purposes: Use Case Points (UCP) [18][19] are the most known proposal. However, to this end, use cases have a rather important limitation, in that they do not represent well the amount of elaboration involved in the processes they represent (the number of transactions is represented only via an ordinal scale, and the complexity of the elaboration is evaluated only at the application level as an element of the ‘technical complexity factor’, which is used to weight UCP for estimation purposes [18]).
descriptions the same measure applied by McCabe to code. Every different path in a given use case scenario contributes to the measure of the use case’s complexity. Paths are identified at a granularity that can sometimes be finer than scenarios: if a given scenario contains alternatives, multiple paths are counted. For instance, in the Login process there are 5 paths, corresponding to the different alternatives: –
The user thinks he/she remembers the password and logs in successfully;
–
The user thinks he/she remembers the password but fails indefinitely to log in;
–
The user thinks he/she remembers the password: after a few failures he/she logs in;
–
The user does not remember the password, and provides the correct secret answer;
Transactions count the number of stimuli originated by the users and addressed to the system. For instance, in the Login process shown in Figure 3 and Figure 4, there are three ‘transactions’: the initiation of the process, the choice of the ‘forgotten password’ option, and the answer to the question.
–
The user does not remember the password, and fails to provide the correct secret answer.
It must be noted that the name of the metric is a bit misleading for people used to FPA terminology: Robiolo’s transactions are at finer granularity level than FPA transactions [9]. For those using the COSMIC FSM method, Robiolo’s transactions are quite similar to the ‘entry’ data movements [7].
4. UML-BASED MEASUREMENT
In order to improve this situation, Transactions (T) and Paths (P) were defined as simple measures of size and complexity, respectively, based on information typically available from use case descriptions [28].
However, counting transactions is straightforward, since they account for the information provided by the users to the system. In a UML sequence diagram transactions correspond to messages sent by the users to the system. The measure of the complexity of use cases is based on the application of the principles of McCabe’s complexity measure [26] to the descriptions of use cases in terms of scenarios. In fact, use cases are usually described giving a main scenario, which accounts for the ‘usual’ behavior of the user and system, and a set of alternative scenarios, which account for all the possible deviations from the normal behavior that have to be supported by the system. Robiolo et al. [28] apply to the use case textual
Paths can be counted very easily on the basis of the UML sequence diagrams describing the scenarios, as illustrated in section 4.
On the basis of the diagrams reported in Section 2 it is quite easy to measure the functional size of the system according to traditional FSM methods. In this Section show how to measure the size of the simplified library management system using FPA and the COSMIC method. The measurement of function points begins with the identification of the transactions: the login and the borrowing processes. The login transaction is quite clearly an External Input transaction, while the classification of the borrowing process is not so immediate, because of the inherent ambiguity of the classification criteria proposed by IFPUG: if we consider that the main intent of the transaction is to provide the user with an answer to his/her request, we have an External Output; instead, if we consider that the main intent is to register the loan or the reservation in the system, then we have another External Input. Here we adopt the latter view.
In any case, the FTR and DET of both transactions are easily identified, as described in Table 1. Table 1. BFC and measure of Function Points Trans.
FTR
DET
Login
RegisteredUsers SystemState
Book Borrow.
RegisteredUsers SystemState BookCatalogue
UserID, Passwd, message, enabled, operation trigger Book, message, owned
Trans. Type & Compl. EI, Average
FP
4
EI, Average
4
Total
8
The measurement of COSMIC function points begins with the identification of functional processes, which are the same processes identified in the FP counting procedure: the Login and Borrowing processes. Then we have to identify data movements. Again, it is quite easy with the help of the sequence diagrams: the results are reported in Table 2. Table 2. Size and complexity of transactions Process
Login
Book Borrowing
Total
Message sent Login VerifyLogin SetCurrentUser Show GetSecretQuestion ForgottenPassword GetSecretAnswer SecretQuestion SecretAnswer GetPasswd GetAddress SendEmail Request IsOwned IsAvailable GetCurrantUser Show RegisterLoan Reserve (to System) Reserve (to BookCatalogue) IsOwned Require ReserveExternal
Data movement Entry Read Write Exit Read Entry Read Exit Entry Read Read Exit Entry Read Read Read Exit Write Entry Write
CFP
12
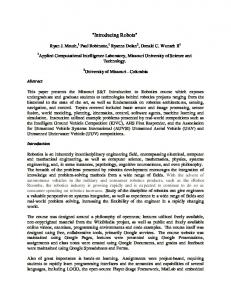
performed by the application. For instance, if we adopt (any flavor of) FP or CFP, it does not make any difference in terms of functional measure if the comparison of the user-supplied password with the one retrieved from RegisteredUsers implies just the comparison of two strings, or a complex cryptographic procedure is required. However, we can observe that the sequence diagrams in Figure 3 through Figure 6 provide much more information than is strictly required for FP or CFP counting. In fact, the combined fragments ‘alt’, ‘opt’, ‘loop’, etc. represent the business logic, and provide a quite straightforward indication of the complexity of the application (the more alternatives and/or iterations, the more complex the processing associated with the use case). In [30] Robiolo et al. observe that McCabe’s cyclomatic complexity measure [26] can be applied to the textual descriptions of use cases, in order to evaluate the complexity of the transactions they describe. McCabe’s complexity of a program is defined as the number of linearly independent paths in the flow graph of the program. It can be computed as v(G) = e-n+2, where G is the flow graph of the considered program, e is number of edges and n is the number of nodes. The combined fragments, which were introduced in UML 2.0 [28] and were extensively used in section 2, provide a precise description of the flow of control in use cases. We can exploit such information to derive the flow graph of every use case, and measure McCabe complexity accordingly. The flow graph derived from the sequence diagrams that describe the Login process is shown in Figure 7. It is easy to see that the flow graph can be derived from the sequence diagram by simply representing the ‘alt’ and ‘loop’ combined fragments and the alternatives (or ‘operands’ in UML jargon) they designate. The flow graph of the Login process has 11 edges and 8 nodes, thus v(G) = e-n+2 = 11-8+2 = 5. In fact, there are five linearly independent paths in the flow graph of the scenario. sd Login main alt (remember passwd?) loop (enabled?)
11
Entry Exit Write
alt (enabled?)
sd Login altern.
alt (correct answer?)
end of loop end of sd
23
We have shown that reasonably detailed models of use cases can effectively support the FSM of the application, using both FP and CFP. Now, a well-known problem with these functional measures is that they do not capture the amount and complexity of elaboration
Figure 7. Flow graph of the login process. The flow graph derived from the sequence diagrams that describe the Borrowing process is shown in Figure 8. In this case the flow graph accounts also for the ‘opt’ combined fragments that –like the ‘alt’ ones– represent alternatives in the control flow. The flow graph has 12 edges and 8 nodes, thus v(G) = e-n+2 = 12-8+2 = 6;
in fact, there are six linearly independent paths from the beginning of the scenario to its conclusion.
a) Using traditional measures (i.e., FP or CFP); b) Using the number of Paths (possibly in combination with the number of Transactions) as done by Robiolo et al. in [30]; c) Using the traditional measures (FP or CFP) in combination with the Paths.
sd Borrow main
alt (locally owned?)
UML-based measurement could also be extended to the measurement of UCP as defined in [19]; however this type of measures is not considered here. On the contrary, the possibility of deriving both classical functional size measures and complexity measures from a single model suggests that these two types of metrics could be used in combination for effort estimation. Next section discusses this issue.
sd Borrow altern.
alt (available?)
opt (ext. owned?) opt (reserve?)
opt (reserve?)
5. USING FUNCTIONAL SIZE AND PATHS IN EFFORT ESTIMATION
end of sd
Figure 8. Flow graph of the book borrowing process. It has been demonstrated that v(G) = d+1, where d is the number of predicate nodes that have out-degree 2. This means that counting the paths on the basis of the sequence diagrams is extremely simple: we have just to count the number of combined fragments and add one. Actually, we have to pay attention that ‘alt’ fragments have only two operands, as is usually the case. Now, we can characterize the system not only with respect to its functional size, but also with respect to the complexity of its use cases (or processes, in FSM terminology), as shown in Table 3. Table 3. Size and complexity of transactions Transaction Login BookBorrowing Total
Size in FP 4 4 8
Size in CFP 12 11 23
With the information that we can extract from UML models it is then possible to estimate effort in many different ways, including:
Num. of scenarios 2 2 4
Paths 5 6 11
Robiolo et al. showed in [30] that Paths have good effort prediction capabilities. In this section we check if a measure of functional complexity based on the number of Paths, in combination with a traditional measure of functional size can estimate development effort with good precision. In fact, we expect that adding a measure of complexity to the measure of functional size will substantially improve the precision of estimations, in the same way as in COCOMO adding indications about complexity (and other aspects of development) improves the estimation based on LOC. In order to verify this hypothesis we test the correlation of Effort with size (expressed in function points) and complexity (expressed as the average number of Paths per transaction). The latter measure of complexity was preferred to the total number of Paths since it is more representative of complexity in combination with size. For instance, a big application featuring 200 Paths can be actually simpler than a much smaller application featuring only 150 Paths. In order to remain as compatible as possible with consolidated practices, the number of transactions used to compute the average number of Paths per transaction is measured according to the definition of transaction by IFPUG rather than the one by Robiolo.
As we have seen, counting paths is very easy and substantially less expensive than measuring function points or COSMIC function points, especially if UML models of the use case scenarios are available. This means that a UML-based measurement process could derive the measure of Paths at practically no cost, as a side effect of the measurement of FPs or CFPs. Table 4. Experimental data Project
Application description
Implementation environment
Effort
UFP
PpT
P1 P2 P3 P4 P5 P6 P7 P8 P9 P10 P11 P12 P13
Controls trips using mobile phones Manages a centralized web purchase system Manages a hotel information system Tracks projects information Manages information about music bands Sells with an authorized card Sells cinema tickets using mobile phones Tracks files Manages an accounting process Manages university graduate alumni info. Controls clients’ debts Manages travel information Manages trips information
Java, Tomcat, J2ME Mobile Phone Emulator Java, Tomcat, Hibernate Java, Struts, Hibernate Jave, Hibernate, Tomcat Java, Apache, Tomcat MS (Visual Studio, Office Sharepoint Portal Server) MS Windows XP, Apache, Tomcat JSP, J2EE, Hibernate, Tomcat JSP, J2EE, Hibernate Power Builder, Javascript Power Builder Web application Web application
410 474 382 285 328 198 442 723 392 272 131 1042 348
144 266 173 122 89 75 57 210 311 155 117 130 93
2.45 1.28 3.16 3.27 2.43 3.89 5.00 2.94 1.77 1.56 1.06 4.54 2.00
The experimental data used are those collected in the experiments described in [30]. The data concern a set of small business projects, most of which were web applications. They were all new developments. The dataset is reported in Table 4, where UFP indicates the size in Unadjusted Function Points and PpT indicates the average number of Paths per Transaction of each project’s product. A brief description of the application is also reported, together with some indication about the implementation environment. Non parametric correlation tests do not support the hypothesis that UFP and PpT are correlated. We can therefore proceed to evaluate the correlation of Effort with unadjusted FP and paths per transaction using multivariate linear regression. In order to identify outliers, we used Cook’s distance [6]. We considered outliers the data points having Cook’s distance > 0.5: this criterion led to dropping projects P12 and P9 from the dataset. The examination of these two projects revealed that project P12 is the project that required the biggest in effort (over 50% greater than the second biggest one), while project P9 is the biggest in size. P9 has average complexity, but a small development effort: this seems to indicate that either the effort was not measured entirely/precisely, or it was developed in much more favorable conditions than the other projects. In practice, dropping P9 and P12 leaves us with a sample of projects that represent adequately the size range 50..270 UFP, the complexity range 1.06..5 PpT, and the effort range 130..730 PD. After eliminating outliers we get a model featuring an adjusted R2 = 0.9155 and significant at the 0.01 threshold (p-value < 10-5). The linear regression line has equation: Effort = 1.6224 UFP + 56.0141 PpT The residuals are normally distributed (i.e., Shapiro-Wilk W test [32] does not allow rejecting the normality hypothesis), as are all the considered data, i.e., Effort, UFP and PpT. the the the the
60 40 -20
0
20
50 -200
-100
0
80
150
We can therefore claim that –according to our dataset– development effort appears very well correlated to the size of requirements expressed in unadjusted function points and complexity of the required system functions, expressed as mean number of paths per transaction.
Figure 9. Effort vs. UFP and PpT: boxplot of errors (left) and relative error (right) The precision of the fitting is characterized by MMRE = 30.9% and pred(25) = 63.6%. The distributions of errors and relative errors are reported in Figure 9. The results reported above show that a measure of the application complexity and a measure of size –both measures being evaluated at the requirements level– can be used in combination for effort estimation purposes. Note that we are not advocating that a model
based uniquely on UFP and PpT should be used for effort estimation; rather, we are suggesting that UFP and PpT can be used as the main independent variables in effort estimation models, with the possibility of adding other parameters and correctors, as is made for instance in COCOMO [4][5]. Another interesting result is that on the basis of UML models it is possible to derive several different measures, such as unadjusted Function Points, COSMIC Function Points, the number of transactions as defined in [30], the number of scenarios, the number of paths, etc. In practice UML provides an extremely flexible base for measurements, and allows developers to derive different types of metrics that can be used with different types of historical data and can lead to the definition of different effort prediction models. It is well known that the functional size measures delivered via Function Point counting depend very much on the measurers [26]. Therefore, this could be a very relevant threat to the validity of the analysis reported here. However, it has been shown [8] that model-based measurement is very little dependent on the measurer, provided that models have been created in a measurement-oriented way [22], because these type of models leave little space to “interpretations” by measurers. Therefore, we expect that measures entirely based on models will contain very little noise due to the measurers.
6. RELATED WORK Attempts to account for data elaboration in FSM have been done. Feature points by Capers Jones [17] aim at capturing the algorithmic complexity of the elaboration. However, according to Capers Jones, “the feature point metric was created to deal with the psychological problem that members of the real-time and systems software world viewed function point metrics as being suitable only for management information systems” [16]. Therefore, feature points simply moved part of the ‘size’ from data to algorithms, leaving the measure substantially unaltered with respect to FPA. In fact, currently Capers Jones recommends “the use of the standard IFPUG methodology combined with a rating of ‘Project Complexity’ to properly scale effort”. 3D Function Points [33] consider three dimensions of the application to be measured: Data, Function, and Control. The Function measurement considers the complexity of algorithms; and the Control portion measures the number of major state transitions within the application. UCP were introduced by Karner in 1993 [19]. As already mentioned, the number of transactions is represented only via an ordinal scale, and the complexity of the elaboration is evaluated only as part of a weighting factor for estimation purposes [18]). Diev defined a heuristic application for UCP and rules in UML models in order to make the FP counting possible [8]. Anda et al. [2] reported that the application of UCP is affected by the different aspects of the structure of the use case model, which are: the use of generalizations among actors, the use of included and extended use cases, the level of detail in the use case descriptions. Also, Anda et al. presented an experience that involved the effort estimation of a specific system based on use case points [3]. Four companies were asked to develop an application fulfilling given requirements. Each company used a different development process. The actual efforts were very
different from the UCP-based effort estimates; this leads to the conclusion that the development process greatly affects costs, therefore using the historical productivity calculated in each development process seems essentially to achieve accurate estimates. Furthermore, Robiolo et al. [30] showed that for the data-set included in Section 5, it was possible –by using T and P according to the Historical Mean Productivity technique– to reduce the error of the estimated effort with respect to the estimates obtained with Unadjusted use case points only.
7. PRACTICAL CONSEQUENCES Functional size measures are used for measuring the size of functional user requirements. This measure is typically used to drive the estimation of the development effort. To this end, effort models require several inputs, in addition to the functional size: in particular, the complexity of the software to be developed is taken into account [4][5]. However, FSM methods currently fail to represent the amount and complexity of data elaboration required. COSMIC function points concentrate on the measure of the data movements, neglecting the data elaboration [7]. IFPUG function points account for data exchanged through the application borders and the data used to achieve the required functionality [10]. Now, the problem is that when dealing with effort estimation, the most popular methods require an evaluation of the complexity of the application. Currently such evaluation is of a purely qualitative nature. For instance, COCOMO II [5] provides a table that allows the user to evaluate complexity on an ordinal scale (from “very low” to “extra high”) according to five aspects (control operations, computational operations, device-dependent operations, data management operations, user interface management operations) that have to be evaluated in a qualitative and subjective way. For instance, the characterization of computational operations corresponding to the “Nominal” complexity is “Use of standard math and statistical routines. Basic matrix/vector operations.” It is quite clear that it would be greatly beneficial to replace such subjective and approximate evaluations of complexity with a real measure, based on objective and quantitative evaluations, since this would enable the construction of more objective and accurate models of effort. The work reported here provides some initial evidence that measuring Paths can lead to the definition of better estimation models. This can be done in several ways; for instance, organizations can collect their own data and then derive their own effort estimation models based on the analysis of historical data, or a new measure of complexity (the Paths or a similar one) could be included in the definition of new versions of effort estimation models like COCOMO or the commercial ones.
8. CONCLUSIONS In this paper we have explored the integration of the UML-based functional size measurement practices proposed in [22] with the measures of functional complexity derived from the descriptions of use cases proposed in [30]. We have shown that by exploiting the UML models, one can –quite easily– derive several different measures concerning the size and complexity of requirements. In
particular, sequence diagrams can support the computation of “Paths”, an adaptation of McCabe’s complexity measure to use cases. In order to show the potential advantages of the proposed approach, we have shown –using experimental data– that it is possible to build statistically significant models that relate development effort with functional size (expressed in Function Points) and functional complexity (expressed in Paths per Transaction). Even though the number of projects of the sample is small, they give initial evidence that the measure of Paths seems suitable for capturing the elusive notion of complexity. The proposed approach has the potential to greatly improve the measurement and effort estimation practices of organizations that are already using UML. In fact, for such organizations the extra modeling effort required to make their models suitable for measurement is fairly small; the effort required to perform UMLbased measures is also quite small. For the organizations that are using UML only for design, the possibility of getting models supporting measurement and, consequently, effort estimation could be a reason for extending the use of UML to requirements modeling [20][21]. Organizations not using UML could use the proposed techniques anyway, but at a greater cost and probably achieving less precise results. The proposed approach has also some limitations. Since we evaluate the complexity of use cases at a fairly high level, we shall not be able to represent complexities that become apparent only when low level details are described. For instance, the usage of cryptographic techniques in the password validation part of the login process would certainly increase the actual complexity of the system, but could be measured only if the details of the cryptographic algorithm are modeled in the sequence diagrams. On the one hand, we expect that if cryptography is required, it is mentioned in the requirements, hence it is suitably modeled; on the other hand the level of detail could easily remain quite coarse at the requirements specification level. Future work includes: further experimentation of the approach, possibly addressing more metrics (like UCP); exploring the possibility of partly automating the UML-based measurement (for instance, measuring Paths on the basis of XMI representations of sequence diagram should be quite easy); defining a complete process that includes UML-based requirements modeling, functional size and complexity measurement and effort estimation.
9. ACKNOWLEDGMENTS The research presented in this paper has been partially funded by the IST project (http://www.qualipso.eu/), sponsored by the EU in the 6th FP (IST-034763); and the project “Elementi metodologici per la specifica, la misura e lo sviluppo di sistemi software basati su modelli” funded by the Università degli Studi dell’Insubria and Research Fund of School of Engineering of Austral University.
10. REFERENCES [1] Albrecht, A.J. 1979. Measuring Application Development Productivity. Joint SHARE/GUIDE/IBM Application Development Symp.
[2] Anda, B.C.D., Benestad, H.C. and Hove S.E. 2005. A multiple-Case study of effort estimation based on use case point. Fourth International Symposium on Empirical Software Engineering, IEEE Computer Society, 407–416.
[18] Karner, G. 1993. Resource Estimation for Objectory Projects. Objectory Systems.
[3] Anda, B. C. D., Dreiem, H. Sjøberg D. I. K. and Jørgensen M. 2001. Estimating Software Development Effort Based on Use Cases - Experiences from Industry. In 4th International Conference on the Unified Modeling Language (UML2001), (Toronto, Canada, SpringerVerlag) Lecture Notes in Computer Science, 487-502.
[20] Lavazza, L. and del Bianco, V. 2004. A UML-based Approach for Representing Problem Frames. In proc. of 1st International Workshop on Advances and Applications of Problem Frames (May 24, Edinburgh). IWAAPF 2004.
[4] Boehm, B. W. 1981. Software Engineering Economics. Prentice-Hall. [5] Boehm, B.W., Horowitz, E., Madachy, R., Reifer, D., Clark, B.K., Steece, B., Winsor Brown, A., Chulani S. and Abts, C. 2000. Software Cost Estimation with Cocomo II. Prentice Hall. [6] Cook, R. D. and Weisberg, S. 1982. Residuals and Influence in Regression. Chapman and Hall. [7] COSMIC – Common Software Measurement International Consortium, 2007. The COSMIC Functional Size Measurement Method - version 3.0 Measurement Manual (The COSMIC Implementation Guide for ISO/IEC 19761: 2003). [8] del Bianco, V., Gentile, C., and Lavazza, L. 2008. An Evaluation of Function Point Counting Based on Measurement-Oriented Models”, In Proc. of Evaluation and Assessment in Software Engineering (June 26-27, Bari) EASE 2008. [9] Diev, S. 2006. Use cases modeling and software estimation: applying use case points. CAN Software Engineering Notes, Vol. 31, N. 6, 1-4. [10] International Function Point Users Group. 2004. Function Point Counting Practices Manual - Release 4.2. [11] ISO/IEC 20968: 2002, Software engineering Mk II Function Point Analysis. Counting Practices Manual, International Standardization Organization, ISO, Genève. [12] ISO/IEC 20926: 2003, Software engineering – IFPUG 4.1 Unadjusted functional size measurement method – Counting Practices Manual, International Organization for Standardization, Geneva.
[19] Karner, G. 1993. Metrics for Objectory. Diploma thesis, University of Linköping.
[21] Lavazza, L. and del Bianco, V. 2006. Combining Problem Frames and UML in the Description of Software Requirements”. Fundamental Approaches to Software Engineering (March 25-April 2, Wien). FASE 2006. [22] Lavazza, L., del Bianco, V. and Garavaglia, C. 2008. Model-based Functional Size Measurement. In Proceedings of 2nd International Symposium on Empirical Software Engineering and Measurement (October 9-10, Kaiserslautern, Germany). ESEM 2008. [23] Lavazza, L. and Garavaglia, C. 2008. Using Function Point in the Estimation of Real-Time Software: an Experience. Software Measurement European Forum (Milano). SMEF 2008. [24] Lavazza, L. and Garavaglia, C. 2009. Using Function Points to Measure and Estimate Real-Time and Embedded Software: Experiences and Guidelines. In Proceedings of 3rd Int. Symp. on Empirical SW Engineering and Measurement (October 15-16, Lake Buena Vista, Florida). ESEM 2009. [25] Lavazza, L. and del Bianco, V. 2009. A Case Study in COSMIC Functional Size Measurement: the Rice Cooker Revisited, IWSM/Mensura 2009 ( 4-6 November, Amsterdam). [26] Low, G. C., and Jeffery, D. R, 1990. Function points in the estimation and evaluation of the software process. IEEE Transactions on Software Engineering, Vol.16 No.1. [27] McCabe, T.J. 2005. A complexity measure. IEEE Transactions on Software Engineering, vol.2, n.4. [28] Object Management Group, 2005. Unified Modeling Language: Superstructure v. 2.0, formal/05-07-04.
[13] ISO/IEC19761:2003, Software Engineering -- COSMICFFP – A Functional Size Measurement Method, ISO.
[29] Robiolo, G. 2008. A Simple Approach that Improves Early Effort Estimation Based on Use Cases. In Proceedings of the Third International Doctoral Symposium on Empirical Software Engineering (Kaiserslautern, Germany). IDoESE.
[14] ISO/IEC 24750: 2005, Software engineering – NESMA functional size measurement method version 2.1 – Definitions and counting guidelines for the application of Function Points Analysis, International Organiseation for Standardization -- ISO, Geneve.
[30] Robiolo, G., Badano, C., Orosco, R. 2009. Transactions and Paths: two use case based metrics which improve the early effort estimation., In Proceedings of 3rd Int. Symp. on Empirical SW Engineering and Measurement (October S. 15-16, , Lake Buena Vista, Florida). ESEM 2009.
[15] ISO/IEC 29881:2008(E), FiSMA 1.1 functional size measurement method, First edition 2008-05-15 International Standardization Organization, ISO, Genève.
[31] Robiolo, G. and Orosco, R. 2008. Employing use cases to early estimate effort with simpler metrics. Innovations Syst. Softw. Eng, vol.4.
[16] Jones, C. 2006. Strengths and Weaknesses of Software Metrics. Version 5, Software Productivity Research.
[32] Shapiro, S. S. and Wilk, M. B. 1965. An analysis of variance test for normality (complete samples). Biometrika 52 (3-4).
[17] Jones, C. 1986. A Short History of Function Points and Feature Points. Software Productivity Research, Inc., Burlington, Mass.
[33] Whitmire, A., 1995. An Introduction to 3D Function Points, Software Development, Vol. 3 No. 4.