Biomonitoring of Exposure to Air Pollutants: Contribution of Different Air Pollution Sources Towards Oxidative Stress Massimiliano Mascelloni*1, Barbara Macias-Hernandez1, Silvia Fustinoni2, Elisa Polledri2, Laura Campo2, Mu-Rong Chao3, Chiung-Wen Hu4, Marcus S. Cooke5, Roy M. Harrison1, Juana Maria Delgado-Saborit1 of Geography, Earth and Environmental Sciences, University of Birmingham, B15 2TT, United Kingdom 2Department of Clinical and Community Sciences, Universitá degli studi di Milano, Italy 3Department of Occupational Health and Safety, Chung Shan Medical University, Taiwan 4Department of Public Health, Chung Shan Medical University, Taiwan 5 Department of Environmental and Occupational Health, Florida International University, Florida, USA *Now at Department of Environmental Health Sciences, University of Massachusetts, Amherst, MA 01003, USA 1School
Introduction Exposure to air pollutants is a well known issue both indoors and outdoors. People spend a large portion of the day in indoor microenvironments, and although the exposure levels found indoors are often lower than outdoors, indoor exposure makes a relevant contribution towards the total exposure. The goal of this study (FIXAT) was to assess the exposure to VOCs and the early effects in general population. Different subgroups were compared to identify sources and tasks related to different levels of exposure arising from building materials and consumer products in new or recently refurbished buildings.
Methods Thermal desorption GCMS for VOCs in personal exposure samples
MATCH study (n= 41)
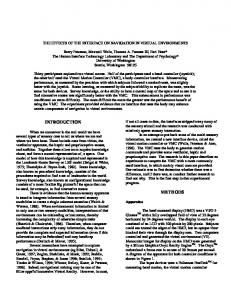
Relationship between urinary BTEX, ETS and 8-oxo-dG • The single VOCs showed statistically significant correlation with the DNA damage biomarker 8-oxo-dG for ethylbenzene (p=0.045) and xylenes (p=0.019 and p=0.035). • The sum of urinary BTEX + naphthalene showed statistically significant correlation with urinary cotinine (p1µg/L (p=0.004), suggesting a major role of ETS as a source of BTEX even at extremely low concentrations.
Control Not living in buildings built or refurbished in less than 1 year
(n= 15) Exposure at home/workplace Living in buildings built or refurbished in less than 1 year
Personal sampler: one VOC sorbent tube and quartz filter connected to a pump and one Microaethalometer
Unmetabolized BTEX (benzene, toluene, ethylbenzene, o- m- pxylene) and naphthalene in urine using Headspace SPME-GC-MS
(n= 15) Occupational exposure Working in traffic or operating petrol engine powered tools
Midstream urine sample
8-oxo-DG in urine using LC-MS, cotinine using LCMS/MS
(n= 14)
FIXAT results were compared with previous studies (MATCH1) that included environmental tobacco smoke (ETS) and high levels of exposure.
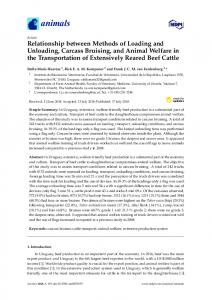
Threshold of effect • ETS contribution towards the concentration of total urinary VOCs is showed by the strong relationship between urinary cotinine and urinary BTEX in both ETS exposed (p=0.010) and non-ETS exposed subjects (p=0.004). • The relationship is not conserved between urinary BTEX and 8-oxo-dG (p=0.826) and urinary cotinine and 8-oxo-dG (p=0.840) for non-ETS exposed subjects. • In ETS exposed subjects urinary cotinine and total urinary VOCs showed statistically significant correlation with 8-oxo-dG (p=0.007 and p=0.036 respectively).
For each subject, after a 24h personal exposure sampling, a first morning urine sample was collected and analysed for unmetabolized BTEX (benzene, toluene, ethylbenzene, o- m- p-xylene) and naphthalene to assess VOC exposure, and 8-oxo-dG (8-oxo-2’deoxyguanosine) to assess DNA damage.
• The observed differences in the correlation between urinary VOCs, cotinine and 8-oxo-dG suggested a “threshold of effect”, which was identified as 550ng/L of total urinary VOCs. The value was identified with the intercept of the trend line for the cotinine/total VOCs.
The data was compared between the main groups and between subgroups created ad-hoc using different variables (e.g. smoking habits, ETS exposure). Correlation analyses were performed between the different biomarkers, and subgroups were compared using different statistical approaches.
• Under the threshold of effect, no relationship is observed between 8-oxodG and urinary BTEX, suggesting that the measured oxidative stress damage has other sources, while past the threshold, VOC exposure (from ETS and other sources) is a significant contributor of oxidative stress.
References: Saborit, J. M. D. et al. Measurement of personal exposure to volatile organic compounds and particle associated PAH in three UK regions. Environ. Sci. Technol. 43, 4582–4588 (2009).
Acknowledgements The authors would like to thank CEFIC and Wellcome Trust fund for financial support, authors would also like to thank all the volunteers that participated in the study.
Conclusions • No significant difference was observed between subjects living or working in a new or recently refurbished building and the control groups for both urinary BTEX concentration and oxidative stress. • One of the main sources of VOC exposure was identified as cigarette smoke, even under the threshold of ETS exposure of 1µg/L of urinary cotinine. • Large majority of the time was spent indoors by the subjects, suggesting that ETS could have been carried indoors by either air diffusion or from offgassing of the pollutants from cloths and surfaces that came in contact with cigarette smoke (third-hand smoke). • ETS represents one of the main confounding factors for BTEX measurement, even under the typically used threshold for ETS exposure of 1µg/L of urinary cotinine. • While this biomonitoring approach has been proven to be effective in high exposure populations and occupational exposures, it is not possible to observe any relationship with oxidative stress at the levels of exposure of this study. • Threshold of effect is a good example of a “limit of detection” of this approach, together with suggesting that at these low levels of exposure, the sources of oxidative stress are to be identified elsewhere. Non-ETS exposed
ETS exposed + Smokers
Total urinary VOCs >550ng/L
Figure 1: scatter plot representing the full data set for MATCH and FIXAT project showing the relationship between the sum of urinary BTEX + naphthalene and cotinine. The vertical line represents the threshold of discrimination between ETS exposed and non ETS exposed subjects (urinary cotinine=1µg/L).
Figure 2: Scatter plot representing the full data set for MATCH and FIXAT project showing the relationship between the sum of urinary BTEX + naphthalene and 8oxo-dG. The vertical reference line identifies the intercept of the regression line of Figure 1, representing the threshold of effect.
2.74
E-mail:
[email protected]