ArcView 9 Manual. 2. Introduction to ArcGIS. ArcGIS is a scalable system of GIS
software produced by Environmental Systems Research. Institute (ESRI).
Using
ArcView 9 An introduction
Amy Hillier Cartographic Modeling Laboratory University of Pennsylvania
Cartographic Modeling Laboratory
ArcView 9 Manual
Introduction
Introduction to ArcGIS…………………………………….…………………..………. 2 Introduction to ArcCatalog…………………………………….………….…………. 3 Introduction to ArcMap…………………………………….….………….……………. 6 Managing & Saving Files…………………………………….…..……………………. 10
Spatial Data
Shapefiles & Vector Data……………………………………….………………….. .. 13 Adding XY Data……………………………………….………………………….……..... 15 GRIDS and Raster Data………………………………………….………..………….. 16 Working with Projections……………………………………….…………………….. 17 Georectifying Images……………………………………………..……………………. 21
Making Maps
Displaying Point Data……………………………………………….…………………… 23 Displaying Area Data………………………………………………….……………..... 25 Labeling Features………………………………………………………….…….……… .. 28 Designing Map Layouts………………………………………………..…………….... 31 Using Map Templates…………………………………………………..…………….. .. 35 Making Inset Layouts……………………………………………………..………….. .. 37 Exporting Maps…………………………………………………………….…………….. .. 38
Modifying Attributes
Working with Tables……………………………………………….…………….………. 40 Converting Excel files to .DBF………………………………………………………. 42 Calculating Values…………………………………………………….………….………. 44 Calculating Area, Perimeter, & Length…………………….…….……………..47 Creating XY Coordinates……………………………………….….…….……………. 49 Joining Tables……………………………………………………………….………..……..51 Adding Hyperlinks……………………………………………………..….………………. 53
Creating and Aggregating Point Layers
Geocoding Addresses…………………………………….……..….………………….. 55 Spatial Joins………………………………………………………………….………………. 59
Querying & Measuring
Querying by Attribute……………………………………………………….………….. 61 Querying by Location…………………………………………….……….…………….. 62 Measuring………………………………………………………………………….………….. 63 Creating Buffers……………………………………………………..….……….……….. 64
Creating New Geographic Files Editing Shapefiles…………………………………………..…………………..………… 65 Transforming map layers…………………………………..………….….…..…….. 67
Digitizing
Creating Shapefiles…………………………………………..………………………..… 70
Cartographic Modeling Laboratory
ArcView 9 Manual
Introduction to ArcGIS ArcGIS is a scalable system of GIS software produced by Environmental Systems Research Institute (ESRI). This system contains three different products: ArcView, ArcEditor, and ArcInfo. ArcView ArcView is the desktop version meant for a general (non-professional) audience. It is the most popular desktop GIS software program, but it is not the only one. With the jump from ArcView 3.2 to ArcView 8.x, ESRI brought ArcView into its ArcMap system so that it uses the same structure as its more sophisticated GIS products. ArcView 3.x has similar functionality to ArcView 8, but the products work in very different ways. ArcView 9 adds some functionality to ArcView 8, but the two versions work in a very similar way. ArcEditor ArcEditor includes all the functionality of ArcView, adding the ability to edit features in a multiuser geodatabase so that multiuser editing and versioning are possible. ArcEditor also adds the ability to edit topologically integrated features in a geodatabase. ArcInfo ArcInfo is ESRI’s professional GIS software. It includes all of the functionality in ArcView and ArcEditor, adding some advanced geoprocessing and data conversion capabilities. ArcSDE is ESRI’s database service, allowing you to manage geographic information in several different types of databases (IBM DB2, Informix, Microsoft SQL Server, and Oracle) while ArcIMS adds internet map services.
Introduction to ArcView 9 ArcView 9 includes two separate applications: ArcCatalog, and ArcMap. Although they are designed to work together, they run under separate executable files (.exe) so they each have their own icons.
ArcCatalog works sort of like Windows Explorer. It is a place to browse and manage your data. You can also create and edit metadata in ArcCatalog. ArcMap is where you actually create maps. This is where you will spend most of your time. ArcToolbox was a separate application in ArcView 8. For ArcView 9, it has been integrated directly into ArcCatalog and ArcMap. 2
Cartographic Modeling Laboratory
ArcView 9 Manual
Introduction to ArcCatalog ArcCatalog is designed to help you manage your spatial and non-spatial data.Using ArcCatalog may seem awkward, particularly to people who are familiar with ArcView 3.x. Using ArcCatalog will help you to develop good GIS habits, so it’s worth the effort. Connecting to Folder When you launch ArcCatalog (from the Start menu, go to ArcGIS, then ArcCatalog, or add a shortcut to your desktop), a list of all the folders and sub-folders on your computer will be displayed on the left in the catalog tree. “Connect to folder” allows you to make a direct connection to the place on your computer where your GIS data are stored. This is not necessary but will save time. You will use these same shortcuts in ArcMap (and you can connect to folder from ArcMap, as well). From the file menu, go to “Connect Folder…” or click on the “Connect To Folder” button (yellow arrow against a globe). Navigate until you find the folder with your data and click “OK.” Your folder should now be listed under “Catalog” next to a icon. Seeing File Types When the contents tab is active in the window on the right (catalog display), ArcView will indicate the type of file using icons. Shapefiles, the format for geographic files in ArcView, are made up of three or more separate files. If you viewed them outside of ArcCatalog (in Windows Explorer or through My Computer), you would see all of the files listed with extensions such as .dbf, .shp, .shx (see example at right). In ArcCatalog these various files will appear as a single shapefile. ArcCatalog also indicates what kind of shapefile: point, line, polygon, or geocoding service. In the example on the left, the file “hospitals.shp” is made up of points, “nis_neighborhoods.shp” is made up of polygons, and “phila_rails.shp” is made up of lines. “phila_streets.mxs” is a geocoding service. This means that it has been indexed so that you can use it to geocode addresses. By copying and pasting shapefiles using ArcCatalog, you insure that you will keep all of the components of a shapefile together. Tables that contain no spatial information can also be displayed in ArcCatalog. The icon changes depending upon the type of table. Images can also be displayed.
3
Cartographic Modeling Laboratory
ArcView 9 Manual
Creating Thumbnails For some files, including maps and layers created in ArcMap, ArcCatalog will display a thumbnail image of your data when the “contents” tab is active. To create thumbnails for shapefiles and images (you cannot create thumbnails for tables), click the “preview” tab, highlight the shapefile name, and click on the “Create Thumbnail” button. Click on the “contents” tab in order to view thumbnails. Previewing Files By making the “preview” tab active, you can look more carefully at files. When the preview drop-down menu at the bottom of the window on the right is set to “geography,” you can see what your geographic data looks like mapped. You need to view your data in ArcMap in order to make changes to the way it displays, but this preview in ArcCatalog allows you to look quickly at your data. You can also view images here (ArcCatalog may ask you if you want to build pyramids in order to display these more quickly, which is probably a good idea). Switch the preview drop-down to “table” in order to view the attributes associated with your geographic features. Click on the “options” button to add a new field or export the table. Right clicking on a column heading allows you to access a number of other functions such as sort, freeze/unfreeze column, delete field, and statistics (the statistics option is only available for numeric fields). You can also access these functions in ArcMap. Checking Properties Double click on the file name to bring up the shapefile or table properties (or by highlighting the file name and choosing “properties” from the File menu). With the fields tab active, you can identify the data type for each of the columns in your table. When you click on a column name, the length of the field will appear below. The column called “shape” will appear for your shapefiles. When you click on the field name “shape,” several new field properties appear at the bottom. From the “spatial reference” field, you can see what datum and projection have been defined (if any). You can change or add to this information by clicking on the “…” From the index tab, you can create attribute or spatial indexes in order to increase the speed of searching, querying, and drawing data.
4
Cartographic Modeling Laboratory
ArcView 9 Manual
Updating Metadata ArcCatalog also allows you to update and store metadata. Click on the “metadata” tab to access this functionality. Sometimes you will receive data that contains metadata, but generally this is something you will have to add after acquiring or building a dataset. ArcCatalog offers several different stylesheets that define the types of information that can be included in the metadata documentation. The default is ESRI’s stylesheet, but you can change this from the stylesheet dropdown menu. The buttons to the right of this dropdown menu allow you to (in order) edit metadata, view metadata properties, create/ update metadata, import, and export metadata. Click on the “edit metadata” button in order to add or edit your metadata. You will probably not be able to fill in all of the requested (“required”) fields, but fill in as much as you can. Most important are a description of the data (including the date, spatial extent, and geographic level), limits on access (who can use the data?), contact information (when and from whom did you acquire the data?), data values (is there a data dictionary that explains the meaning of values?), and data quality (are there known problems?). Other ArcCatalog Functions These are the basic functions in ArcCatalog—organizing and previewing data and working with metadata. ArcCatalog also has extensive search capabilities, making it possible to locate files based on name, location on your computer, geographic location, and date. You can geocode addresses and work with maps and layers, although these are functions that can also be done through ArcMap.
5
Cartographic Modeling Laboratory
ArcView 9 Manual
Introduction to ArcMap ArcMap is where you create maps and access most of the ArcGIS functionality. You can access some of the same functions through ArcCatalog and will need to decide for yourself which approach you find works best for you. Starting ArcMap You can launch ArcMap in several ways. If you are in ArcCatalog, click on the “Launch ArcMap” button. Alternatively, go to the start menu, ArcGIS, and ArcMap or double-click on a desktop icon (if you created one). When ArcMap opens, you will be asked if you want to open an empty map, use a template, or open an existing map. You can prevent this dialog from displaying again by putting a check mark in the “do not show this dialog again” box. Customizing the Interface ArcMap is made up of many different windows and (dock-able) toolbars that you can resize and move around, so don’t be surprised if ArcMap looks slightly different each time you open it. The window that lists your map layers is the table of contents; the window that shows your map is the map display. You can close the table of contents by clicking on the “x” and resize it by holding your cursor over the right edge until your cursor changes to a two-headed arrow. Left-click and drag the edge to resize this window. To move one of your toolbars, left click on the end (top or left), hold down, and move to a new location. Adding Tools and Toolbars To add or remove a toolbar, left click anywhere outside of the table of contents, map display, or toolbar (somewhere gray) or, from the view menu, go to “toolbars.” Anything with a check mark next to it will be displayed. You can also add new buttons to your toolbars from the “customize” option. One especially helpful button allows you to zoom continuously. Choose the commands tab, scroll down to “pan/zoom,” then right click on the “Continuous Pan and Zoom” button on the right and drag it to your tools toolbar (the toolbar with the outline of a hand and an image of a globe in the middle) and release.
6
Cartographic Modeling Laboratory
ArcView 9 Manual
Working with the Table of Contents The table of contents has two tabs (at the bottom): display and source. When the display tab is active, the table of contents will only list data that can be drawn as a map layer. When the source tab is active, the table of contents will also show tables along with the path indicating where the data are stored. Turn on and off a layer by checking and unchecking the box next to it. Layers are drawn in the map display in the order in which they are shown in the table of contents. Map layers listed at the top will draw on top. To move a layer, left click and hold the mouse button down, then move the layer. Navigating a Map There are several tools available for zooming in and out of your map. The continuous zoom tool gives you the greatest amount of control. Click on it, then left click on your map, hold down the mouse button, and move your mouse away from you to zoom in and toward you to zoom out. If you right click and hold down, this becomes a tool for panning (moving map around without changing the extent). This is not a standard tool, so you will need to add it. See instructions on previous page for customizing toolbar. Using the other (non-continuous) zoom tools, you can click on your map to zoom in or out at a fixed amount or to draw a box around the area that you want to see in more or less detail. The new map will be drawn so that the area you drew the box around is in the middle of the map display. The fixed zoom in/fixed zoom out tools work like the zoom tools when you click them rather than draw a box. Each time you click, you will zoom in or out a fixed amount. The pan tool works like the continuous zoom tool when you right click on it. Think of the pan tool as a sticky hand. Left click on your map display, hold the mouse button down, and shift your map. Your extent (amount zoomed in or out) stays the same while your map moves. The full extent button will zoom in or out so that all of your active (checked) map layers can be viewed. You can also zoom in to a single layer by right clicking on the layer in the table of contents and choosing “zoom to layer.” The previous extent buttons allow you to return to the extent you had before using one of the zoom tools. The next extent button allows you to jump forward an extent (after you have used the previous extent button). Identifying Attributes of Features The points, lines, and polygons that make up map layers are all map features that have attributes stored in a table. You can access this information in several different ways. Using the identify tool click on a map feature in the map display. An “identify results” box will display all of the information known about that feature. Notice the layers dropdown menu. The default in ArcMap is to display information only about the top-most layer.
7
Cartographic Modeling Laboratory
ArcView 9 Manual
Showing Map Tips Map tips are small text boxes that appear when you hold the cursor over a map feature. You can determine which value in your attribute table is used in the map tips. Double click on your shapefile name in the table of contents and, from the Layer Properties dialogue, make the Display tab active. Put a check mark in the “Display Map Tips” box. To change the primary data field, make the Fields tab active and choose a field from the “primary display field” dropdown menu. Selecting Features You can also use the select features tool to identify attributes, either by clicking on a particular map feature or by drawing a box around the feature(s) of interest. The selected features should become highlighted with a blue outline. Right click on the map layer that contains the feature(s) of interest and go to “open attribute table.” This table includes all the attributes of all the features in that layer. In order to view just the selected feature(s), click on the “selected” button at the bottom of the table. You can also highlight a feature on the map by clicking on a row in the table. You can change the selection color from “options…” in the selection menu. It is also possible to use different colors for each layer. Double click on a map layer, or right click and go to “properties.” Choose the selection tab and then select the last radio button, “Show selected features with this color.” This will only change the selection color for this map layer. Changing Map Symbols ArcMap has many options for changing the way your data are displayed. Some of the simplest options involve the choice of color, fill pattern, and shape (for point data). To make changes, click on the map symbol in the table of contents. The symbol selector window that opens will look different depending upon the type of layer: point, line, or polygon. For points, you can choose a different marker from the default (which is a circle with a black outline). When you choose a new marker, the default size jumps from 4 point (quite small) to 18 point (quite large). You can find many more symbols by clicking on “more symbols.” Remove the check mark next to one of the categories of symbols if you find that it is not helpful (to reduce the amount of scrolling necessary to find appropriate symbols).
8
Cartographic Modeling Laboratory
ArcView 9 Manual
You can change the color, size, and angle using the options on the right of the window. The “reset” button will undo any changes you have made to the symbol since opening the symbol selector window. For lines, the options are similar. For polygons, you have choices about the fill pattern, fill color, and outline color. The properties button will give you additional options (and often too many options) but may be helpful in fine-tuning the crosshatch and ordered stipple patterns.
9
Cartographic Modeling Laboratory
ArcView 9 Manual
Managing & Saving Files ArcGIS can integrate many different types of data into maps. The most common forms are tabular data and geographic data, but you may also use various images. Through ArcMap, you can create additional types of files, including map documents (.mxd) and map layers (.lyr). Naming and storing these files in a consistent manner will make your work with ArcGIS much easier. Tabular data Tabular data includes things like commadelimited or fixed width text files, Excel worksheets, ACCESS files, and dbase files. This is where you store attribute data, such as census data. ArcMap can only work with comma-delimited text (.txt) and dbase (.dbf) files, so frequently you will need to convert your tables to one of these formats before adding it to ArcMap. Geographic data Geographic data are unique to GIS programs because they allow you to create maps by locating them in real world coordinates. Shapefiles are the standard format for geographic data in ArcView, but you can also use tables that contain X and Y coordinates (for point data) or convert geographic files in other formats into shapefiles. Shapefiles are made up of three or more separate files that all need to be located in the same directory in order for ArcMap to recognize them as parts of a shapefile. (Note: shapefiles are used for vector GIS data. Raster GIS data are stored in files that are more similar to images). Images ArcGIS allows you to import and export many different types of images. The images you import may be scanned paper maps, aerial photos, or other pictures or photos that you “hot link” to your map features. ArcMap can import a wide range of file types. You can also export finished maps in ArcMap in a number of formats: EMP, BMP, EPS, TIFF, PDF, JPEG, CGM, JPEG, PCX, and PNG. Map Documents If you save all of your work in ArcMap (by going to the file menu, “save” or “save as”), you will create a map document (.mxd). This file will save all of the work you have done, including the data you have added and the changes you have made to layer properties, symbology, and the layout. This .mxd file does NOT save all of the data you included in your map. Instead, it includes information about the location of those files on your computer (or network, or Internet) and the formatting changes you made.
10
Cartographic Modeling Laboratory
ArcView 9 Manual
This means that you cannot move the data files you’ve included in a map document without running into problems. It also means that map documents are difficult to transfer from one computer to another. If you do move one of the files used in your map document, that layer will be shown with a ! next to it and will not draw when you open your map document. If you click on the grayed out check mark beside the layer name, ArcMap will bring up a dialog asking where you moved the file. Navigating to the file in its new location and clicking “add” will solve the problem, but this can be time-consuming (and frustrating) and is best avoided.
Using Relative Paths One way to minimize problems when you move files that are part of an ArcMap document is to use relative paths. If you specify that you want to use relative paths, ArcView will be able to find the pieces of your ArcMap document if you move it or its components. From the file menu, go to “map properties” and click the button “Data Source Options.” Choose the radio button “Store relative path names.” Map Layers In addition to saving the entire workspace with a map document, you can save an individual map layer (.lyr). This file will store all the formatting changes you have made to the layer. This is particularly helpful if you want to use the same layer, with the same symbology, in another map document. As with the .mxd file, the .lyr file only includes information about the formatting and the path to the original data (generally a shapefile). Moving your original data, or moving the .lyr file to another computer, will create problems. Naming Files Giving your files clear and consistent names will make working with ArcMap much easier. You need to develop your own naming convention that makes sense to you. ArcGIS can work with file names that are more than 8 characters, but really long names can be difficult to view. ArcGIS can also work with files that have spaces in their name, but this will create problems if you work with the Spatial Analyst extension. Your file names should help you distinguish the content and version of your data.
11
Cartographic Modeling Laboratory
ArcView 9 Manual
Storing Files The most important thing in storing files for ArcMap is to think through a system BEFORE you start, so you can avoid moving files and disabling your map documents and layers. Consider creating a new directory for each new mapping project. Keep all map documents in that directory. Create subdirectories for tabular data that are not associated with geographic files, geographic data, and images. Keep map layers in the subdirectory for geographic data.
Geodatabases With ArcGIS, ESRI has introduced a new geographic data model called a geodatabase. Geodatabases allow for topologically integrated features, similar to coverages used in ArcInfo, and define rules for the behavior of different types of objects. This provides a much more sophisticated approach to storing and managing data than using directories and subdirectories and works particularly well for sharing data.
12
Cartographic Modeling Laboratory
ArcView 9 Manual
Shapefiles & Vector Data Vector GIS Vector is the most common model for GIS data used in the social sciences. It uses points, lines, and polygons to represent map features. Vector GIS is excellent for representing discrete objects, such as parcels, streets, and administrative boundaries. Vector GIS is not as good for representing things that vary continuously over space, such as temperature and elevation. Shapefiles ESRI created the shapefile format in order to represent vector GIS data in a simpler format than their coverage format used in ArcInfo. As with other formats of geographic data, shapefiles link information about the location and shape of the map features to their attributes. Shapefiles are made up of three or more files that need to be stored in the same directory in order for ArcView to recognize them as shapefiles. Other GIS programs will allow you to use shapefiles, but geographic files from other GIS programs must be converted to shapefiles before ArcView can read them. .shp - the file that stores the feature geometry (point, line, or polygon) .shx - the file that stores the index of the feature geometry .dbf - the dBASE file that stores the attribute information of features. When a shapefile is added as a theme to a view, this file is displayed as a feature table. .sbn and .sbx - the files that store the spatial index of the features. These two files may not exist until you perform theme on theme selection, spatial join, or create an index on a theme's shape field. .pjr – the file that stores information about the projection. This will only exist for shapefiles with defined projections.
The shapefile stores information about the shape of the map features, describing them in the “shape” field of the attribute table as point, line, or polygon. It also stores information about the real world location of each vertex that makes up the map features. Using this information, ArcView can calculate area and perimeter for polygon features.
13
Cartographic Modeling Laboratory
ArcView 9 Manual
Adding Shapefiles to ArcMap You can add shapefiles to ArcMap in several ways. From ArcCatalog, you can click and drag shapefiles right into ArcMap (click on the file name in ArcCatalog and hold down, dragging to either the table of contents or map window and letting go). You can also add shapefiles from ArcMap using the “add data” button or from file menu go to “add data.” Topology On of the biggest complaints about the shapefile format is that it does not contain information about topology. Topologic formats (like coverages used in ArcInfo) contain detailed information about the relationships among features in the same map layer. This allows for a variety of operations to ensure the integrity of lines and polygons and to carefully edit and create new geographic features. In creating the shapefile format, ESRI intentionally created something that is simpler than existing topologic formats for desktop (rather than professional) GIS users.
14
Cartographic Modeling Laboratory
ArcView 9 Manual
Adding XY Data Sometimes you will need to map a table that just has X and Y coordinates identifying specific locations but no shapefile associated with it. This might occur because a GPS (global positioning system) unit was used to collect the data or because that is the way a private vendor has chosen to distribute the data. A table with X and Y coordinates is much easier to distribute than a shapefile, because it is smaller, does not involve multiple files, and is not ArcView-specific.
In order to map the data in ArcView, the X and Y values will need to be included as separate columns in a dBASE or delimited text file. You can add the table to ArcMap just as you would a shapefile (with the “add data” button), but you do not need to add it to ArcMap in order to map it. From the tools menu, choose “Add XY Data” and browse to the table with the XY data. ArcMap will probably find the appropriate fields in your table; otherwise, use the dropdown menus to indicate the fields containing the X and Y values and click “ok.” As with shapefiles, tables with XY data that you acquire may be projected. If XY coordinates are in the form shown in the table above, they are unprojected.
15
Cartographic Modeling Laboratory
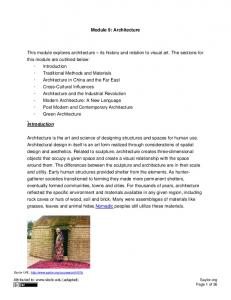
Raster Data
ArcView 9 Manual
cells in raster layer
Raster GIS Raster data use grids made up of regular cells to represent spatially continuous data. Each cell is assigned real world coordinates and an attribute value (such as precipitation level or elevation). The user defines the cell size, allowing for very fine or course raster surfaces. Even when the cell size is very small, you can see the individual square cells when you zoom in. In order to work with raster data in ArcView, you need the Spatial Analyst extension. When raster layers have the same size cells, their values can be added, subtracted, multiplied, divided and queried using map algebra (a system developed by Dana Tomlin). Raster GIS layers are essentially images made up of individual pixels, just like scanned paper maps and aerial photographs. You can add raster data to ArcMap just as you do vector data, using the “add data” button menu option when the Spatial Analyst extension is available and is turned on. If the raster data have no spatial information (for example, a scanned map that has not been georeferenced), ArcMap will not be able pixels in scanned image to display it with other map layers. ArcMap saves raster layers in its GRID format. ArcCatalog recognizes GRIDs and other image formats (including BMP, JPEG, TIFF) as raster layers. Images with no extension (such as “denst8” show below, left) are GRIDs. If you view a GRID outside of ArcCatalog, it will consist of six or so files within a directory (see below, right). Raster Data in ArcCatalog
16
Raster Data in My Computer
Cartographic Modeling Laboratory
ArcView 9 Manual
Working with Projections Projections manage the distortion that is inevitable when a (mostly) spherical earth is viewed as a flat map. All projection systems distort geography in some way— either by distorting area, shape, distance, direction, or scale. There are dozens of different projection systems in use since different systems work best in different parts of the world and, even within the same parts of the world, GIS users have different priorities and needs. The tools for working with projections in ArcView 9.0 are more advanced than in ArcView 3.x, particularly in their ability to re-project layers with different projection systems “on the fly.” They look different from the projection tools in ArcView 8.3, although they essentially do the same thing. Recognizing the Coordinate System Map layers can be drawn according to a geographic coordinate system or projected coordinate system. Geographic coordinate systems indicate location using longitude and latitude based on a sphere (or spheroid) while projected coordinate systems use X and Y based on a plane. As long as computer screens and printed maps are flat, projected coordinate systems will be more appropriate for working with GIS data. Often you will not know the coordinate system used, particularly if you inherit data or download it from the Internet. If you are lucky, the map layer will include a .proj file which contains information about the coordinate system. You can look at the information in this file—the detailed spatial reference information—by clicking on the “general” tab of the layer properties from ArcMap. Alternatively, you can click on the “fields” tab of the layer properties from ArcCatalog, click inside the “shape” field and click on the “…” button to the right of “Spatial Reference.” If there is no projection information, you can map the data to determine its coordinate system. If the map units displayed in the gray bar below your map are in degrees, seconds, and minutes, then you know the data are in a geographic coordinate system. You may also recognize this because your maps look distorted. For example, when Philadelphia map layers are in a geographic coordinate system, the image appears to be sagging to the east. Map layers in geographic coordinate systems are sometimes described as “unprojected.” Map layers downloaded from the US Census Bureau are generally in this format. Working with “Unprojected” Layers In most cases you will want to convert unprojected map layers—those with a geographic coordinate system—to projected map layers. There are two steps involved in this process. First, you must create a .proj file “defining” the map layer as uprojected; then you can “project” the map layer using the projection of your choice. You can access the tools for doing this by clicking on the ArcToolbox icon inside ArcMap. Click on “data management tools” and then “projections and transformations.”
17
Cartographic Modeling Laboratory
ArcView 9 Manual
To “define” the coordinate system for your unprojected map layer, click on the “Define Projection” wizard. First you will be asked to choose a data layer. If you added the relevant map layer to ArcMap, you will be able to find it in the dropdown menu. Otherwise you will need to click on the folder icon to locate your map layer. button. Click the “select” Then you can choose the coordinate system using the button on the Spatial Reference Properties, then choose “Geographic Coordinate Systems,” “North America,” and “NAD 1983 Datum,” then click “okay.” You should not notice a difference in how the map layer is drawn as a result of defining the coordinate system. But as a result of defining it, there is now a .proj file associated with your map layer and you can look at the detailed spatial reference information. Before you define a layer as unprojected, ArcView will refer to it as “assumed geographic.”
In order to project the map layer, click on the “Project” wizard. If you are projecting a shapefile, use the “Project” wizard listed under “Features.” If you are projecting a raster image, use the “project” wizard listed under “raster.” As with the “define” wizard, you will be asked to specify the map layer. Next, because you will be changing the original layer, you are asked to name the new layer that will be created. By default, ArcView will add “_Project” to the original name. Click on the button to the right of “Output Coordinate System” to choose your projection. Click on the “select” button on the Spatial Reference Properties, then choose “Projected Coordinate Systems.” Now you need to choose your projection. For relatively small areas like Philadelphia, the differences in projection systems (the distortion in shape, area, distance, direction, and scale) are minimal. You are best off choosing whatever projection system is most commonly used. In Philadelphia, that is State Plane 1983 (feet) Pennsylvania South. For the Philadelphia MSA, consider UTM zone 18N. After making your selection, click “okay.” ArcView will indicate that there is a “Datum conflict between map and output.” In order to map your newly projected layer, create a new ArcMap document. Working with Projected Map Layers Sometimes the map layers you receive will already be projected but won’t carry a .proj file so you don’t know the projection. If you download the data, be sure to read any metadata files that may contain information about the project. If someone
18
Cartographic Modeling Laboratory
ArcView 9 Manual
has sent you the map layers, ask them about the projection. If these approaches fail, try mapping the data. You may recognize that the data are projected by the units showing in the gray bar below the map. If they are not in longitude and latitude, they are probably projected. As you work with a particular projection system, you will come to recognize the map units and range of coordinate values. For example, State Plane coordinates for Philadelphia are generally in feet and look like 2691607.78, 246268.98. UTM coordinates will be in meters and look like 486850.72, 4430095.19. When you add a shapefile to ArcMap that the software recognizes as being projected but has no .proj file, ArcMap will usually warn you that spatial reference information is missing. Data that are projected but missing spatial reference information will look fine when they are drawn, but you may not be able to use ArcView’s “on the fly” projection capabilities, measurement tools, spatial join, or geoprocessing functions.
If you know the projection, you can use the “Define Projection” wizard in the ArcToolbox. You will need to select the projection from the “Projected Coordinate Systems.” If a map layer is already projected AND defined, you can change the projection using the same tool. You will need to add the reprojected map layer to a new ArcMap document in order to see the results. Defining Projection for Data Frame Ideally, you will know and will specify the projection of each of your map layers. Alternatively, you can set the projection for your Data Frame for your map document. All of the map layers listed under the Layers icon in your table of contents are in the same data frame (you can have multiple data frames in the same map document, although in most cases you will probably have just one). Right click on the word “Layer,” go to Properties, and make the Coordinate System tab active. From here, you can choose a coordinate system (State Plane 1983 is in the “Projected Coordinate Systems” folder inside the “Predefined” folder).
19
Cartographic Modeling Laboratory
ArcView 9 Manual
Troubleshooting with Projections If you are unable to draw your map layers together or if your distance units do not make sense, you are likely experiencing a problem with projections. If you are not able to figure out the problem, you may want to show your shapefiles to someone with more GIS experience. It is easy to get confused while using the “Define Projection” and “Project” wizards, and frequently the more you try to fix the problem, the more mixed up your projections get. Stay calm and don’t be ashamed to ask for help. You may also have luck returning to your original files (be sure to keep a copy of the originals before messing with the projection).
20
Cartographic Modeling Laboratory
ArcView 9 Manual
Georectifying Images Georeferencing allows you to convert a paper map into a GIS map layer. Essentially, the process assigns X and Y coordinates to points on your digital map image, shifting, rotating, and scaling your map so that you can view it as a map layer along with your shapefiles. Create a raster image Scan your paper map. The higher resolution, the better. ArcMap can handle pretty big files, and it can work with lots of file types (.jpg, .tif, .bmp). If you have a choice, go with .tif. Add map image Add your image to ArcMap just as you would a shapefile or table, using the button or from the file menu, choose “add layer.” Depending upon the size of your image, a dialogue box will ask you if you’d like to add pyramids. Click “OK.”
Don’t worry if you get a warning message that your image lacks projection information. The name of your image should now appear in the table of contents and draw in the map view window. At this point, your image is in “pixel space” since there is no coordinate information. Add reference layers (shapefiles) Choose an existing shapefile that contains spatial information that will help you georeference your paper map (choose more than one, if necessary). You need a shapefile that covers the same extent as your paper map and
21
that contains several points that you can identify visually on your paper map. In the table of contents, put your reference layer(s) on top of your map image and highlight the reference shapefile. Right click and choose “zoom to layer.” From the view menu, choose toolbars Æ georeference. From the georeferencing menu, choose “fit to display.” Now your reference layer(s) should draw on top of your map image in the view map window. Add control points Click the “add control points” button.
Create your first control point on your image by clicking once on a point you can also identify on your shapefile. Then click on the shapefile in the corresponding spot. Double click to create a control point. You may find it easier to use the magnifier window (from the window menu, choose “magnifier”). Create additional control points. After doing this two or three times, your paper map should shift significantly to line up with the shapefile. Continue to add control points as long as doing so improves the alignment.
Cartographic Modeling Laboratory
View Links Click on the “view links” button to view the coordinates of each of the control points you’ve created.
The “residuals” column indicates the amount of error. You may improve the alignment of your image by deleting the point(s) with the greatest error.
ArcView 9 Manual
If you have six or more control points, you can perform a second order If you have six or more control points, you can perform a second order transformation; if you have twelve or more control points, you can perform a third order transformation. Rectify Image In order to permanently save the transformation, choose “rectify” from the georeferencing menu. ArcMap will create a new image (rather than changing your original data). Check the ArcMap Desktop Help if you want information about choosing a resampling type. You don’t have to rectify your image. If you want to revert to your original (ungeoreferenced) image, from the georeferencing menu, choose “reset transformation.”
22
Cartographic Modeling Laboratory
ArcView 9 Manual
Displaying Point Data ArcMap offers a wide range of colors and symbols for representing your point data. The real strength of a GIS is in allowing you to use different symbols to represent different values, linking your attribute data to your spatial data. Single Symbol The default in ArcMap is to represent all points with the same size, shape, and color symbol. This is how ArcMap will display your point shapefiles when they are first added to a map document or when you create them through geocoding or adding XY data. Open the layer properties (double click on the shapefile name or right click and go to “Properties,”) and click on the “Symbology” tab. In the box on the left side, “single symbol” will be highlighted. You can change the size, shape, or color of the symbol by clicking on it, but as long as “Single symbol” is selected, all of your points will appear the same. Unique Value Unique value allows you to use a different symbol for each of the points in a shapefile. This can work well for small files (10 or fewer points) but can quickly be overwhelming for larger files. From the symbology tab, click on “categories” (under “Show:”), and “unique values.” Using the “Value:” dropdown menu, select the field with the values you wish to use to represent your points, and click the “Add All Values” button. ArcMap will list a symbol for “” that you can remove by taking away the check mark. You can change the individual symbols by clicking on them. You can make changes to all of the symbols, or selected symbols (hold down the shift key to select two or more) by right clicking. To remove a value, right click on it and choose “Remove Value(s).” Use the black arrows on the far right to move values up and down (the order here will be the order your values appear in the legend on your map). Graduated Symbol Graduated symbols allow you to have different size symbols to represent different attribute values. With the symbology tab active, click on “Quantities” and then “Graduated symbols.” From the “Values:” dropdown menu, select the field with the values you wish to use. he default is five categories, so five value ranges represented by different size dots should appear below. Use the “classes” dropdown menu to change the number of categories.
23
Cartographic Modeling Laboratory
ArcView 9 Manual
There are many ways to break up value ranges into categories. The default is “Natural Breaks,” which uses Jenks optimization to identify grouping of values that minimize within group differences. To change this, click on the “Classify” button and use the Method dropdown menu to choose a different classification system. You can also adjust the cutoff points by moving the blue vertical lines in the histogram below that show the frequency of values. Alternatively, you can change values manually on the previous screen by clicking on them (you will only be able to change the ending value).
For more on symbology, see Getting to Know ArcMap, Chapter 5, “Symbolizing features and rasters,” pp. 83-114.
24
Cartographic Modeling Laboratory
ArcView 9 Manual
Displaying Area (Polygon) Data The symbols in ArcMap can be used for any type of data—points, lines, or polygons. The following symbology schemes work particularly well with area (polygon) data. Graduated Color You can use different colors—or different shades of the same color—to represent different values to create choropleth maps. From “Layer Properties,” click on the Symbology tab. On the left side of the screen, click on “Quantities” and “Graduated Color.” Choose the field with the values you wish to use. Use the “Classes” dropdown menu and the options in “Classify” to change the number of categories or method for breaking values into categories. You can normalize a value in order to transform it into a rate using the “Normalization” dropdown menu. For example, in order to show the percent of households receiving public assistance, normalize the total number of households receiving public assistance by the total number of households. Choropleth maps are best used to represent rates rather than raw counts since raw counts can look deceptively large for large polygons (alternatively, you can create new fields in your attribute table corresponding to rates). Graduated color works best when you use the same shade of a single color, with lighter shades representing lower values and darker shades representing higher values. But keep in mind that it may be impossible to distinguish between more than four or five shades of the same color, depending upon the quality of your printer. To fine-tune colors, go to “more colors” when choosing a color from the symbol selector. Here you can play with the hue(H), saturation(S), and value(V). Fill Patterns You can use different patterns in addition to, or instead of, using different colors to represent different values. Patterns are particularly helpful when you are restricted to printing maps in black and white. Choose “Graduated Colors” from the Symbology tab and select the field with the values you want to display. Set the number of classes and the method of classification, so that you are happy with the value ranges. Then click on the symbols and change the fill using the symbol selector. Click on the Properties button to fine-tune the fill pattern.
25
Cartographic Modeling Laboratory
ArcView 9 Manual
Dot Density Dot density maps use randomly placed dots within polygons to represent different values. They provide an alternative to using choropleth maps to represent raw counts, although it is important to remember (and communicate to anyone reading your map) that the points do not represent precise locations, as they do in a point layer. To create a dot density map, open the Layer Properties and make the Symbology tab active. Click on “Quantities” and “dot density.” From “Field Selection,” choose the field you wish to use as the basis for the map. Counts (such as the total number of households on public assistance) are appropriate for dot density maps, but averages, medians, and rates are not. Choose your dot size, or keep the default (which is advisable, at least to start). The “Min,” “Mean,” and “Max” boxes will give you a preview of how your map will look. The “Dot Value” indicates how many units each dot represents. Change this as needed to create dot densities that have enough dots to show variation but not so many that they are all on top of each other. You can change the color of the dot by clicking on it under “Symbol” in the top right part of the screen. Checking “maintain density” will ensure that the dot density looks the same as you zoom in and out (by making the dots bigger and smaller). Pie Charts Charts are good for showing multiple values and the relationship between values on different variables. Pie charts are especially good for showing proportions. For example, individual pie pieces can be used to show the breakdown in race for the population in a census tract. For the pies to work, you must be able to put every person into a racial group, or you must use an “other” category. Pies contain a lot of information, so it can be difficult to display them clearly. To create pie charts, click on “Charts” and “Pie” from the Symbology tab. Holding down the shift key, select the fields that you want to include. Make sure that together, they add up to 100 percent (you may need to create and calculate a new “other” field in your attribute table before using charts). Click on the “Background” button to change the color or fill (“Hollow” or white backgrounds might be best, so that you don’t have too many colors in your map). If you check “Prevent Chart Overlap,” ArcView will use “leader lines” to indicate where the pie charts belong if there is no room to display them within the map feature. Click on the Properties button to make adjustments to the look of the pie (3D, rotation, height).
26
Cartographic Modeling Laboratory
ArcView 9 Manual
Click on the Size button if you want to have different size pie charts depending upon the total (such as total population). If you choose to “Vary size using a field,” you may need to exclude records with a zero value. To do this, click on the Exclusion button and, using the appropriate field name, create an expression such as “[TotalPop] = 0.” You may need to play with the minimum size on the previous screen to make the maximum size pie chart a reasonable size. Bar/Column Charts Bar charts can be used to compare values on two or more variables that do not represent proportions (they don’t have to be subsets that add to 100 percent). For example, the map on the right compares the total population by block group to the total number of households. To switch from column (vertical) to bar (horizontal) charts, go to Properties on the Symbology tab of Layer Properties and switch the radio button under “Orientation.” Stacked Charts Stacked charts can be used to compare values on two or more variables (such as race) that are subsets of a larger variable (such as total population) when you don’t know, or don’t want to display, all of the subsets. You have many of the same options for formatting (size, color) that you have with the other types of charts.
27
Cartographic Modeling Laboratory
ArcView 9 Manual
Labeling Features Labeling features in ArcView can be frustrating and tedious, but labeling features well is important to making your maps readable, so it’s worth the effort to learn. Using Text Boxes to Label Features You can place text on a map in order to label map features. This can work well if you only have a few map features to label. Click on the button marked “A” on the drawing toolbar. This will bring up four buttons. Click on the “A.” Click on your map where you want your text to appear and type your label in the text box. Hit the enter key, or click your cursor outside the text box to complete. You can move the text around using the “Select Elements” tool. Double clicking on the text will bring up the Properties, where you can change the size and font (using the “Change Symbol” button). The callout text tool works similarly, except that it allows you to place your text away from the map feature while still indicating what is being labeled. Click on the tool and then click on your map feature. Before letting go, you can move the cursor to where you would like the label to be. Type your label. Using the “Select Items” tool, you can move the text box so that it is closer or further from the map feature. A third option is the spline text tool. This allows you to write text along a curved line. This works well for labeling rivers and curvy roads. Click on the spline tool, then click on the starting point for your label. Continue to click along the curve (you don’t need to make many clicks) and double click to finish. Then type your label in the text box. You will probably need to try this several times to get a label with which you are happy (just click on the label with the “Select Elements” tool and hit the “delete” key to delete a label).
28
Cartographic Modeling Laboratory
ArcView 9 Manual
Manually Placing Labels Using the label tools in ArcMap, rather than the text tools, allows you to use the values in a layer’s attribute table for your labels (in other words, you don’t have to type the label out as you do with the text tools). By manually placing labels, you also avoid having your labels act as a group, which means it’s easier to move or edit a single label. Before you can use the label tools in ArcMap, you need to indicate which field in the attribute table of your map layer you want to use as the basis for labels. From Layer Properties, click on the “Labels” tab. Leave the “label features in this layer” box empty. Choose the appropriate field from the Label Field dropdown menu. Click on symbol to change the size, style, or font for your labels. (Guessing what size to make your labels is difficult and you will probably need to make small adjustments after seeing what works). Using the “Placement Properties” button, you can instruct ArcView what to do about duplicate labels. The “Scale Range” allows you to instruct ArcView when to draw or not draw labels, depending on the extent. In order to do this, you need to know the exact scales you’ll be using (so you probably just want to leave this alone). The “Label Styles” button gives you access to some fancier label options. The highway labels are particularly helpful. Now you can use the label tool to manually label your map features. Click on the button marked “A” on the drawing toolbar and choose the “Label” tool . The “Labeling Options” window will open. Decide if you want ArcView to decide the best label position or if you want to determine that yourself. The “Choose a style” radio button gives you access to those fancier labels again. You can move these labels (using the “Select Elements” tool) and change their size and style (double click to bring up Properties). You can delete a label by clicking on it and pressing the delete key. Auto Labeling You may find it easier to automatically label all of your features. This saves time if you are happy with the way the labels look, but it offers you much less control over the label placement. When you automatically label features, the labels are “dynamic” so changes you make to one (moving it, changing the style) are made to all. To label your map features automatically, go to Layer Properties, click on the Label tab, and put a check mark in the “Label Features in this layer” box. You can also label automatically by right clicking a map layer and going to “Label Features.” To delete your labels, you’ll need
29
Cartographic Modeling Laboratory
ArcView 9 Manual
to return to the Label Properties box and remove the check mark from “Label Features in this layer” box or right click and go to “Label Features.” Converting Labels to Annotation One solution to the problem that dynamic labels present for fine-tuning is to convert them to annotation, so that they function as individual text boxes as they do with manually placed labels. To do this, right click on your map layer after labeling it and go to “Convert Labels to Annotation.”
30
Cartographic Modeling Laboratory
ArcView 9 Manual
Designing Map Layouts Displaying data so that you can analyze spatial patterns on a computer screen is one thing; printing out a map for other people to look at is another. ArcMap thinks of these as distinct functions and makes available a series of tools for designing map layouts that you don’t need until you are ready to print. Layout View When you open ArcMap, you are in “Data View” and use the Tools toolbar to navigate your map. When you switch to the Layout View, you have access to a different range of tools and use the Layout toolbar to navigate. To switch to “Layout View,” click on the icon at the bottom of your map display that looks like a piece of paper (next to the globe icon) or, from the View menu, go to Layout View. In Layout View, you get a much better idea of how your map will look when it’s printed. ArcMap will automatically place a border (“neat line”) around your map. You can change this by right clicking on it (so the line is turquoise and perforated) and going to “Properties.” Click on the “Frame” tab. From here you can choose a different style or color frame (to get rid of it altogether, choose “no color” from the color selector). You can also change the background color and add a shadow (to add a shadow, you’ll need to change the X and Y offset to something other than 0). To make your map larger or smaller on the page, you can use the zoom tools on the Tools toolbar or on the Layout toolbar. The Layout toolbar also includes a pan tool that you can use to move your whole layout. To move just your map (and not the whole page), use the pan tool in the Tools toolbar. The fixed zoom tools in the Layout toolbar work like the ones on the Tools toolbar. The “Zoom to whole page” button is especially useful.
31
Tools toolbar Layout toolbar
Cartographic Modeling Laboratory
ArcView 9 Manual
One the biggest differences in Layout View is that many more options in the “Insert” menu become active. These options allow you to add elements—including a title, legend, north arrow, scale bar, and image—to your layout. Each of these will be separate objects in your layout that can be moved and resized through their Properties. You won’t see any of them if you switch back to Data View since they are meant to clarify printed maps, not help you interpret your map on screen (in fact, the layout view is probably more confusing to look at from the screen because it adds so many elements and usually shrinks your map). You can add text in the Layout View, but you are better off trying to label features from the Data View, using the label or text tools. Working with Grids and Rulers You can bring up a number of options aimed at helping you to place the objects within your layout by right clicking in your layout outside of the neat lines. From “Options,” you can specify ruler units and turn on and off rulers and grids when the “Layout Options” tab is highlighted. Choosing to “snap” to the grid or rulers will help you to line up objects, but it will also limit your ability to make fine-level adjustments. Adding a Title To add a title, from the Insert menu go to “Title.” Type your title in the text box and hit the enter key or click the cursor outside the text box. Double click on the title to bring up the Properties where you can make changes. Adding a Legend Unless your labels are able to fully explain your map features, you will want a legend on your layout. ArcMap gives you great flexibility in formatting your legend, and all the choices can be overwhelming. To add a legend, from the Insert menu go to “Legend.” Your first choice is what map layers you want included. ArcView will guess that you want to include all active layers. This may not be the case if you have layers such as a county boundary, rivers, or other obvious features that don’t need to be included in the legend. To remove a layer from the legend, click on its name on the right side of this first screen and click on the “