system in total. In this case, the system is defined as the CO2 capture environment ..... lead to the formation of NOx and SOx, respectively. Additionally, coal ...
Chapter 1
Introduction to Carbon Capture
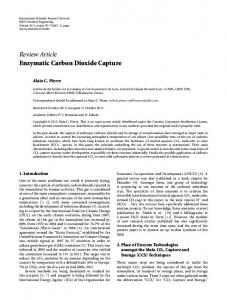
The capture of CO2 is motivated by the forecasted change in climate as a result of the world’s dependence on fossil fuels for energy generation. Mitigation of CO2 emissions is the challenge of the future for stabilizing global warming.The separation of CO2 from gas mixtures is a commercial activity today in hydrogen, ammonia, and natural gas purification plants. Typically, the CO2 is vented to the atmosphere, but in some cases, it is captured and used. The current primary uses of CO2 include enhanced oil recovery (EOR) and the food industry (carbonated beverages). The traditional approach for CO2 capture for these uses is solvent-based absorption. It is unclear whether this technology will be the optimal choice to tackle the scale of CO2 emitted on an annual basis (∼30 Gt worldwide). A new global interest in extending CO2 capture to power plants is producing a dramatic expansion in R&D and many new concepts associated with clean energy conversion processes. The application of CO2 capture technologies beyond concentrated sources is in view, but less tractable. The first and second laws of thermodynamics set boundaries on the minimum work required for CO2 separation. Real separation processes will come with irreversibilities and subsequent inefficiencies taking us further from best-case scenarios. The inefficiency of a given process reveals itself in the form of operating and maintenance, and capital costs. The interconnected nature of multiple fields of science and engineering is essential. Appreciating the physical and chemical properties of the various CO2 emissions sources serves as a critical first step. Envisioning methods for its capture will occupy the next several decades of engineers, chemists, physicists, earth scientists, mathematicians, and social scientists. Where will the capture technology be applied? What might the technology involve? Will we one day place systems in the desert to capture dilute CO2 directly from air? Will we install CO2 separators on automobiles and airplanes so that consumers exchange CO2 for fuel at refueling stations? CO2 capture is often considered in the context of point sources such as coal-fired power plants or industrial processes, but breakthroughs in research must lead to applications of CO2 capture to an even wider realization of its abatement potential. Process engineering, materials science, catalysis and nanoscience will likely play key roles in hybridizing the known technologies toward an integrative approach to meet the challenge. Figure 1.1 illustrates the multiple scales that a particular
J. Wilcox, Carbon Capture, DOI 10.1007/978-1-4614-2215-0_1, © Springer Science+Business Media, LLC 2012
1
2
1 Introduction to Carbon Capture
Fig. 1.1 Schematic of the overlap between the scales across the portfolio of solutions to CO2 capture
solution for CO2 capture may entail. At the heart of any CO2 capture technology is the material and its required properties for optimizing mass transfer from a gas mixture to a captured phase. The material may be a solvent, sorbent , membrane or catalyst. Mass transfer acts as the bridge and links the optimal material properties with the overall separation process, whether it is a combined absorber-stripper system, sorption apparatus, membrane module, or catalytic reactor. The material properties, mass transfer, and capture process must be considered as coupled and inherent to the system in total. In this case, the system is defined as the CO2 capture environment and the local surroundings of the capture assembly. A CO2 capture technology may look quite different for the direct air capture of CO2 (DAC) in which the concentration of CO2 is quite dilute, i.e., approximately 0.0390 mol% (390 ppm) versus its capture from the exhaust of a power plant, in which its concentration is on average 12 mol%. In addition to the concentration difference, CO2 capture from a power plant must overcome the challenge associated with the timescale and throughput of emissions. For instance, a 500-MW power plant emits on average 11,000 tons1 of CO2 per day. Direct air capture is much less efficient. For example, assuming an air flow rate of 2 m/s, capturing 11,000 tons of CO2 per day directly from the air requires a surface area of approximately 133,000 m2 to process 2.31 × 10¹⁰ m3 of air per day.2 This chapter provides a brief overview of CO2 sources, as well as the physical and chemical nature of its environment. This overview motivates further discussion of fuel oxidation and combustion, the heart of CO2 emissions. Knowledge of the chemical composition of a given exhaust mixture allows for the determination of the minimum work required for CO2 separation from the mixture. The 2nd-law efficiency is defined as the ratio between this ideal minimum work and the real work associated with the unit operations of the actual separation process. Known processes relying on absorption, adsorption, membrane, and hybrid processes can then be investigated. Chapter 2 focuses on Compression and Transport of CO2 . Knowledge of CO2 phase behavior as a function of temperature and pressure throughout compression and transport processes is crucial to determine safe and cost-effective approaches to 1
Throughout the textbook, “ton” is in reference to a metric ton and is sometimes referred to as tonne, which is equal to 1000 kg. 2 This assumes 100% capture of the CO2 at a concentration in air of approximately 390 ppm.
1.1 Relationship Between CO2 and Climate
3
handling CO2 between the capture and potential-use stages. Once CO2 is captured and compressed, the question becomes what to do with it. This will be addressed shortly. The phase behavior of CO2 and fundamental equations associated with its compression also play a role in separations processes. Although compression and transport take place after CO2 capture, presenting this material prior to the separation processes provides a foundation and set of equations referenced in future chapters. Chapters 3–6 focus on Absorption, Adsorption, Membrane Technology, and Air Separation, respectively. These broad-reaching chapters are motivated by the operating, maintenance, and capital costs of a given separation process. Costs are bridged in step-wise fashion to the fundamental chemical and physical processes that underlie the mass transfer of CO2 from a gas to its captured form. In particular, Chapter 6 discusses air separation (i.e., the separation of air into N2 , O2 , and argon) as it may play a key role in CO2 capture since N2 is the primary inert gas diluting most CO2 -inclusive gas mixtures. Chapters 7–9 examine nontraditional separation technologies that in the most ideal sense may be considered carbon-neutral. The topics covered in these chapters include the role that algae plays in CO2 capture, CO2 electrocatalysis and photocatalysis to fuel and chemicals, and mineral carbonation, respectively. These are interesting approaches to consider in the CO2 capture portfolio since currently they are investigated primarily as post-capture processes. For instance, the conversion of CO2 via algae, electrocatalytic, and photocatalytic processes to a chemical or fuel has mostly been investigated for the conversion of CO2 -rich gas streams as the input. However, with technological advancements it may be possible to use such approaches to combine CO2 capture and conversion in a single process. Chapter 9 discusses mineral carbonation, focusing on the potential to form mineral carbonates from reacting CO2 with an alkalinity source. Natural and industrial waste byproduct alkalinity sources are considered, with a particular focus on industrial waste alkalinity sources since the mineral carbonation process would be sequestering CO2 in addition to other potentially hazardous components of the waste. The potential to reuse the mineral carbonates as aggregate for construction applications may serve as a driver to move this technology forward. These chapters review of each of these processes and their current challenges. The separation processes considered in Chaps. 3–6 for CO2 capture may be broken down into their fundamental unit operations with the work requirements determined for each stage of separation, such as blower power for gas compression or pumping power for solvent transport. The reader can work through the application of a capture technology from a gas mixture containing CO2 and based upon the local environment and composition, determine the feasibility of capture with current separation tools or a hybrid thereof based upon its 2nd-law efficiency.
1.1
Relationship Between CO2 and Climate
The combustion of fossil fuels, i.e., coal, petroleum, and natural gas, is the major anthropogenic source of CO2 emissions, with an estimated 30 gigatons (Gt) CO2 (e.g., 30 billion tons) generated per year as illustrated in Fig. 1.2 [1]. This figure shows the
4
1 Introduction to Carbon Capture
Fig. 1.2 Global fuel-based CO2 emissions from the period of 1970–2008 (total and by fuel type) [2]
breakdown of CO2 emissions by fuel type, with coal burning surpassing oil-sourced emissions around 2004. Figure 1.3 shows the breakdown in CO2 emissions from the top-emitting countries, with China surpassing the U.S. around 2006 [2]. It is clear that human activities over the course of the 20th century, have led to increasing greenhouse gas (GHG) emissions. Studies indicate that increases in CO2 concentration in the atmosphere leads to irreversible climate changes lasting up to 1,000 years, even after elimination of emissions [3]. Additionally, even if anthropogenic GHG emissions remained constant from today, the world would still experience continued warming for several centuries [4]. For global mean temperature stabilization, GHG emissions would have to cease today [3, 5], which is difficult due to our reliance on the existing fossil-based energy and transportation infrastructure, which is expected to contribute to GHG emissions for tens of years to come [6]. Examples of irreversible climate changes include atmospheric warming, dryseason rainfall reductions in several regions comparable to those of the “dust bowl” era3 , more extreme weather events and inexorable sea level rise [3]. The carbonclimate response, which is defined as the ratio of temperature change to cumulative 3
The “dust bowl” era from 1930–1936 was a period of dust storms causing major ecological and agricultural damage to the prairie lands of the U.S. (panhandles of Texas and Oklahoma, and neighboring regions of New Mexico, Colorado, and Kansas) and Canada, causing severe drought followed by decades of extensive farming without crop rotation or other techniques to prevent wind erosion. Millions of acres of farmland became useless, with hundreds of thousands of people leaving their homes and migrating to California and other states.
1.1 Relationship Between CO2 and Climate
5
Fig. 1.3 Global fuel-based CO2 emissions by top-emitting countries from 1990 to 2008 [2]
CO2 emissions is estimated at approximately 1.0–2.1◦ C per 3600 Gt of CO2 emitted into the atmosphere [7]. The natural carbon cycle is responsible for a portion of the removal of CO2 from the atmosphere, some to the oceans and some to terrestrial vegetation. The natural carbon cycle includes exchange with the land biosphere (photosynthesis and deforestation), the surface layer of the ocean, and a much slower penetration into the depth of the ocean, which is dependent upon vertical transport and the buffering effect of the ocean’s chemistry [3]. The carbon flows associated with global photosynthesis and respiration are generally an order of magnitude larger in scale than the extraction and combustion of fossil fuel, but are largely in balance. With updated estimates on CO2 emissions from both deforestation and coal combustion, estimated emissions from deforestation and forest degradation represent approximately 12 to 13% of global anthropogenic CO2 emissions [8], different from previous estimates of 20% [9]. In addition to CO2 , other GHGs include methane (CH4 ), nitrous oxide (N2 O), hydrofluorocarbons (HFCs), perfluorocarbons (PFCs), and sulfur hexafluoride (SF6 ). Researchers predict that non-CO2 GHG emissions will constitute approximately4 one-third of total CO2 equivalent emissions over the 2000–2049 period [10]. This textbook, however, focuses primarily on the separation of CO2 , which remains the primary anthropogenic contributor to climate change [11]. 4
Based on 100-year global warming potentials.
6
1 Introduction to Carbon Capture
Table 1.1 Estimated 2011 U.S. CO2 exhaust emissions [2] Source
Emissions sector (Mt CO2 /year) Trans
Petroleum
1952.68
Natural gas
33.1
Coal
∼0
Total
Elec. 102.30
Comm. Ind. 54.93
319.11 163.06 1983.81
9.28
1985.79 2405.22 227.26
Exhaust mixture Res.
Total
416.83 100.91 2627.64 CO2 (3–8 vol%) SO2 ; NOX ; PM; CO 397.54 262.42 1175.24 CO2 (3–5 vol%) NOx ; CO; PM 187.99 0.81 2181.89 CO2 (12–15 vol%) PM; SO2 ; NOX ; CO; Hg 1002.6 364.14 5984.77
Table 1.2 Estimated 2008 U.S. and worldwide CO2 process emissions [15] Non-Fossil
Emissions (Mt CO2 /year)
CO2 content (vol %)
Cement production Refineries Iron and steel production Ethylene production Ammonia processing Natural gas production Limestone consumption Waste combustion Soda ash manufacture Aluminum manufacture
50 (world 2000) 159 (world 850) 19 (world 1000) 61 (world 260) 7 (world 150) 30 (world 50) 19 11 (electricity) 4 4 (world 8)
14–33 3–13 15 12 100 5–70 50 20
1.2
CO2 Sources and Sinks
The combustion of fossil fuels produces an estimated 30 Gt of CO2 per year. Deforestation of tropical regions accounts for an additional 4 Gt CO2 per year [8]. Due to the natural carbon cycle and associated terrestrial and ocean CO2 sinks, the annual increase in CO2 emissions averages approximately 15 Gt CO2 per year, which is equivalent to 2 ppm per year. Fossil fuel-based emissions of CO2 may be sourced from both stationary (e.g., power plant) and non-stationary systems (e.g., automobile). There are approximately 13 Gt CO2 per year on average from large stationary sources globally, and approximately 2.5 Gt in the U.S. as illustrated in Table 1.1 [2]. In addition to CO2 emissions generation from the oxidation of fossil fuels, emissions may also be sourced as a result of a chemical process. Although these emissions sources represent a minor portion of total anthropogenic emissions, the chemical processing method currently used may be required for the formation of a useful product, such as cement or steel. Therefore, due to the difficulty of replacing CO2 generating chemical processes with others that are absent of CO2 , it is crucial that these emissions sources are not disregarded. Chemical Processes Although fossil-fuel oxidation processes produce the majority of emissions, there is a fraction of emissions generated from chemical processes. Examples presented in Table 1.2 [15] include cement manufacturing, iron and steel
1.2 CO2 Sources and Sinks
7
production, gas processing, oil refining, and ethylene production. Mitigation associated with the capture of CO2 from these industrial-based processes is small compared to that of the transportation and electricity sectors; however, there may not be alternatives to the materials created from these processes, such as cement, iron and steel production, etc. Several of these processes are discussed briefly. Cement manufacturing results in CO2 emissions sourced from calcination in addition to the fuel combustion emissions of the cement kilns. Estimated 2008 emissions worldwide from cement production were approximately 2 Gt of CO2 with approximately 52 and 48% associated with the calcination process and cement kilns, respectively. Portland cement is a mixture of primarily di- and tricalcium silicates (2CaO·SiO2 , 3CaO·SiO2 ) with lesser amounts of other compounds including calcium sulfate (CaSO4 ), magnesium, aluminum, and iron oxides, and tricalcium aluminate (3CaO · Al2 O3 ). The primary reaction that takes place in this process is the formation of calcium oxide and CO2 from calcium carbonate, which is highly endothermic and requires 3.5–6.0 GJ per ton of cement produced. Within the steel-making process a combination of emissions and the chemical processes comprise the estimated 1 Gt of CO2 emitted worldwide. Steel-making, generates CO2 as a result of carbon oxidation to carbon monoxide, which is required for the reduction of hematite ore (Fe2 O3 ) to molten iron (pig iron). The CO2 is also sourced from a combination of coal-burning and limestone calcination. In the second stage of the steel-making process, the carbon content of pig iron is reduced in an oxygen-fired furnace from approximately 4–5% down to 0.1–1%, and is known as the basic oxygen steelmaking (BOS) process. Both of these steps produce a steel-slag waste high in lime and iron content. In 2008, roughly 630 refineries emitted on average 1.25 Mt each, resulting in approximately 850 Mt of CO2 emitted in the atmosphere. In an oil refining process, crude oil, a mixture of various hydrocarbon components ranging broadly in molecular weight, is fractionated from lighter to heavier components. In a second stage, the heavier components are catalytically “cracked” to form shorter hydrocarbon chains. In addition to producing CO2 as a byproduct of the distillation and catalytic cracking processes, the heat and electricity required for the methane reforming process used in H2 production for hydrocracking and plant utilities produce additional CO2 . Recovered natural gas from gas fields or other geologic sources often contains varying levels of nonhydrocarbon components such as CO2 , N2 , H2 S, and helium. Natural gas (primarily methane and ethane) and other light hydrocarbons such as propane and butane, to less extent, are the valuable products in these cases, and often the generated CO2 is a near-pure stream. Concentrations of approximately 20% CO2 are not uncommon in large natural gas fields. A unique case is Indonesia’s Natuna field, which commercially produces natural gas containing approximately 70% CO2 [12]. Exhaust Emissions Comparing the sectors (electricity, transportation, industrial, commercial, and residential), currently the electricity sector is the largest, representing 40% of total U.S. CO2 emissions. Among all the sectors, comparing the different fossil fuel sources, i.e., coal, petroleum, and natural gas, petroleum constitutes the
8
1 Introduction to Carbon Capture
majority of the emissions at approximately 43%. Carbon capture technologies and the appropriateness of their application are highly dependent upon the following four factors: 1) the nature of the application, i.e., a coal-fired power plant, an automobile, air, etc., 2) the concentration of CO2 in the gas mixture, 3) the chemical environment of CO2 , i.e., the presence of water vapor, acid species (SO2 , NOx ), particulate matter (PM), etc., and 4) the physical conditions of the CO2 environment, i.e., the temperature and pressure. A brief discussion of each of these factors highlights their importance. The concentration of CO2 plays a role in that the work required for separation decreases as the CO2 concentration increases. The greater the CO2 content in a given gas mixture, the easier it is to carry out the separation. This concept will be revisited toward the end of the chapter. If the CO2 concentration in a gas mixture is too low then certain separation processes may be ruled out under their current design. For instance, in order for membrane technologies to be effective, a sufficient driving force is required. One of the many benefits of membrane technology is reduced capital cost. Membranes are a once-through technology in that the gas mixture enters the membrane in one stream and leaves the membrane as two streams, with one of the streams concentrated in CO2 . But since most of the sources of CO2 are fairly dilute as shown in Table 1.1, this technology currently has limited application unless novel measures are taken. The chemical-process-based sources of CO2 tend to have higher concentrations making these processes targets for membrane technology application. Examples include ammonia, hydrogen, and ethanol production facilities. In addition, the chemical environment of CO2 is important when considering the separation technology since some technologies may have a higher selectivity to other chemical species in the gas mixture. For instance, in coal-fired flue gas water vapor and acid gas species such as SO2 and NOx compounds may compete with CO2 for binding in solution or on a material. The final factor to consider is the temperature and pressure of the potential CO2 application. If a process occurs at high temperature or pressure it may be possible to take advantage of the work stored at the given conditions for use in the separation process. For instance, a catalytic reaction involving CO2 may be enhanced at high temperature. An example of a catalytic approach for flue gas scrubbing is the case of NOx reduction to water vapor and N2 from the catalytic reaction of NOx with ammonia across vanadia-based catalysts. This approach to NOx reduction in a power plant is referred to as selective catalytic reduction. Noncatalytic NOx reduction, in which ammonia is injected directly into the boiler is also practiced, but is not as effective as the catalytic approach [13]. Membrane technology is another example, in that separation may be enhanced at high pressure. Carrying out an exergy analysis [14] on a given CO2 generation source and capture process is a useful exercise, which can aid in determining the potential irreversibilities associated with each step. Exergy is defined as the amount of energy in a process that is potentially available to do work. For instance, if one were to design a CO2 separation process that effectively used the thermal energy available at the high temperature of the flue gas then this would be maximizing the exergy in the system. The flue gas temperature ranges from approximately 650◦ C at the exit of the boiler
1.2 CO2 Sources and Sinks
9
Table 1.3 Current CO2 -EOR projects taking place in the U.S.a [17] Location
W. Texas/New Mexico/Arizona Colorado/Wyoming Mississippi/Louisiana Michigan Oklahoma Saskatchewan Total (MMcfd CO2 ) Total (Mt CO2 )
CO2 sources
Natural CO2 (Colorado/New Mexico) Gas processing plants (W. Texas) Gas processing plant (Wyoming) Natural CO2 (Mississippi) Ammonia plant (Michigan) Fertilizer plant (Oklahoma) Coal gasification plant (North Dakota)
CO2 supply (MMcfdb ) Natural
Anthropogenic
1670
105
– 680 – – – 2350 45
230 – 15 30 150 530 10
a
MIT EOR report estimates 65 Mt CO2 for EOR annually [18] MMcfd stands for one million cubic feet per day of CO2 and may be converted to Mt CO2 per year by dividing by 18.9 Mcf per metric ton and multiplying by 365
b
down to approximately 40–65◦ C at the stack. Current technologies such as absorption and adsorption are exothermic processes that are enhanced at low temperatures and in a traditional sense are not effective strategies for taking direct advantage of the exergy of the high-temperature flue gas. For instance, the capture of CO2 is most effective at low temperature for absorption and adsorption processes with the regeneration of the solvent or sorbent most effective at elevated temperatures. Membrane separation and catalytic-based technologies, may however, be enhanced at the elevated temperatures (and pressures) available at exit boiler or gasifier conditions, depending on the specific technology. CO2 Usage and Sinks The primary use of CO2 is for EOR, which has been taking place for several decades, beginning with the Permian Basin located in West Texas and neighboring area of southeastern New Mexico, underlying an area of approximately 190,000 km2 . The primary source of CO2 for these activities include the natural CO2 reservoirs in Sheep Mountain and the McElmo dome, both located in Colorado, and Bravo dome in New Mexico. The CO2 gas is transported to the fields of the Permian Basin through pipeline networks. The existing networks of CO2 pipeline in the U.S. are discussed in further detail in Chap. 2, Compression and Transport of CO2 . Currently, on average, CO2 -EOR provides the equivalent of 5% of the U.S. crude oil production at approximately 280,000 barrels of oil per day [16]. A limitation of reaching higher EOR production is the availability of CO2 . Natural CO2 fields provide approximately 45 Mt CO2 per year, with anthropogenic sources slowly increasing (currently 10 Mt CO2 per year) as illustrated by the list of current activities in Table 1.3 [17]. Although the discussion of CO2 -EOR thus far has been centered on the usage of CO2 , EOR may also be a viable approach to potentially store CO2 . For instance, the CO2 used for EOR is not completely recovered with the oil. In fact, only 20–40% of the CO2 injected for EOR is produced with the oil, separated, and reinjected for additional production [18]. To date, EOR has not had any financial incentive to maximize
10
1 Introduction to Carbon Capture
CO2 left below ground. In fact, since the cost of oil recovery is closely coupled to the purchase cost of CO2 , extensive reservoir design efforts have gone into minimizing the CO2 required for enhanced recovery. If, on the other hand, the objective of CO2 injection is to increase the amount of CO2 left underground while recovering maximum oil, then the approach to the design question changes. If there were such an incentive, likely an even larger fraction would stay below ground, via modifications of EOR. Researchers at Stanford University have investigated the co-optimization of CO2 storage with enhanced oil recovery [19]. Their investigations conclude that traditional EOR techniques such as injecting CO2 and water in a sequential fashion (i.e., water-alternating-gas process) are not conducive to CO2 storage. A suggested modified approach includes a well-control process, in which wells producing large volumes of gas are closed and only allowed to open as reservoir pressure increases. In addition to co-optimization of CO2 storage with EOR, ongoing efforts exist for coupled CO2 storage with enhanced coalbed methane recovery (ECBM) [20] and potentially enhanced natural gas recovery from gas shales [21]. As previously discussed, postcombustion capture of CO2 has taken place commercially for decades, primarily for the purification of gas streams other than combustion products. Amine use for CO2 capture was first patented in 1930 [22] and later in 1952 [23] for the purification of hydrocarbons. Since these times, its primary use has been to meet purity specification requirements for natural gas distribution and the food and beverage industry. Table 1.4 lists some selected power plant and industrial facilities that capture, transport, and store (temporarily in the case of the food industry) CO2 in an integrated system. Comparing Tables 1.3 and 1.4, it is interesting to notice the difference in scale of CO2 usage for EOR versus other industries. The Bellingham Cogeneration Facility located in Massachusetts generates electricity and uses a Fluor Econamine FGSM regenerable solvent process and is capable of recovering 85–95% of the flue gas CO2 for food-grade CO2 at 95–99% purity. It is important to recognize that usage of CO2 in the food industry is not a mitigation option as the CO2 is subsequently reemitted into the atmosphere, yet the usage of CO2 continues to drive the advancement of the separation technologies. One might consider the option of converting CO2 into additional useful products such as carbonates as previously discussed, but taking a look into the current scale of the worldwide chemical industry, one quickly recognizes that even if CO2 was converted to useful products on the scale of every chemical produced worldwide, this would still constitute less than 5% of the current fossil-based CO2 emissions. Consider the scale of CO2 emissions associated with each of the primary energy resources. The annual emissions5 generated from coal, petroleum, and gas are on the order of 13, 11, and 6 Gt CO2 , respectively [2]. Collectively, the emissions associated with the oxidation of fossil-based energy resources are on the order of 30 Gt CO2 per year. Now, consider the top chemicals produced worldwide [24], which are shown in Table 1.5. Lime, sulfuric acid, ammonia, and ethylene production are on the order of 283, 200, 154, and 113 million tons in 2009, respectively. If one could capture the CO2 5
Data from 2008, IEA: Coal 12595 Gt CO2 ; Oil 10821 Gt CO2 ; Gas 5862 Gt CO2 .
1991 1996 2004 2005 2008
1978 1991
Startup year
17 NA NA 18 NA
43 17
Capacity (MW)
Amine (Lummus) Amine (Aker) Amine (multiple) Amine (MHI) Amine (Aker)
Amine (Lummus) Amine (Fluor)
Solvent
0.11 1.0 1.0 0.12 0.7
0.29 0.11
CO2 captured (Mt/yr)
CO2 is captured from boiler flue gases and is used to carbonate brine for soda ash (sodium carbonate) production; soda ash is primarily used as a water softener, but has other uses associated with pH regulation
a
Coal-fired power plant Natural gas separation Natural gas separation Natural gas-fired power plant Natural gas separation
Coal and petroleum coke-fired boilers Natural gas-fired power plant
Projects located in the U.S. IMC Global Inc. Soda Ash Plant (Trona, CA)a Bellingham Cogeneration Facility (Bellingham, MA)
Projects located outside the U.S. Soda Ash Botswana Sua Pan Plant (Botswana) Statoil Sleipner West Gas Field (North Sea, Norway) BP Gas Processing Plant (In Salah, Algeria) Mitsubishi Chemical Kurosaki Plant (Kurosaki, Japan) Snøhvit Field LNG and CO2 Storage Project (North Sea, Norway)
Plant type
Project name and location
Table 1.4 Selected commercial postcombustion capture processes at power plants and industrial facilities [16]
1.2 CO2 Sources and Sinks 11
12 Table 1.5 Approximate production of top 10 chemicals produced U.S. and worldwide in 2009 [24]
1 Introduction to Carbon Capture Chemical
U.S. (Mt)
World (Mt)
1. 2. 3. 4. 5. 6. 7. 8. 9. 10.
38.7 32.5 25.0 23.3 19.4 17.0 15.3 13.9 12.0 11.4
199.9 139.6 112.6 100.0 283.0 60.0 53.0 153.9 61.2 22.0
Sulfuric acid Nitrogena Ethylene Oxygena Lime Polyethylene Propylene Ammonia Chlorine Phosphoric acid
a N2 and O2 are both sourced from air and each have unique markets
Table 1.6 World CO2 storage capacity estimates for several geologic formations [15b, 26]
Geologic formation
Worldwide (Gt CO2 )
Deep saline aquifers Depleted oil and gas fields Unmineable coalbeds
1,000–10,000a 200–900 100–300
a
Source: IPCC (2007), deep saline aquifer capacity is noted as uncertain
at scale and turn it into useable chemicals equating to the current market of these top chemicals produced, this would mitigate a mere 2.5% of the CO2 generated worldwide annually. This provides insight into the staggering scale of the fossil-based CO2 emissions. Although this book is focused solely on CO2 capture, it is important to recognize the uses of CO2 that might aid in advancing capture technologies. Additionally, if CO2 is captured on the scale that is anticipated required for minimizing negative climate change impacts, the amount of CO2 captured will be far greater than the current market usage. Carbon dioxide capture and storage (CCS) is expected to be a primary component of the portfolio of options for mitigating CO2 emissions at the required scale [15b, 25]. Storage possibilities include the geologic formations: deep saline aquifers, depleted oil and gas fields, and unmineable coalbeds. Table 1.6 lists the CO2 storage capacity estimates for these primary types of geologic formations considered. The accurate determination of the storage estimates presented in Table 1.6 is difficult, which is why the estimates range so broadly [27]. The geological nature of a storage site can be quite complex and each site can vary considerably. The market for CO2 use and the storage potential for CO2 exist. The key is to determine the most effective portfolio of solutions [28] for the variety of emissions scenarios that exist to capture CO2 for the existing markets. Steam-based electricity generation was not invented with the anticipation of capturing CO2 ; therefore, it is reasonable to return to the beginning and to understand the formation pathway of CO2 from the oxidation of fossil fuel and to possibly consider alternative approaches
1.3 Formation Pathways of CO2
13
to energy generation that could result in higher plant efficiencies with the inclusion of CO2 capture.
1.3
Formation Pathways of CO2
As discussed previously, the primary sources of CO2 release into the atmosphere are listed in Table 1.1, with the majority of the CO2 produced from the oxidation of fossil fuels. Understanding CO2 capture technologies and envisioning solutions to this challenge requires knowledge of how the CO2 is originally generated. This involves some background on fuel oxidation mechanisms, combustion science, and in general fuel-to-energy conversion processes. A more detailed description of the basic fundamentals of combustion processes is available in Appendix A. Coal Oxidation Coal is a sedimentary rock formed of fossilized vegetation of different types. Coal may be sourced deep underground (average depths of approximately 600 ft) or close to the surface, having taken up to 400 million years to form under varying temperature and pressure conditions. The four major classes of coal, also known as rank, are lignite, subbituminous, bituminous, and anthracite, in order of youngest to oldest. The lowest ranked coal (lignite) has the lowest carbon content (∼60 mass%) and is highest in volatiles and moisture content, compared to the highest rank coal, anthracite (carbon content ∼90 mass%) [29]. Coal is a complex amorphous mixture of carbon, hydrogen, oxygen, sulfur, nitrogen, moisture, ash, and trace metals. The ideal chemical composition of coal’s three principal elements can be written as CHm On . Usually, m < 1 and m < n. Coal primarily consists of carbon, hydrogen, and oxygen, but may also consist of nitrogen and sulfur, which lead to the formation of NOx and SOx , respectively. Additionally, coal contains volatile trace metals that evolve from the coal at the high temperature conditions of the boiler. The trace metals, mercury, selenium, and arsenic are present at ppb levels in most flue gases [30]. However, it is important to note that depending on the type of coal and source from which the coal was mined, the chemical constituents may vary significantly. The chemical composition of coal varies greatly depending upon its rank and origin. Although coal combustion is a complex process since all coal is unique, in general it is consistent in that initially moisture and volatiles are driven off, followed by direct carbon oxidation. Coal combustion is a heterogeneous reaction involving the oxidation of coal through the transport to and subsequent reactivity of O2 with its surface. Heterogeneous implies that two phases are taking part in the reaction, i.e., the solid coal surface and oxygen in the gas phase. The coal is comprised of pulverized porous particles ranging in size from 75–300 μm depending upon the boiler type. Gas-phase species reacting with the coal surface must diffuse through the intricate pore network within the coal particles as depicted by the scanning electron microscopy image in Fig. 1.4. In reality, the coal surface may be oxidized by a combination of species present in the gas phase, that is, O2 , CO2 , and H2 O proceeding by the following
14
1 Introduction to Carbon Capture
Fig. 1.4 Scanning electron microscopy images of subbituminous coal. The image on the right is a magnification of the particle on the left, both on the micron scale. (Courtesy of [1])
global reactions: C + O2 → CO2
(1.1)
2C + O2 → 2CO
(1.2)
C + CO2 → 2CO
(1.3)
C + H2 O → CO + H2
(1.4)
A global reaction is one that is comprised of a series of elementary reactions, which are reactions that proceed as they are written. For instance, Reaction (1.1) is not elementary since the formation of gas-phase CO2 in this case would involve a series of elementary steps such as O2 adsorption, O2 bond stretching, CO bond forming, etc. At the high temperatures of coal combustion, a dominating reaction is heterogeneous carbon oxidation to the formation of CO, followed by homogeneous CO oxidation by O2 to CO2 . Coal-to-Electricity Conversion Just under 50% of the electricity generated in the U.S. is powered by coal-fired steam power plants. Figure 1.5 is a simplified version of a power plant with the basic components responsible for generating power. Understanding the coal-to-electricity conversion process allows one to appreciate the life cycle of CO2 from the oxidation of the coal’s carbon surface to the exit of the stack. Figure 1.5 also shows how other scrubbing technologies have been arranged downstream of the boiler exit. For instance, NOx reduction (i.e., mitigation) is taking place here using a high-temperature catalyst so its placement is at the boiler exit to maximize the thermal energy required for enhanced conversion. The removal of SOx with an absorption set-up is placed at the lowest temperature available since absorption is an exothermic process. For CO2 capture, an additional scrubbing unit would be placed in this plant configuration, with its exact location dependent upon the type of separation process used (e.g., absorption, adsorption, membrane, or catalytic). The steps of coal conversion to electricity are complex in reality, but are simplified here for a general understanding of the process:
Fig. 1.5 Coal-fired power plant (Courtesy of The Babcock & Wilcox Company)
1.3 Formation Pathways of CO2 15
16
1 Introduction to Carbon Capture
1. During startup, the furnace is pre-heated by combustion of auxiliary fuel such as natural gas or oil; 2. Pulverized coal powder is blown with air into a combustion chamber (boiler or furnace) through a series of nozzles; combustion of the coal particles creates hot combustion products; 3. Heat is transferred from the hot combustion products to water circulating in tubes along the boiler walls; this produces superheated steam, which is the working fluid for the steam turbines; 4. Pumps are used to increase the pressure of the working fluid; 5. Energy from the hot and pressurized steam is extracted in steam turbines that then transmit the energy to electric generators; 6. The electric generators convert the shaft work of the turbines into alternating current electricity; 7. Heat exchangers are used to condense the energy-drained steam from the turbines; 8. Pumps are used to return the condensed water to the boiler, where the cycle is then repeated; and 9. Pollution control devices are used to scrub the flue gas of NOx (selective catalytic reduction), particulate matter (electrostatic precipitators and/or fabric filters), and SO2 (calcium-based flue gas desulfurization units or lime spray dryers). Some power utilities are also equipped with activated carbon injection processes to capture mercury emissions; currently there are no full-scale CO2 capture methods in place. Liquid Fuel and Natural Gas Oxidation Converting petroleum to power requires evaporation and burning of a liquid fuel. Applications include diesel, rocket, and gas-turbine engines, oil-fired boilers and furnaces. In liquid fuel oxidation, the fuel is first vaporized and then combusted. Gas combustion may occur with or without flame, and flames are usually characterized as premixed or diffusion flames. In flame combustion, a reaction zone (flame) propagates through an air-fuel mixture where the hot combustion products are left behind the flame with temperature and pressure rising in the unburned fuel. In flameless combustion, rapid oxidation reactions occur throughout the fuel leading to very rapid combustion. The volumetric exothermicity that takes place in an engine is called autoignition. Premixed versus diffusion flames are characterized by the level of mixing that takes place between the fuel and oxidizing agent. A spark-ignition engine is an example in which the fuel and oxidizing agent are mixed prior to any combustion activity. On the other hand, within a diffusion flame the fuel is initially isolated from the oxidizing agent and the combustion reaction takes place simultaneous to mixing with flame propagation at the interface of the fuel and oxidant. There are clear distinctions between the oxidation processes of coal, petroleum, and gas and subsequent differences between the mechanisms of CO2 generation in each case. Understanding more thoroughly the nature by which CO2 is formed may lead to advancements in fuel-to-energy conversion processes that minimize its generation. The capture of CO2 in a traditional pulverized coal combustion process is termed postcombustion capture (PCC), since capture is taking place after the
1.4 Advanced Coal Conversion Processes
17
Table 1.7 Approximate efficiencies of various plants with and without CO2 capture (CC) [31] Plant type
Plant efficiency w/out CC (%)a
Plant efficiency w/CC (%)
Coal, subcritical Coal, supercritical Coal, ultrasupercritical NGCCb IGCCc
33–39 38–44 43–47 45–51 37–44
23–25 29–31 34–37 38–43 32–39
a
Plant efficiency is based upon the high heating value (HHV) of the fuel NGCC refers to a natural gas combined cycle power plant c IGCC refers to an integrated gasification combined cycle power plant b
combustion process. Another possibility is to modify the fuel-to-energy conversion process to maximize the concentration of CO2 as to minimize the work associated with its separation.
1.4 Advanced Coal Conversion Processes When fuel oxidation was first carried out for energy generation there was no intention to capture the CO2 generated from the process. Air being the primary source of fuel oxidation is approximately 78% N2 , 21% O2 , and 0.95% Ar by volume on a dry basis, i.e., excluding moisture content (plus trace amounts of CO2 , Ne, He, Kr, and Xe) [30]. The N2 is predominantly an inert gas throughout the combustion process, thereby diluting the CO2 generated in the flue gas stream and increasing the work required for CO2 separation. Table 1.7 shows the difference in the efficiency with and without CO2 capture for various plants. Advanced coal conversion processes6 are currently under development that reduce the work required for separation by creating CO2 -concentrated gas outlet streams. These include coal gasification, oxycombustion, and chemical looping combustion. These processes in fact, could be carried out on any fossil-based energy resource. Coal is primarily discussed since this is the most common energy resource available worldwide. Figure 1.6 shows the pathway of each advanced energy conversion process with the energy resource options as coal, biomass, waste, petroleum coke/residue or natural gas. Gasification Coal gasification is a process in which the oxidation of coal is kept at a minimum, with just enough exothermicity to provide the required energy for driving the gasification reactions. The heat is controlled through the control of air 6
Although not discussed specifically, another energy conversion option is electrochemical conversion in a direct carbon fuel cell. Challenges are associated with the accessibility of the oxidizer to the electrochemical reaction sites, but progress continues to be made in this field. [51, 52] Electrochemical conversion processes are described in more detail in Chapter 8, but are focused on CO2 reduction toward fuel synthesis, in which energy (renewable) is required as an input, rather than direct carbon (e.g., coal, biomass, etc.) oxidation toward energy production.
18
1 Introduction to Carbon Capture
Fig. 1.6 Schematic of primary options for CO2 capture from various hydrocarbon-based energy conversion processes
or more often, oxygen input into the gasifier. A limitation of gasification is the need for an air separation unit (ASU) for the generation of high-purity O2 as a feed gas to the gasifier. The gasification process suppresses the formation of water and instead produces primarily CO and hydrogen gas (H2 ). IGCC systems operate at high pressures (e.g., 500–700 psia) and require the oxidant stream to also be pressurized. Gasification takes place rapidly at temperatures above 1260◦ C, which is greater than the ash fusion temperature, allowing ash to become molten and separating easily from the gas. In addition to H2 and CO, CH4 is generated in small amounts and H2 S is also generated depending upon the extent of sulfur present in the energy resource. The hot and pressurized synthesis gas exits the gasifier and a particulate control device then removes particulate matter, after which steam is added to the fuel gas (also known as synthesis or syngas) to promote the conversion of H2 and CO2 , which is called the water gas shift reaction, i.e., CO + H2 O ↔ CO2 + H2
(1.5)
1.4 Advanced Coal Conversion Processes
19
Fig. 1.7 Detailed schematic of an integrated gasification combined cycle (IGCC) plant
and is exothermic by approximately 41 kJ/mol CO2 generated. The reaction is equilibrium-limited, leading to an increase in conversion as temperature decreases. The current industrial approach is to cool and clean the fuel stream before entering a high-temperature shift reactor at approximately 315–445◦ C.This step is sometimes followed by a low-temperature shift reactor that operates at approximately 200– 250◦ C. The equilibrium can be shifted using a catalytic metallic membrane reactor selective to the removal of H2 on the right hand side of Reaction (1.5). These types of reactors will be discussed in more detail in Chap. 5 on Membrane Technology. Shifting the equilibrium to optimize conversion is preferred, since this limits the cooling required of the gas stream. The concentration of CO2 in this process is substantially greater than in coal combustion making its separation from the fuel gas mixture easier. The capture of CO2 in an IGCC process is termed precombustion capture since the fuel combustion takes place after the capture process as demonstrated in Fig. 1.7. For electricity generation, the synthesis gas (largely hydrogen) is burned directly and then passed through a gas turbine for electricity generation. The heat recovered from this process is used to generate steam, which is passed through a steam turbine for additional electricity generation, resulting in a combined cycle. The efficiency of an IGCC plant is on the order of 37–44%, compared to a newer existing ultrasupercritical pulverized coal-fired power plant, which is on the order of 43–47%. It is important to recognize the competition that will likely exist between steam and gas processes as technologies are advanced (i.e., turbine technology) toward the handling of gas. Although the cost of electricity of a traditional coal combustion power plant is lower than that of an IGCC plant, with the inclusion of CO2 capture, the efficiency is higher (see Table 1.7) and hence the cost is less in the gasification case [33].
20
1 Introduction to Carbon Capture
Fig. 1.8 Schematic of fuel and chemical products produced from a synthesis gas via the FischerTropsch (FT) process
Fischer-Tropsch Process Rather than directly combusting the synthesis gas in an IGCC process, the syngas may also be converted to fuel and/or chemicals via Fischer-Tropsch (FT) synthesis. The original inventors of the process were Franz Fischer and Hans Tropsch, who worked at the Kaiser Wilhem Institute during the 1920s. The first commercialization took place in 1934, with the first industrial plant in operation in Germany in 1936, with annual production of over 1 million tons of FT liquid fuel at that time. The largest scale FT operation, based on a coal-to-liquid (CTL) conversion process, is operated by Sasol in South Africa, which is high in coal reserves and low in petroleum [34]. Due to oil embargos in opposition to Apartheid, South Africa advanced their CTL process in an attempt to gain independence from petroleum [35]. Figure 1.8 demonstrates the flexibility of the FT process in terms of the variety of petroleum-based products that can result. An important parameter for controlling the FT conversion and selectivity is the hydrogen-carbon ratio (H/C). The required H/C ratio for commercial production of hydrocarbon fuels, i.e., Diesel and gasoline is approximately 2 on a molar basis, while the ratio ranges from 1.3–1.9 for petroleum crude oil and 0.8 for typical bituminous coals [36]. A critical challenge for FT conversion is increasing the H/C ratio or the H2 /CO ratio. The hydrogen content in the syngas enhances the conversion efficiency toward the production of hydrocarbon products, with the additional hydrogen sourced from steam during the gasification step. Steam reacts with CO resulting in the watergas shift reaction (i.e., CO + H2 O ↔ CO2 + H2 ). The effect of the water-gas shift reaction can be varied depending on the type of FT catalyst, with the direction of the
1.4 Advanced Coal Conversion Processes
21
water-gas shift equilibrium dependent on the syngas composition [37]. Though the H/C or the H2 /CO ratio for the FT process is increased through the addition of steam, there is a subsequent efficiency penalty associated with the use of steam generated from the gasifier, in addition to the condensation of unused steam after the FT reactor. The future of coal-to-liquid processes may be limited due to: 1) its competition with existing “alternative liquid fuels,” such as biofuels, as well as 2) its inevitable result of net CO2 emissions since the H:C ratio is higher in liquids than in coal. Oxyfuel Combustion Sometimes referred to as oxycombustion, oxyfuel combustion involves an ASU to allow coal to be burned in an oxygen-enriched environment, which leads to minimal dilution of CO2 in the flue gas stream. The flue gas stream in an oxyfuel combustion process includes primarily CO2 and water vapor, which can be condensed out fairly easily. To prevent the temperatures in the boiler from getting too large, up to 70% of the flue gas stream is recycled back to dilute the oxygenenriched environment and maintain temperatures similar to conventional air-blown designs. Major challenges associated with the application or retrofit of oxyfuel combustion on an existing power plant is the cost of the ASU and potential leakage of air into the flue gas stream. It is important to keep in mind, however, that a typical stream from an ASU may contain approximately 3% N2 and 2% Ar depending upon the method used for separation. In general, major oxyfuel developers now see the primary application in new plants, or at existing plants that are “repowered” with modern and more efficient boilers. The following demonstration plants are currently in place: Vattenfall in Sweden [38], IHI in Japan [39], and Alstom Power in the U.S. [40], with 2 × 900, 1000, and 450-MW capacities, respectively. Although the cost of electricity is greater from an oxyfuel combustion plant compared to a coalfired plant with air, it has been shown that the cost may be lower with the inclusion of CO2 capture [41]. Chemical Looping Combustion The chemical looping combustion process involves the injection of metal oxides into the boiler that act as oxygen transporters (rather than air) for coal of natural gas oxidation, similar to the other processes previously discussed, minimizing the dilution of CO2 in the flue gas stream [42]. Within the chemical looping process, the solid oxygen carrier circulates between two fluidized bed reactors to transport oxygen from the combustion air to the fuel. Typical metal oxides include iron and nickel. Iron is low cost and nonhazardous making it an optimal choice. The metal oxide is reduced in a fuel reactor (i.e., reduction reactor) while oxidizing the fuel and is then transported into an air reactor (i.e., oxidation reactor) where it is reoxidized by air. The carrier particles are then transported back into the fuel reactor after passing through a cyclone for separation from the hot N2 and O2 gases. Benefits of this process are similar to those of oxyfuel combustion, i.e., the flue gas is not diluted with N2 and this process leads to lower NOx formation. However, it is important to note that the majority (∼70%) of the NOx formed is not from the N2 in the combustion air, but rather, from the surface functional groups on the coal itself. A simple schematic demonstrating the principle of chemical looping combustion is shown in Fig. 1.9. Additional details regarding these advanced coal conversion processes are available in the literature [43].
22
1 Introduction to Carbon Capture
Fig. 1.9 Schematic demonstrating the principle of chemical looping combustion
1.5
Minimum Thermodynamic Work for CO2 Separation
The first law of thermodynamics is concerned with the conservation of energy. The change in total energy of the system going from state 1 to state 2 is equal to the heat added to the system minus the work done, and can be expressed as, Q − W = E1→2 ,
(1.6)
in which Q and W may be positive or negative with the sign indicating the direction of energy flow. Examples of energies include internal energy, kinetic energy, and potential energy. The internal energy is comprised of the molecular energies within a given system, more specifically these include the energy contributions from the translational, vibrational, and rotational degrees of freedom within a molecule. Kinetic energy can be expressed as 21 mv2 , where m is the mass of a moving object and v is its velocity. Potential energy can be expressed as mgz, where m is the mass of a stationary object, g is the acceleration due to gravity, and z is elevation. Additional energies exist such as nuclear, electromagnetic, etc., but are not necessary for discussion in the context of CO2 capture. The second law of thermodynamics is concerned with entropy, which is generated during irreversible processes. Examples that include such irreversibilities are heat transfer across a temperature gradient, friction, mixing or stirring processes, and
1.5 Minimum Thermodynamic Work for CO2 Separation
23
Fig. 1.10 Schematic of carbon capture
many chemical reactions. Irreversible processes prevent a system from returning to its original state and additionally, they reduce the available work (i.e., exergy) of a given system. The minimum work required to separate CO2 from a gas mixture can be calculated based upon the combined first and second laws of thermodynamics. Figure 1.10 is a representation of the a generic CO2 separation process along with the general emissions source and capture technology with corresponding gas streams. Stream A represents a CO2 -inclusive gas stream mixture (not limited to a combustion exhaust) while stream B contains mostly CO2 depending upon the process purity, and stream C contains primarily the remainder of gas stream A. Ideally, stream B would be mostly (or all) CO2 and stream C would be very low (or zero) in CO2 . The minimum work required for separating CO2 from a gas mixture for an isothermal (constant temperature) and isobaric (constant pressure) process is equal to the negative of the difference in Gibbs free energy of the separated final states (streams B and C in Fig. 1.10) from the mixed initial state (stream A in Fig. 1.10). For an ideal gas (minimal gas species interactions), the Gibbs free energy change between stream A to streams B and C is: Wmin = Gsep = GB + GC − GA
(1.7)
For an ideal mixture, the partial molar Gibbs free energy for each gas is [44, 45]: � � ∂G pi ◦ = Gi + RT ln (1.8) ∂ni p such that pi is the partial pressure of the ith gas and p is total pressure. Therefore, the total Gibbs free energy of an ideal gas mixture is: � ∂G GTOTAL = ni (1.9) ∂ni i The minimum work required to go from state 1 to states 2 and 3 is associated with the free energy difference between the product and reactant states, which can be calculated by combining Eqs. (1.8) and (1.9) as: � �� � � � A−CO2 ◦ CO2 CO2 A−CO2 A−CO2 ◦ 2 GA = nCO + n G + n G + RT n ln y ln y CO2 A−CO2 A A A A A A � � � � �� B−CO2 ◦ CO2 CO2 B−CO2 B−CO2 ◦ 2 GB = nCO G + n G + RT n ln y ln y + n CO2 B−CO2 B B B B B B � � � � �� C−CO2 ◦ CO2 CO2 C−CO2 C−CO2 ◦ 2 GC = nCO G + n G + RT n ln y ln y + n , CO2 C−CO2 C C C C C C (1.10)
24
1 Introduction to Carbon Capture
Fig. 1.11 Minimum thermodynamic work for various coal or gas-to-electricity conversions
And thus the minimum work is: � � � � �� CO2 2 2 Wmin = RT nCO ln yBB−CO2 + nB−CO B ln yB B � � � � �� CO2 2 2 + RT nCO ln yCC−CO2 + nC−CO C ln yC C � � �� � � CO2 A−CO2 A−CO2 2 − RT nCO + n ln y ln y A A A A
(1.11)
where R is the ideal gas constant (8.314 J/mol K), T is the absolute temperature, yiCO2 is the mole fraction of CO2 in the gas mixture, i, such that i can represent either stream A, B, or C in Fig. 1.10, and yii−CO2 represents the remainder of a given gas stream A, B, or C. The quantity of greatest interest is the minimum work per mole of CO2 removed, that is, Wmin /(nCO2 ). For T = 25◦ C (298 K), the minimum work when beginning with coal flue gas at 12% CO2 , is 172 kJ/kg CO2 ; when beginning with air at 0.04% CO2 , is 497 kJ/kgCO2 , which is approximately a factor of three greater. The minimum work required for separation is highly dependent upon the starting concentration of CO2 in a given gas mixture. Figure 1.11 is a plot of the minimum work, Wmin at varying temperatures for CO2 separation as a function of the molar concentration of CO2 in the initial gas mixture. As the concentration of CO2 decreases, the minimum work required for separation increases. Additionally, an increase in temperature leads to an increase in the thermodynamic minimum work required for separation.
1.5 Minimum Thermodynamic Work for CO2 Separation
Example 1.1 Assume a 500-MW coal-fired power plant emits a flue gas containing 4 kmol CO2 /s, 5 kmol H2 O/s, 1 kmol O2 /s and 20 kmol N2 /s. What is the minimum work for the isothermal and isobaric separation of CO2 from the flue gas mixture for 90% capture and 98% purity at 45◦ C? Solution Given: n˙ CO2 = 4 kmol CO2 /s n˙ O2 = 1 kmol O2 /s Capture = 0.90
n˙ H2 O = 5 kmol H2 O/s n˙ N2 = 20 kmol N2 /s Purity = 0.98
Using Eq. (1.11), � � � � �� CO2 2 2 Wmin =RT nCO ln yBB−CO2 + nB−CO B ln yB B � � � � �� CO2 2 2 + RT nCO ln yCC−CO2 , + nC−CO C ln yC C � � �� � � CO2 2 2 − RT nCO + nA−CO ln yAA−CO2 A ln yA A where stream A is the flue gas mixture entering the separator, stream B at 98% purity contains 90% of the CO2 contained in stream A, and stream C contains the remaining 10% of the CO2 contained in stream A. Performing a mole balance on the separator yields: 2 Stream A: n˙ CO = 4 kmol CO2 /s A
2 n˙ A−CO = 26 kmol A − CO2 /s A
n˙ A = 30 kmol A gas/s yACO2
= 0.13
yAA−CO2 = 0.87
2 = (4 kmol CO2 /s)(0.90) = 3.6 kmol CO2 /s Stream B: n˙ CO B
n˙ B = (3.6 kmol CO2 /s)/(0.98) = 3.67 kmol B gas/s to ensure 98% purity 2 n˙ B−CO B
= 3.67 kmol B gas/s − 3.6 kmol CO2 gas/s = 0.07 kmol B − CO2 /s
yBCO2
= 0.98
yBB−CO2 = 0.02
2 = (4 kmol CO2 /s)(0.1) = 0.4 kmol CO2 /s Stream C: n˙ CO C
n˙ C = n˙ A − n˙ B = 26.33 kmol C gas/s from the system (separator) molar balance
25
26
1 Introduction to Carbon Capture
2 n˙ C−CO = 26.33 kmol C gas/s − 0.4 kmol CO2 gas/s C
= 25.93 kmol C − CO2 /s yCCO2 = 0.015
yCC−CO2 = 0.985
The flue gas is entering the separator at 45◦ C or 318 K. Substituting these values into Eq. (1.11) yields a thermodynamic minimum work of 24,756 kJ/s or 6.88 kJ/mol CO2 captured, with a CO2 capture rate of 3.6 kmol CO2 /s. 2nd-Law Efficiency Real systems will always use more energy than the thermodynamic minimum since the minimum is derived for a reversible isothermal process. The capture of CO2 or more specifically, separating CO2 from a gas mixture, takes significant work for dilute mixtures of CO2 and additional work for increased capture and purity. The separation process may depend upon current technologies such as absorption, adsorption, membranes, or some hybrid approach that has yet to be developed. Take for example absorption, which is outlined in Chap. 3; within this process blowers are used to drive a flue gas upward through a packed bed or spray tower, in which a liquid solvent is driven downward countercurrently using pump work. Additional work is required through the addition of heat for the solvent regeneration process, which drives the CO2 off in a pure stream for compression, which also takes work. Each of these processes have associated efficiencies based upon irreversibilities, such as friction, heat transfer, gas expansion, gas mixing, etc.; therefore, the actual work required for CO2 separation from a gas mixture deviates from the thermodynamic minimum work based upon the unit operations of the process and the extent of their individual inefficiencies. The ratio of the reversible or thermodynamic minimum work to the real work is termed the 2nd-Law efficiency [46] and is defined as: η2nd =
Wmin Wreal
(1.12)
The chemistry and physics of the underlying mechanisms of the various unit operations are discussed in the following chapters and analyzed in addition to the design and process in which the underlying chemistry and physical principles exist. Through the investigation of each of the steps in the given separation process there will be the opportunity to question and probe the actual work required of a given process and to assess the sensitivity of potentially tuning the related parameters to maximize the process’s 2nd-law efficiency. The 2nd-law efficiency has been investigated for a variety of gas scrubbing processes that span a wide range of concentrations. In Fig. 1.12, the 2nd-law efficiency is plotted as a function of decreasing concentration for 90% CO2 capture from coal-fired power and NGCC plants, as well as for varying levels of NOx , SOx and mercury (Hg) scrubbing. For all “actual” work calculations, the Integrated Environmental Control Module developed by Rubin et al. [47] from Carnegie Mellon University was used. In the case of the postcombustion capture of CO2 , SOx , NOx , and Hg it was assumed
1.6 Cost of CO2 Capture
27
Fig. 1.12 Plot showing the relationship between the 2nd-law efficiency and concentration of initial gas mixture
that low-sulfur Appalachian bituminous coal was burned in a 500-MW utility boiler. The capture technologies assumed for CO2 , SOx , NOx , and Hg consisted of amine scrubbing, wet flue gas desulfurization, selective catalytic reduction, and activated carbon injection, respectively. In the case of NGCC, precombustion separation based upon amine scrubbing is assumed for a 477-MW plant. It is interesting to note that the 2nd-law efficiency decreases with decreasing CO2 concentration [48]. This implies that there are still efficiencies to gain in SOx , NOx , and Hg capture since these processes do not include regeneration, yet they still follow the trend.
1.6
Cost of CO2 Capture
Costs of separation may be divided into technical versus non-technical costs. Examples of non-technical costs may include account depreciation and return on investment, interest rate, labor, etc. Costs associated with the technology include the cost of the equipment, chemicals used, power consumption to operate the separation process, power cost, etc. Additional factors that may affect the cost of CO2 capture include the choice of power plant and capture technology. For instance, will an existing plant be retrofitted or will the capture technology be applied to a new plant? The process design and variables associated with plant operation, such as plant
28
1 Introduction to Carbon Capture
Fig. 1.13 Sherwood plot of various gas scrubbing processes demonstrating the cost increase with decreasing concentration
capacity, capture rate, and CO2 concentration in and out will also influence costs. The system boundaries may influence the cost, for instance whether the capture technology is implemented on one facility or multiple plants or whether there will be energy resource integration to power the capture process, such as the implementation of natural gas, nuclear, wind, or solar. Whether a plant is a first-of-a-kind or nth plant may also influence the cost as technology is learned and advanced with time. The Sherwood plot [49] has proved to be a useful correlation for estimating the separation cost as a function of starting concentration. Figure 1.13 provides a Sherwood plot demonstrating the relationship between cost increase with increasingly dilute gas mixtures. Based upon the previous assumptions from the data plotted in Fig. 1.12, the Sherwood correlation is illustrated in Fig. 1.13. The concentration of each of these species in the flue gas is also listed in Table 1.8. It is clear that an increase in dilution in the flue gas is correlated with an increase in the unit cost of capture. The cost-to-concentration relationship for medium-sulfur coal compared to the low-sulfur coal, i.e., 1270 versus 399 ppm, is also consistent with this trend. Similarly, amine scrubbing for a 477-MW NGCC power plant generating approximately 3.7 mol% CO2 follows the trend in that it is higher in cost compared to PCC in which the CO2 concentration is approximately 12 mol% CO2 . Lightfoot and Cockrem [49] described this concept well in a publication titled, What Are Dilute Solutions? Their
1.6 Cost of CO2 Capture
29
Table 1.8 Cost and scale of various coal and natural gas oxidation processes Process
Price ($/kg)
Concentration (mole fraction)
Emissions (kg/day)
Cost (1000s $/day)
CO2 –PCC CO2 –NGCC SOx (MS) SOx (LS) NOx Hg
0.045 0.059 0.66 2.1 1.1 22000
0.121 0.0373 0.00127 0.000399 (399 ppm) 0.000387 (387 ppm) 5 × 10⁻⁹ (5 ppb)
8.59 × 10⁶ 3.01 × 10⁶ 8.94 × 10⁴ 2.32 × 10⁴ 1.11 × 10⁴ 0.951
392 178 59.6 50.4 12.5 21.6
assessment was that the “recovery of potentially valuable solutes from dilute solution is dominated by the costs of processing large masses of unwanted materials.” It is interesting to consider DAC in this context as CO2 is present in the air at similar concentrations of NOx in flue gas. However, the scale of the CO2 emissions compared to NOx as shown in Table 1.8, makes this approach to CO2 mitigation less desirable than capture from more concentrated sources. Similar to the results of Table 1.8, recent investigations [48, 50] have concluded that cost estimates may be as high as $1000 per ton of CO2 for DAC. Defining the Cost of CO2 Avoided and Captured Imagine that a CO2 capture system is installed at a fossil-fuel power plant, and that the energy required to operate the capture system is provided by fossil fuels. In principle, nothing prevents the capture system from emitting more CO2 than it captures. Such a system would be counterproductive, however. One needs a vocabulary that distinguishes the gross CO2 removed by a capture device and the net CO2 that does not enter the atmosphere, which is the gross CO2 removed minus the CO2 emitted by the capture system itself. The concepts of gross and net CO2 prevented from entering the atmosphere are called “captured CO2 ” and “avoided CO2 .” Avoided CO2 is always less than captured CO2 since any capture system will emit some CO2 . Equivalently, the cost of avoided CO2 (in dollars per ton of CO2 ) is always greater than the cost of CO2 captured. Figure 1.14 provides a schematic demonstrating the differences between CO2 captured versus CO2 avoided for a typical power plant application, assuming that the capture plant captures and stores 90% of the total generated CO2 emissions and that some CO2 emissions will be associated with the energy needed to operate the capture process itself. Thus, the cost of CO2 avoided is the cost of delivering a unit of useful product (in this case, electricity) while avoiding a ton of CO2 emissions to the atmosphere. Avoidance costs should always include the cost of CO2 compression, transport and storage since “avoided” means not emitted into the atmosphere. The cost of CO2 avoided for a power plant, Cavo , is calculated on a net kWh basis by the equation, $
/kWh cap − $ /kWh ref
(1.13) Cavo $/ton CO2 = CO CO2 / 2/ kWh ref − kWh cap
such that $ /kWh ref and $ /kWh cap represent the cost per net kWh of electricity
produced by the reference and capture plant, respectively and CO2 /kWh ref and
30
1 Introduction to Carbon Capture
Fig. 1.14 Schematic demonstrating the difference in CO2 captured versus CO2 avoided for a pointsource capture scenario. Here, the capture plant produces the same useful product output as the reference plant, so additional capacity is needed to operate the capture system. For a power plant all values are typically normalized on the net kWh generated
CO
/kWh cap represent the tons of CO2 emitted to the atmosphere per net kWh of electricity produced by the reference and capture plant, respectively. In contrast, the cost per ton of CO2 captured, Ccap , can be calculated by the equation, $
/kWh cap − $ /kWh ref
Ccap $/tonCO2 = (1.14) CO2 / kWh cap 2
such that the numerator again represents the incremental cost of the capture system, while the denominator is the quantity of CO2 captured, with all values again normalized on the net plant output. The key difference from Eq. (1.13) is that the capture cost does not include the cost of energy to operate the capture system; nor does it typically include the costs of CO2 transport and storage. Thus, the cost per ton captured is always less than the cost per ton avoided. For a co-generation power plant that produces both electricity and heat, costs and emissions can be normalized on the total equivalent thermal energy output (in kJ). For other types of point sources, such as an oil refinery stack or a cement plant, costs and emissions would be normalized on the relevant measure of useful output (e.g., barrels of oil or tons of cement) when calculating the cost of CO2 avoided or captured. Cost for Direct Air Capture For CO2 removed directly from the atmosphere (a concept being developed, but not yet practiced on a commercial scale) there is no reference plant or specific product associated with the capture system, as with point sources. Nonetheless, the concepts of gross and net CO2 removal from the
References
31
Fig. 1.15 Schematic demonstrating the difference between CO2 captured versus CO2 generated for a DAC scenario
atmosphere are analogous to those associated with emission prevention. The two analogous concepts are again called CO2 captured (gross) and CO2 avoided (net). The amount and cost of CO2 captured in the case of DAC is defined in the same way as the previous method, namely the incremental cost of the capture system divided by the amount of CO2 captured. Thus, $
/yr
(1.15) Ccap,DAC $/ton CO2 = CO DAC 2/ yr DAC where the numerator is the levelized annual cost of the capture system and the denominator is the annual average amount captured. Figure 1.15 shows a schematic demonstrating the difference between avoided versus captured. In the case of DAC there is only a capture plant since the CO2 emissions are captured directly from air, compressed, transported, and stored (or sequestered). Similar to the point source definition, however, allowance is made for the generation of emissions associated with the purchased energy resource(s) used to fuel the DAC plant and the energy required to capture a given number of tons of CO2 from the air. Effectively, the cost of CO2 avoided is the cost of the capture plant (plus transport and storage costs) divided by the net amount captured, rather than the total amount. The cost of CO2 avoided, Cavo,DAC , in the case of DAC can be calculated by, $
$
/yr DAC /yr
Cavo,DAC $/ton CO2 = CO = CO DAC (1.16) CO2 / 2/ 2/ − yr DAC yr gen yr net such that the numerator represents the total annualized cost of building and operating the DAC plant and the denominator represents the net number of tons captured per year from the DAC plant. Energy to operate the plant typically will be some combination of electricity and heat sourced by fossil fuels or renewables.
References 1. Image courtesy of Yangyang Liu, using a JEOL JSM 5600 Scanning Electron Microscope, (2009) School of Earth Sciences, Stanford University
32
1 Introduction to Carbon Capture
2. EIA (2011) Annual Energy Outlook Energy Information Administration. U.S. Department of Energy, Washington, DC 3. Solomon S, Plattner GK, Knutti R, Friedlingstein P (2009) Irreversible climate change due to carbon dioxide emissions. Proc Natl Acad Sci U S A 106(6):1704–1709 4. (a) Ramanathan V, Feng Y (2008) On avoiding dangerous anthropogenic interference with the climate system: Formidable challenges ahead. Proc Natl Acad Sci U S A 105(38):14245; (b) Wigley TML (2005) The climate change commitment. Science 307(5716):1766; (c) Friedlingstein P, Solomon S (2005) Contributions of past and present human generations to committed warming caused by carbon dioxide. Proc Natl Acad Sci U S A 102(31):10832 5. (a) Matthews HD, Weaver AJ (2010) Committed climate warming. Nat Geosci 3(3):142–143; (b) Matthews HD, Caldeira K (2008) Stabilizing climate requires near-zero emissions. Geophys Res Lett 35(4):L04705 6. Ha-Duong M, Grubb MJ, Hourcade JC (1997) Influence of socioeconomic inertia and uncertainty on optimal CO2 -emission abatement. Nature 390(6657):270–273 7. Matthews HD, Gillett NP, Stott PA, Zickfeld K (2009) The proportionality of global warming to cumulative carbon emissions. Nature 459(7248):829–832 8. Van Der Werf GR, Morton DC, DeFries RS, Olivier JGJ, Kasibhatla PS, Jackson RB, Collatz GJ, Randerson JT (2009) CO2 emissions from forest loss. Nature Geosci 2(11):737–738 9. (a) Denman KL (2007) In: Climate Change 2007: the physical basis. contribution of working group i to the fourth assessment report of the intergovernmental panel on climate change. Cambridge University Press, Cambridge; (b) Gibbs HK, Herold M (2007) Tropical deforestation and greenhouse gas emissions. Environ Res Lett 2:045021; (c) Schrope M (2009) When money grows on trees. Nat Rep Climate Change 3:101–103 10. Meinshausen M, Meinshausen N, Hare W, Raper SCB, Frieler K, Knutti R, Frame DJ, Allen MR (2009) Greenhouse-gas emission targets for limiting global warming to 2◦ C. Nature 458(7242):1158–1162 11. (a) Houghton JT, Ding Y, Griggs DJ, Noguer M, Van der Linden PJ, Dai X, Maskell K, Johnson CA (2001) IPCC, Climate Change 2001: The scientific basis. contribution of working group I to the Third assessment report of the Intergovernmental Panel on climate change. Cambridge University Press, Cambridge; (b) Houghton JT (eds) (1996) Climate change 1995: the science of climate change. Cambridge University Press, Cambridge 12. Best D, Mulyana R, Jacobs B, Iskandar UP, Beck B (2011) Status of CCS development in Indonesia. Energy Procedia 4:6152–6156 13. Srivastava RK, Hall RE, Khan S, Culligan K, Lani BW (2005) Nitrogen oxides emission control options for coal-fired electric utility boilers. J Air Waste Manage Assoc 55(9):1367–1388 14. Amrollahi Z, Ertesvag IS, Bolland O (2011) Thermodynamic analysis on post-combustion CO2 capture of natural-gas-fired power plant. Int J Greenh Gas Control 5:422–426 15. (a) Marland G, Boden TA, Andres RJ (2006) Global, Regional, and National Annual CO2 Emissions from Fossil-Fuel Burning, Cement Manufacture, and Gas Flaring: 1751–2003. U.S. Department of Energy (DOE), Carbon Dioxide Information Analysis Center, Environmental Sciences Division, Oak Ridge; (b) Metz B (2005) IPCC special report on carbon dioxide capture and storage. Cambridge University Press, Cambridge, p 431; (c) IEAGHG (2008) Global IEA GHG CO2 Emissions Database. IEA Greenhouse Gas R&D Programme, Cheltenham 16. Rubin ES, Mantripragada H, Marks A, Versteeg P, Kitchin J (2011) The outlook for improved carbon capture technology. Prog Energy Combust Sci (in press) 17. Kuuskraa VA (2010) Challenges of implementing large-scale CO2 enhanced oil recovery with CO2 capture and storage In: symposium on the role of enhanced oil recovery in accelerating the deployment of carbon capture and storage. Advanced Resources International Inc., Cambridge 18. Moniz EJ, Tinker SW (2010) Role of enhanced oil recovery in accelerating the deployment of carbon capture and sequestration; an MIT Energy Initiative and Bureau of Economic Geology at UT Austin Symposium July 23, 2010 19. (a) Kovscek AR, Cakici MD (2005) Geologic storage of carbon dioxide and enhanced oil recovery. II. Cooptimization of storage and recovery. Energy Convers Manag 46(11–12):1941– 1956; (b) Jessen K, Kovscek AR, Orr FM (2005) Increasing CO2 storage in oil recovery. Energy Convers Manag 46(2):293–311
References
33
20. (a) Ross HE, Hagin P, Zoback MD (2009) CO2 storage and enhanced coalbed methane recovery: reservoir characterization and fluid flow simulations of the Big George coal, Powder River Basin, Wyoming, USA. Int J Greenh Gas Con 3(6):773–786; (b) Jessen K, Tang GQ, Kovscek AR (2008) Laboratory and simulation investigation of enhanced coalbed methane recovery by gas injection. Transport Porous Med 73(2):141–159 21. (a) Liu Y, Wilcox J (2011) CO2 adsorption on carbon models of organic constituents of gas shale and coal. Environ Sci Technol 45:809–814; (b) Liu Y, Wilcox J (2012) Effects of surface heterogeneity in the adsorption of CO2 in microporous carbons. Environ Sci Technol 46:1940– 1947; (c) Nuttall BC, Eble CF (2003) Analysis of Devonian black shales in Kentucky for potential carbon dioxide sequestration and enhanced natural gas production; NASA Center for AeroSpace Information, 7121 Standard Dr Hanover, Maryland, pp 21076–1320; (d) Vermylen J, Hagin P, Zoback M (2008) In: Feasibility assessment of CO2 sequestration and enhanced recovery in gas shale reservoirs. Americal Geophysical Union, p 990 22. Bottoms R (1930) Process for separating acid gases, U.S. Patent Office, Girdler Corporation, 1783901 23. Riesenfeld FC, Frazier HD (1952) Separation of Acidic constituents, U.S. Patent Office, Fluor Corporation, Ltd., 2600328 24. Bhown AB, Freeman BC (2011) Analysis and status of post-combustion Carbon Dioxide capture technologies. Environ Sci Technol 45:8624–8632 25. (a) http://fossil.energy.gov/programs/sequestration; (b) Carbon capture and storage, assessing the economics. McKinsey and Company, London, (2008) 26. Parson EA, Keith DW (1998) Fossil fuels without CO2 emissions. Science 282(5391):1053 27. Bachu S, Bonijoly D, Bradshaw J, Burruss R, Holloway S, Christensen NP, Mathiassen OM (2007) CO2 storage capacity estimation: Methodology and gaps. Int J Greenh Gas Control 1(4):430–443 28. Pacala S, Socolow R (2004) Stabilization wedges: Solving the climate problem for the next 50 years with current technologies. Sci 305(5686):968–972 29. van Krevelen DW (1993) Coal: typology, physics, chemistry, constitution, 3rd edn. Elsevier, Amsterdam 30. (a) Vejahati F, Xu Z, Gupta R (2010) Trace elements in coal: associations with coal and minerals and their behavior during coal utilization.-A review Fuel 89(4):904–911; (b) Senior C, Otten BV, Wendt JOL, Sarofim A (2010) Modeling the behavior of selenium in PulverizedCoal Combustion systems. Combust Flame 157(11):2095–2105; (c) Wilcox J (2011) A kinetic investigation of unimolecular reactions involving trace metals at post-combustion flue gas conditions. Environ Chem 8(2):207–212; (d) Wilcox J (2009) A kinetic investigation of hightemperature mercury oxidation by chlorine. J Phys Chem A 113(24):6633–6639; (e) Wilcox J, Rupp E, Ying SC, Lim D.-H., Negreira AS, Kirchofer A, Feng F, Lee K (2012) Mercury adsorption and oxidation in coal and gasification processes. Int J Coal Geol 90–91:4–20 31. Frayne C (2002) Boiler water treatment: principles and practice. Chemical Pub Co, New York 32. (a) Chen C, Rubin ES (2009) CO2 control technology effects on IGCC plant performance and cost. Energy Policy 37(3):915–924; (b) Rubin ES, Chen C, Rao AB (2007) Cost and performance of fossil fuel power plants with CO2 capture and storage. Energy Policy 35(9):4444–4454; (c) van den Broek M, Hoefnagels R, Rubin E, Turkenburg W, Faaij A (2009) Effects of technological learning on future cost and performance of power plants with CO2 capture. Prog Energy Combust Sci 35(6):457–480; (d) Yeh S, Rubin ES (2007) A centurial history of technological change and learning curves for pulverized coal-fired utility boilers. Energy 32(10):1996–2005; (e) Zhai H, Rubin ES (2010) Performance and cost of wet and dry cooling systems for pulverized coal power plants with and without carbon capture and storage. Energy Policy 38(10):5653–5660 33. White CM, Strazisar BR, Granite EJ, Hoffman JS, Pennline HW (2003) Separation and capture of CO2 from large stationary sources and sequestration in geological formations: coalbeds and deep saline aquifers. J Air Waste Manage Assoc 53(6):645–715 34. Leckel D (2009) Diesel production from Fischer-Tropsch: the past, the present, and new concepts. Energy Fuels 23(5):2342–2358
34
1 Introduction to Carbon Capture
35. Conlon P (1985) The Sasol coal liquefaction plants: economic implications and impact on the south Africa’s ability to withstand an oil cut-off. United Nations, New York, p 59 36. Williams RH, Larson ED (2003) A comparison of direct and indirect liquefaction technologies for making fluid fuels from coal. Energy Sustain Dev 7(4):103–129 37. (a) Steynberg AP (2004) Introduction to fischer-tropsch technology. Stud Surf Sci Catal 152:1– 63; (b) Dry ME (2004) Chemical concepts used for engineering purposes. Stud Surf Sci Catal 152:196–257 38. Birkestad H (2002) Separation and compression of CO2 in an O2 /CO2 -fired power plant. Department of Energy Conversion, Thesis (MSc), Chalmers University of Technology, Gothenburg 39. Okawa M, Kimura N, Kiga T, Takano S, Arai K, Kato M (1997) Trial design for a CO2 recovery power plant by burning pulverized coal in O2 /CO2 . Energy Convers Manag 38:123–127 40. Marion J, Nsakala N, Bozzuto C, Liljedahl G, Palkes M, Vogel D, Gupta JC, Guha M, Johnson H, Plasynski S (2001) In: Engineering feasibility of CO2 capture on an existing US Coal-Fired Power Plant. 26th International Conference on Coal Utilization & Fuel Systems, Clearwater 41. Singh D, Croiset E, Douglas PL, Douglas MA (2003) Techno-economic study of CO2 capture from an existing coal-fired power plant: MEA scrubbing vs. O2 /CO2 recycle combustion. Energy Convers Manag 44(19):3073–3091 42. (a) Fan LS (2010) Chemical looping systems for fossil energy conversions. Wiley Online Library, Hoboken; (b) Li F, Fan LS (2008) Clean coal conversion processes – progress and challenges. Energy Environ Sci 1(2):248–267 43. (a) Wall TF (2007) Combustion processes for carbon capture. P Combust Inst 31(1):31–47; (b) Rackley SA (2010) Carbon capture and storage. Butterworth-Heinemann, Burlington, p 392; (c) Folger P (2010) In: Carbon capture and sequestration (CCS). BiblioGov 44. Gaskell D (1995) Introduction to the thermodynamics of materials. Taylor & Francis, Washington D.C., pp. 219–264 45. House KZ, Harvey CF, Aziz MJ, Schrag DP (2009) The energy penalty of post-combustion CO2 capture & storage and its implications for retrofitting the U.S. installed base. Energy Environ Sci 2:193–205 46. Turns SR (2006) Thermodynamics: concepts and applications. Cambridge University Press, Cambridge, p 736 47. Rubin ES Integrated Environemental Control Model, Version 6.2.4. http://www.cmu.edu/epp/ iecm/index.html 48. House KZ, Baclig AC, Ranjan M, van Nierop EA, Wilcox J, Herzog HJ (2011) Economic and energetic analysis of capturing CO2 from ambient air. Proc NatlAcad Sci U SA 108(51):20428– 20433 49. Lightfoot EN, Cockrem MCM (1987) What are dilute solutions? Separ Sci Technol 22(2):165– 189 50. Direct Air Capture of CO2 with Chemicals (2011) The American Physical Society: College Park, MD. http://www.aps.org/policy/reports/popareports/loader.cfm?csModule=security/ getfile&PageID=244407, Accessed 10 June 2011 51. Gür TM (2010) Mechanistic modes for solid carbon conversion in high temperature fuel cells. J Electrochem Soc 157(5):B751–B759 52. Lee AC, Mitchell RE, Gür TM (2009) Thermodynamic analysis of gasification-driven direct carbon fuel cells. J Power Sources 194(2):774–785
http://www.springer.com/978-1-4614-2214-3