Excel Guide to Finite Mathematics and Applied Calculus, 2nd ed., Revathi
Narasimhan is designed as a technology supple- ment for the following textbooks
:.
Preface The use of spreadsheets in a course designed primarily for business and social science majors can enhance the understanding of the underlying mathematical concepts. In addition, the widespread use of spreadsheets in these fields makes it a natural vehicle for students to experiment with the ideas they have learned. Prior knowledge of Excel is not assumed for use of this supplement. Students are provided enough introductory material to get started, and specialized instructions are given as needed. Excel Guide to Finite Mathematics and Applied Calculus, 2nd ed., Revathi Narasimhan is designed as a technology supplement for the following textbooks: Mathematical Applications, 7th ed. Harshbarger-Reynolds Calculus: An Applied Approach, 6th ed. Brief Calculus: An Applied Approach, 6th ed Brief Calculus: An Applied Worktext Larson-Edwards Applied Calculus, 3rd ed. Brief Applied Calculus, 3rd ed. Berresford-Rockett Calculus with Finite Mathematics Berresford-Rockett Finite Mathematics Berresford-Rockett
Software Requirements This manual was written for Excel 2000, although it can be used with Excel 97 with no changes. Older versions of Excel, such as Excel 95 or Excel 5.0 can also be used, but the graphing directions and screens will be somewhat different. Screenshots use Excel 2000. All instructions in the manual use only the native capabilities of Excel. There is no need for external macros. The only add-in that is required is Solver, which is used for the linear programming and optimization sections. Solver comes with the standard distribution of Excel. To check if Solver is installed, click on the Tools menu and see if Solver appears in the full menu. If it does, you are all set. If not, you will have to add it in. To add it in, click on Tools > Add-ins. If a box for Solver appears, check it, and click OK. If Solver does not appear in the add-ins list, it must be installed through the setup program for Excel. See your systems administrator for further details.
iii
Contents
Contents 1
2
3
4
5
6 7
8
Getting Started With Excel. . . . . . . . . . . . . . . . . . . . . . . . . . . . . . . . . . . . . . . . . . . . 1 Data and Cell References . . . . . . . . . . . . . . . . . . . . . . . . . . . . . . . . . . . . . . . . . . . 2 Formatting Cells . . . . . . . . . . . . . . . . . . . . . . . . . . . . . . . . . . . . . . . . . . . . . . . . . . 2 Formulas . . . . . . . . . . . . . . . . . . . . . . . . . . . . . . . . . . . . . . . . . . . . . . . . . . . . . . . . 3 Copying and Pasting . . . . . . . . . . . . . . . . . . . . . . . . . . . . . . . . . . . . . . . . . . . . . . . 4 File Operations . . . . . . . . . . . . . . . . . . . . . . . . . . . . . . . . . . . . . . . . . . . . . . . . . . . 6 Tables in Excel . . . . . . . . . . . . . . . . . . . . . . . . . . . . . . . . . . . . . . . . . . . . . . . . . . . 6 Some Common Errors. . . . . . . . . . . . . . . . . . . . . . . . . . . . . . . . . . . . . . . . . . . . . . 9 Graphs of Functions . . . . . . . . . . . . . . . . . . . . . . . . . . . . . . . . . . . . . . . . . . . . . . . . 10 Graphing a Single Function . . . . . . . . . . . . . . . . . . . . . . . . . . . . . . . . . . . . . . . . 10 Graphing More than One Function . . . . . . . . . . . . . . . . . . . . . . . . . . . . . . . . . . . 13 Graphing Options . . . . . . . . . . . . . . . . . . . . . . . . . . . . . . . . . . . . . . . . . . . . . . . . 14 Graphing Discontinuous Functions. . . . . . . . . . . . . . . . . . . . . . . . . . . . . . . . . . . 15 Plotting Functions using Cases . . . . . . . . . . . . . . . . . . . . . . . . . . . . . . . . . . . . . . 16 Linear and Polynomial Regression . . . . . . . . . . . . . . . . . . . . . . . . . . . . . . . . . . . . 18 Linear Regression using Chart Wizard . . . . . . . . . . . . . . . . . . . . . . . . . . . . . . . . 18 Linear Regression using Excel Functions. . . . . . . . . . . . . . . . . . . . . . . . . . . . . . 21 Comparison of Predicted Data with Actual Data . . . . . . . . . . . . . . . . . . . . . . . . 22 Forecasting using Linear Regression . . . . . . . . . . . . . . . . . . . . . . . . . . . . . . . . . 22 Polynomial Regression . . . . . . . . . . . . . . . . . . . . . . . . . . . . . . . . . . . . . . . . . . . . 23 Finding Zeros of a Function with Goal Seek. . . . . . . . . . . . . . . . . . . . . . . . . . . . . 27 Finding the X-intercept of a Line . . . . . . . . . . . . . . . . . . . . . . . . . . . . . . . . . . . . 27 Finding Zeros of a Quadratic Function . . . . . . . . . . . . . . . . . . . . . . . . . . . . . . . . 28 Break-even Problems using Goal Seek. . . . . . . . . . . . . . . . . . . . . . . . . . . . . . . . 31 Matrices . . . . . . . . . . . . . . . . . . . . . . . . . . . . . . . . . . . . . . . . . . . . . . . . . . . . . . . . . . 33 Adding and Multiplying Matrices. . . . . . . . . . . . . . . . . . . . . . . . . . . . . . . . . . . . 33 Multiplication of Matrices . . . . . . . . . . . . . . . . . . . . . . . . . . . . . . . . . . . . . . . . . 34 Inverse of a Matrix . . . . . . . . . . . . . . . . . . . . . . . . . . . . . . . . . . . . . . . . . . . . . . . 36 Solving Systems of Equations using Inverses. . . . . . . . . . . . . . . . . . . . . . . . . . . 37 Leontief Input-Output Model . . . . . . . . . . . . . . . . . . . . . . . . . . . . . . . . . . . . . . . 40 Linear Programming using Solver. . . . . . . . . . . . . . . . . . . . . . . . . . . . . . . . . . . . . 41 Maximization Problem using Solver. . . . . . . . . . . . . . . . . . . . . . . . . . . . . . . . . . 41 Minimization Problem using Solver . . . . . . . . . . . . . . . . . . . . . . . . . . . . . . . . . . 46 Mathematics of Finance . . . . . . . . . . . . . . . . . . . . . . . . . . . . . . . . . . . . . . . . . . . . . 50 Simple Interest . . . . . . . . . . . . . . . . . . . . . . . . . . . . . . . . . . . . . . . . . . . . . . . . . . 50 Compounded Interest Using Tables . . . . . . . . . . . . . . . . . . . . . . . . . . . . . . . . . . 51 Compounded Interest Using Excel Functions. . . . . . . . . . . . . . . . . . . . . . . . . . . 53 Future Value of Ordinary Annuities and Annuities Due . . . . . . . . . . . . . . . . . . 54 Calculating Payment for Annuities and Sinking Funds . . . . . . . . . . . . . . . . . . . 56 Present Value of Annuities . . . . . . . . . . . . . . . . . . . . . . . . . . . . . . . . . . . . . . . . . 58 Loans and Amortization . . . . . . . . . . . . . . . . . . . . . . . . . . . . . . . . . . . . . . . . . . . 59 Probability and Statistics . . . . . . . . . . . . . . . . . . . . . . . . . . . . . . . . . . . . . . . . . . . . 63 Binomial Probability . . . . . . . . . . . . . . . . . . . . . . . . . . . . . . . . . . . . . . . . . . . . . . 63 Descriptive Statistics. . . . . . . . . . . . . . . . . . . . . . . . . . . . . . . . . . . . . . . . . . . . . . 65 Normal Probabilities . . . . . . . . . . . . . . . . . . . . . . . . . . . . . . . . . . . . . . . . . . . . . . 70
Copyright © Houghton Mifflin Company. All rights reserved.
xi
xii
9
10 11 12 13
14 15 16 17
Excel Guide for Finite Math and Applied Calculus
Limits and Derivatives. . . . . . . . . . . . . . . . . . . . . . . . . . . . . . . . . . . . . . . . . . . . . . . 73 Numerical Investigation of Limits. . . . . . . . . . . . . . . . . . . . . . . . . . . . . . . . . . . . 73 Numerical Investigation of Derivatives. . . . . . . . . . . . . . . . . . . . . . . . . . . . . . . . 75 Derivatives and Rates of Change. . . . . . . . . . . . . . . . . . . . . . . . . . . . . . . . . . . . . 76 Graphs of Functions and their Derivatives . . . . . . . . . . . . . . . . . . . . . . . . . . . . . . 78 A Function and its First Derivative . . . . . . . . . . . . . . . . . . . . . . . . . . . . . . . . . . . 78 A Function and its Second Derivative. . . . . . . . . . . . . . . . . . . . . . . . . . . . . . . . . 80 Optimization in One Variable Using Solver . . . . . . . . . . . . . . . . . . . . . . . . . . . . . 82 Exponential, Logarithmic and Trigonometric Functions. . . . . . . . . . . . . . . . . . . 87 Graphs of Exponential, Log and Trig Functions . . . . . . . . . . . . . . . . . . . . . . . . . 87 Solving Equations with Goal Seek . . . . . . . . . . . . . . . . . . . . . . . . . . . . . . . . . . . 90 Integration . . . . . . . . . . . . . . . . . . . . . . . . . . . . . . . . . . . . . . . . . . . . . . . . . . . . . . . . 92 Approximating Area using Rectangles - Left Endpoint . . . . . . . . . . . . . . . . . . . 92 Approximating Area using Rectangles - Midpoint . . . . . . . . . . . . . . . . . . . . . . . 93 Numerical Integration - Trapezoidal Rule. . . . . . . . . . . . . . . . . . . . . . . . . . . . . . 95 Numerical Integration - Simpson’s Rule . . . . . . . . . . . . . . . . . . . . . . . . . . . . . . . 97 Graphs of Functions of Two Variables . . . . . . . . . . . . . . . . . . . . . . . . . . . . . . . . 100 Constrained Optimization and Lagrange Multipliers . . . . . . . . . . . . . . . . . . . . 104 Taylor Series . . . . . . . . . . . . . . . . . . . . . . . . . . . . . . . . . . . . . . . . . . . . . . . . . . . . . . 109 Newton’s Method . . . . . . . . . . . . . . . . . . . . . . . . . . . . . . . . . . . . . . . . . . . . . . . . . . 112 Finding a Zero of a Function . . . . . . . . . . . . . . . . . . . . . . . . . . . . . . . . . . . . . . . 112 Finding Intersection of Two Functions and Stopping Criteria . . . . . . . . . . . . . 114
Copyright © Houghton Mifflin Company. All rights reserved.
Preface
vii
Correlation table for Applied Calculus, 3rd ed. by Berresford-Rockett
Chapter in Excel Guide
Chapter in Text
Comments
1 Getting Started
N/A
Excel material needed for all subsequent sections
2 Graphs of Functions
Chapter 1
Excel material needed for all subsequent sections
3 Linear and Polynomial Regression
Section 7.4, but see comment on right
Needed for modeling exercises appearing in many chapters
4 Finding Zeros with Goal Seek
Section 1.3, 1.4
Break-even problems; solving equations
8 Probability and Statistics
Sections 11.1,11.4
9 Limits and Derivatives
Sections 2.1,2.2
10 Graphs of Functions and their Derivatives
Sections 3.1,3.2
11 Optimization in One Variable using Solver
Sections 3.3-3.5
12 Exponential, Log and Trig Functions
Chapters 4 and 8
13 Integration
Sections 5.3, 5.4, and 6.4
14 Graphs of Functions of Two Variables
Section 7.1
15 Constrained Optimization
Section 7.5
16 Taylor Series
Sections 10.2,10.3
17 Newton’s Method
Section 10.4
Copyright © Houghton Mifflin Company. All rights reserved.
viii
Excel Guide for Finite Math and Applied Calculus
Correlation table for Brief Applied Calculus, 3rd ed., by Berresford-Rockett
Chapter in Text
Chapter in Excel Guide
Comments
1 Getting Started
N/A
Excel material needed for all subsequent sections
2 Graphs of Functions
Chapter 1
Excel material needed for all subsequent sections
3 Linear and Polynomial Regression
Section 7.4, but see comment on right
Needed for modeling exercises appearing in many chapters
4 Finding Zeros with Goal Seek
Section 1.3, 1.4
Break-even problems; solving equations
9 Limits and Derivatives
Sections 2.1,2.2
10 Graphs of Functions and their Derivatives
Sections 3.1,3.2
11 Optimization in One Variable using Solver
Sections 3.3-3.5
12 Exponential, Log and Trig Functions
Chapters 4 and 8
13 Integration
Sections 5.3, 5.4, and 6.4
14 Graphs of Functions of Two Variables
Section 7.1
15 Constrained Optimization
Section 7.5
Copyright © Houghton Mifflin Company. All rights reserved.
Preface
ix
Correlation table for Calculus with Finite Mathematics, by Berresford-Rockett Chapter in Excel Guide
Chapter(s) in Text
1 Getting Started
N/A
Excel material needed for all subsequent sections
2 Graphs of Functions
Chapter 0
Excel material needed for all subsequent sections
3 Linear and Polynomial Regression
Section 11.4, but see comment at right
Needed for modeling exercises appearing in many chapters
4 Finding Zeros with Goal Seek
Section 0.3, 0.4
Intercepts and break-even problems; solving equations
5 Matrices
Chapter 2
Can also be used for Markov chains
6 Linear Programming using Solver
Chapter 3
7 Mathematics of Finance
Chapter 1
8 Probability and Statistics
Section 4.4, Chapter 5
9 Limits and Derivatives
Sections 6.1,6.2
10 Graphs of Functions and their Derivatives
Sections 7.1,7.2
11 Optimization in One Variable using Solver
Sections 7.3-7.5
12 Exponential, Log and Trig Functions
Chapter 8
13 Integration
Sections 9.3, 9.4, and 10.4
14 Graphs of Functions of Two Variables
Section 11.1
15 Constrained Optimization
Section 11.5
Copyright © Houghton Mifflin Company. All rights reserved.
Comments
x
Excel Guide for Finite Math and Applied Calculus
Correlation table for Finite Mathematics, by Berresford-Rockett Chapter in Excel Guide
Chapter(s) in Text
1 Getting Started
N/A
Excel material needed for all subsequent sections
2 Graphs of Functions
Chapter 1
Excel material needed for all subsequent sections
3 Linear and Polynomial Regression
See comment at right
Needed for modeling exercises appearing in many chapters
4 Finding Zeros with Goal Seek
Section 1.3, 1.4
Intercepts and break-even problems; solving equations
5 Matrices
Chapter 3
Can also be used for Markov chains
6 Linear Programming using Solver
Chapter 4
7 Mathematics of Finance
Chapter 2
8 Probability and Statistics
Section 5.6, Chapter 6
Comments
Copyright © Houghton Mifflin Company. All rights reserved.
Chapter 1
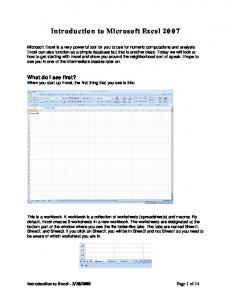
Getting Started With Excel This chapter will familiarize you with various basic features of Excel. Specific features which you need to solve a problem will be introduced as the need arises. When working with the examples given, you should be at a computer with an open, blank Excel workbook. Start up Excel using instructions in your local installation of the software. You will see the following screen. Familiarize yourself with the various components of the spreadsheet.
Cell Address
Active Cell
Menu Bar Formula bar
Formatting
ChartWizard
More ...
Active sheet
The screen with a grid you are looking at is called a worksheet. You can click on the tabs below to go to other worksheets. These worksheets are part of a workbook with the file name book1.xls, but you can rename it to any file name when you save your file. If your screen does not exactly resemble the above, don’t be concerned. To display all the features shown on this sample worksheet, go to View > Toolbars and check the options for standard and formatting toolbars.
Copyright © Houghton Mifflin Company. All rights reserved.
1
2
Excel Guide for Finite Math and Applied Calculus
Data and Cell References All information in a spreadsheet is entered through data in cells. Each cell has a unique reference given by its column letter and row number. You will notice that the cell reference box above the column headings says A1. The reference of the cell can easily be figured out by locating the column and row where it belongs. To move from one cell to another, you can use the arrow keys or select a cell with a mouse click. You can also type g to go to a specific cell reference. You can work with a range of cells. To select a range, click into the beginning of the range of cells. Hold down the mouse and drag to the end of the range. Release the mouse button. The reference for a range of cells is given by beginning_cell_reference:end_cell_reference Check it out • •
Select the range of cells h42:j48 Select the range of cells b8:d40
In the examples given below, a spreadsheet fragment with illustrative cell reference(s) will often appear. These are given to make the examples easier to follow. You can of course use any groups of cells you desire to work the examples, as long you change the cell references to reflect your setup.
Formatting Cells You can type either text or numbers in a cell. Enter some data by first selecting a cell and typing some text or numbers into it. You can use the back arrow to correct the entry. Press . You may then format the cell content as follows: 1 2 3 4 5
First select the cell in which some data is entered. Choose the style and size of the font by clicking on the font list. Click on the Bold, Italic or Underline option if you wish to format in one of those styles. Click on the left, center, or right justification for text in a cell. If you have entered a number, you may increase or decrease the number of decimal spaces displayed. Check it out •
Type in some text in a cell and test out the various formatting capabilities.
Correcting Cell Entries Once you have entered some data in a cell, and pressed , you may later want to edit it. To do this, press the F2 key. You will see the cursor in the cell. Edit by using the backspace key or by using the mouse cursor. Press to accept the new content. To delete the contents of the cell, select the cell and press the key. If you want to clear the formatting options from a cell, go to Edit > Clear > Format.
Copyright © Houghton Mifflin Company. All rights reserved.
Getting Started With Excel
3
Adjusting Cell Width When you type in text, you may sometimes exceed the width of the cell. To widen a cell, move the mouse along the column you wish to widen to the row with the heading labels at the top of the worksheet. You will see a symbol looking like . Holding down the left mouse button, you can now widen the column.
Wrapping Text For aesthetic reasons, you may not want text in a cell to be too wide. In this case, you must wrap the text within the width of a cell. After selecting the cell, go to Format > Cells. Click on the Alignment tab and check the Wrap Text box.
Inserting Rows or Columns Go to the cell where you want to insert a row or column. Right click the mouse button and choose the Insert option. Click on the appropriate checkbox for inserting rows or columns.
Formulas Once you have entered data into cells, you will want to perform some operations with them. Basic arithmetic operators are: Operation
Symbol
Addition
+
Multiplication
*
Division
/
Subtraction
-
Exponentiation
^
The usual order of operations holds. Using the above operators, you can write formulas which manipulate the data you have entered in cells. 3
Example 1 Let x = 3 . Compute f ( x ) = x – 4x . 3
Solution We need to store the x value in a cell. We also need to store the x – 4x result in another cell. Hence, we can make a simple table as follows. Note that you can enter text into a cell as well. Using a spreadsheet makes it easy to annotate your work. D 1 2
x 3
Copyright © Houghton Mifflin Company. All rights reserved.
E f(x) =d2^3-4*d2
4
Excel Guide for Finite Math and Applied Calculus
Now, the value of x is contained in the cell D2. The value for f(x) is computed by the formula using the cell reference D2 in place of x. So, the formula for f(x) using cell references is =d2^3-4*d2 (Note: D2 is the same as d2) To enter this in the spreadsheet:
1 2 3
Select the cell E2 Type the formula =d2^3-4*d2 in this cell Press
A formula always begins with an = sign. There should be no space before the = sign and there should be no space between the = sign and the rest of the formula. Now, change the value of x in D2. What happens to the value in E2? Check it out • •
2
Change f(x) to f ( x ) = 2x + 1 . Enter this formula in E2 using cell references. Be careful when entering formulas. Let the value in a1 equal some number not equal to 1. What is the output of f(x)=1/(x-1) when incorrectly using the formula =1/a1-1? Compare with the correct formula =1/(a1-1)
When you look at a worksheet, you cannot see which cells have formulas and which have numbers. If you want to see all the formulas in the spreadsheet in their respective cells, click Tools > Options. Click on the View tab and check the Formulas box. Close the dialog box, and now your spreadsheet will display all formulas. To go back to the original view, simply unclick the formula box in the View tab. Check it out •
Display the formula view for the worksheet above.
Copying and Pasting Now suppose you want to compute f(x) in Example 1 for x =1,2,3,4,5. You also want to display all these values simultaneously by creating a table. Instead of typing the formula over and over again, we can copy and paste. This is illustrated in the next example. Example 2 Compute f(x) for x=1,2,3,4,5 and display the results in a table. Solution Make columns for x and f(x). Enter the x values that you are interested in: D 1 2 3 4
x 1 2 3
E f(x)
Copyright © Houghton Mifflin Company. All rights reserved.
Getting Started With Excel
5
D 5 6
E
4 5
In the cell E2, enter the formula for f(x)=x3-4x. This gives the following: D 1 2 3 4 5 6
x 1 2 3 4 5
E f(x) =d2^3-4*d2
Press after entering the formula, and you will see the value of f(1)=-3 in the cell E2. Since we want to compute the values of f(x) for the other values of x as well, we can copy the formula by following the steps below. Copying a formula down a column
1 2
Select the E2 cell in the above table. Press c to copy. Select the rest of the f(x) column, cells E3:E6. Press v to paste.
Look in the formula bar for the entries E3:E6 and note that the cell references automatically change to the x-value directly to the left of the y-value.
Autofill option Another way to copy the formula down the column is to move your mouse to the lower right hand corner of the cell E2 until you see a small + sign. Then, holding down the left mouse button, drag your mouse down the column to E6. The formulas will be automatically changed to reflect the new f(x)-values. Your table will look like the following, regardless of the method you use to copy the formula: D 1 2 3 4 5 6
x 1 2 3 4 5
Copyright © Houghton Mifflin Company. All rights reserved.
E f(x) -3 0 15 48 105
6
Excel Guide for Finite Math and Applied Calculus
Check it out •
Change f(x) to f(x)=-x2+4. Remember to recopy the new formula down the column.Somtimes, Excel does not recognize the (-) sign in front of an expression. To be on the safe side, enter the formula as =(-1)*d1^2+4.
File Operations Now that you have entered various items in your workbook, you will want to save and/or print the file. The following table summarizes how to perform various operations with your Excel file. Operation
How to perform
Open new file
Menu > File > New
Open old file
Menu > File > Open; then follow dialog box
Saving new file
Menu > File > Save As; then follow dialog box
Saving to current file
Menu > File > Save or s
Printing file
Menu > File > Print or p
Page setup
Menu > File > Page Setup
Print preview and formatting your worksheet Within the page setup option outlined above, you can set headers, footers, margins, and orientation of the page (portrait or landscape). You can then use File > Print Preview to preview your final output. Although it is preferable to have the grid lines visible on the computer, you should normally not print out the grid lines. The default option in Excel 2000 is to suppress the printing of gridlines. You may want to outline your tables with borders. The border formatting icon on the formatting bar will show you various options. Border formatting icon
Tables in Excel In order to use the graphing features of Excel, you will first need to generate tables of x and y values. In this section, you will learn how to easily generate equally spaced entries for use as x-values.
Copyright © Houghton Mifflin Company. All rights reserved.
Getting Started With Excel
7
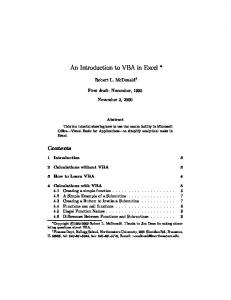
Example 1 Generate a table of values from -2 to 3 in increments of 0.5. Remark We could of course do this manually, but that would be laborious. Excel can automatically generate this table by using the Fill feature. Solution Steps to create a table of x-values
1 2 3
Type a heading label x in cell A1. Type in the first value of -2 in the cell A2. In cell A3, type in the next value of -1.5, since our increments are in steps of 0.5. Now that you have entered a starting value and a value with the increment, Excel can generate the rest of the table. A 1 2 3
x -2 -1.5
4
Select the cells a2:a3 . Move mouse to lower right corner until you see a plus sign. Your screen should resemble the following figure:
5
Drag the mouse all the way down the column to A12. You should now see a filled column of values from -2 to 3 in increments of 0.5, like the one below. A 1 2 3 4 5 6 7 8
x -2 -1.5 -1 -0.5 0 0.5 1.0
Copyright © Houghton Mifflin Company. All rights reserved.
8
Excel Guide for Finite Math and Applied Calculus
A 1.5 2 2.5 3
9 10 11 12
Example 2 Suppose we want to generate x and y values in a table. For example, find f ( x ) = 3x – 2 for the x-values given in the table above. Solution Follow the steps outlined below. Steps for creating table with x and y values
1 2 3
Make a table with x and f(x) column headings. Fill the x-column as directed in Example 1. Next, we need to fill in values for f(x). a
The first y-value will have the formula =3*a2-2. Type it into the cell B2. A 1 2
b c 4 5
x -2
B f(x) =3*a2-2
We next fill the entire f(x) column by simply copying and pasting the formula in the B2 cell: Select the B2 cell in the above table. Press c to copy. Select the rest of the f(x) column. Press v to paste. Note that the cell references automatically change to the x-value directly to the left of the y-value.
Alternatively, we could have used the Autofill method outlined in the Copying and Pasting section. Your table should resemble the one below A 1 2 3 4 5 6 7 8 9 10 11
x -2 -1.5 -1 -0.5 0 0.5 1.0 1.5 2 2.5
B f(x) -8 -6.5 -5 -3.5 -2 -0.5 1.0 2.5 4 5.5
Copyright © Houghton Mifflin Company. All rights reserved.
Getting Started With Excel
9
A 12
3
B 7
Check it out • •
Change f(x) to f(x)=-x2+4. Remember to recopy the new formula down the column. Sometimes, Excel does not recognize the (-) sign in front of an expression. To be on the safe side, enter the formula as =(-1)*a1^2+4. Create a table of x and y values for f(x)=2x-4 for values of x between -2 and 3 in increments of 1.
Some Common Errors Grayed out option boxes This happens when you try to do something with a cell, but are still working with that cell. Click out of the cell and click back in and now select the option.
#REF, #####, #DIV/0 and other error messages #REF usually indicates an erroneous cell reference. Check your formulas in formula view if necessary. ##### means that the number did not fit in the cell. Simply widen the cell to suitable width. #DIV/0 means you’re dividing by zero. Check your formulas and their references. #NAME? usually indicates an invalid name of a function.
Described menu option does not appear in pull-down menu This is not really an error, but rather a “feature” in Excel 2000. If you do not see a menu option listed in the pull-down menu, you should double click on the menu title or click on the double arrows pointing down - it will then list the complete set of options.
Copyright © Houghton Mifflin Company. All rights reserved.