of Matlab is available online, has an introduction to Matlab and also to .... Cleve
Moler, the founder of Matlab has a text book [3], while the Matlab Guide [1] is.
FACULTY OF SCIENCE SCHOOL OF MATHEMATICS AND STATISTICS INTRODUCTION TO MATLAB 2017
c 2017, the School of Mathematics and Statistics, UNSW These notes are copyright Australia. Cricos Provider Code 00098G Maple is a registered trademark of Waterloo Maple Inc. Matlab is a registered trademark of The MathWorks Inc. Microsoft Windows is a registered trademark of the Microsoft Corporation. Google is a registered trademark of Google Inc. The information in these notes is correct at the time of printing. Any changes will be announced through the course Web page where an updated version of these notes may be placed if necessary.
Contents 1 What is MATLAB 1.1 1.2 1.3 1.4 1.5
What is Matlab? . . . . . . . . . . The Matlab Window . . . . . . . . Preparing Matlab script Files . . . 1.3.1 Using the Matlab Editor . . Online self-paced lessons for Matlab The Matlab interface . . . . . . . . 1.5.1 Help facilities . . . . . . . . .
. . . . . . .
. . . . . . .
. . . . . . .
. . . . . . .
. . . . . . .
. . . . . . .
. . . . . . .
. . . . . . .
. . . . . . .
. . . . . . .
. . . . . . .
. . . . . . .
. . . . . . .
. . . . . . .
. . . . . . .
. . . . . . .
. . . . . . .
. . . . . . .
. . . . . . .
. . . . . . .
. . . . . . .
2 2 3 4 4 6 7 7
. . . . . . . . . . . . . . . . . . . . . . . . . . .
9 9 9 9 10 10 11 11 11 12 12 12 13 13 14 14 15 15 15 16 16 17 17 17 18 19 20 20
2 MATLAB COMMANDS 2.1
2.2
2.3 2.4
2.5
2.6
2.7
Basics . . . . . . . . . . . . . . . . 2.1.1 Arithmetic . . . . . . . . . . 2.1.2 Assigning variables . . . . . 2.1.3 Variable Names . . . . . . . 2.1.4 Controlling Output . . . . . 2.1.5 clear . . . . . . . . . . . . . 2.1.6 Number Formats . . . . . . 2.1.7 Complex numbers . . . . . . Saving Sessions, Input and Output 2.2.1 Data Input and Output . . 2.2.2 Recording your Session . . . Built-in Functions . . . . . . . . . . Basic Vectors . . . . . . . . . . . . 2.4.1 Row and Column vectors . . 2.4.2 Vector arithmetic . . . . . . 2.4.3 Colon and linspace . . . . . Plotting . . . . . . . . . . . . . . . 2.5.1 plot command . . . . . . . . 2.5.2 ezplot . . . . . . . . . . . . 2.5.3 Style options . . . . . . . . 2.5.4 Titles, axes and grids . . . . 2.5.5 Specialised plot procedures . M-files and New Functions . . . . . 2.6.1 Function Files . . . . . . . . 2.6.2 Anonymous Functions . . . Further Vectors . . . . . . . . . . . 2.7.1 Ordinary Product . . . . . . ii
. . . . . . . . . . . . . . . . . . . . . . . . . . .
. . . . . . . . . . . . . . . . . . . . . . . . . . .
. . . . . . . . . . . . . . . . . . . . . . . . . . .
. . . . . . . . . . . . . . . . . . . . . . . . . . .
. . . . . . . . . . . . . . . . . . . . . . . . . . .
. . . . . . . . . . . . . . . . . . . . . . . . . . .
. . . . . . . . . . . . . . . . . . . . . . . . . . .
. . . . . . . . . . . . . . . . . . . . . . . . . . .
. . . . . . . . . . . . . . . . . . . . . . . . . . .
. . . . . . . . . . . . . . . . . . . . . . . . . . .
. . . . . . . . . . . . . . . . . . . . . . . . . . .
. . . . . . . . . . . . . . . . . . . . . . . . . . .
. . . . . . . . . . . . . . . . . . . . . . . . . . .
. . . . . . . . . . . . . . . . . . . . . . . . . . .
. . . . . . . . . . . . . . . . . . . . . . . . . . .
. . . . . . . . . . . . . . . . . . . . . . . . . . .
. . . . . . . . . . . . . . . . . . . . . . . . . . .
. . . . . . . . . . . . . . . . . . . . . . . . . . .
. . . . . . . . . . . . . . . . . . . . . . . . . . .
. . . . . . . . . . . . . . . . . . . . . . . . . . .
. . . . . . . . . . . . . . . . . . . . . . . . . . .
1
CONTENTS 2.7.2 Array Arithmetic . . . . . . 2.7.3 More on plotting . . . . . . 2.8 Matrices and Linear Equations . . . 2.8.1 Definitions . . . . . . . . . . 2.8.2 Special matrices . . . . . . . 2.8.3 Standard Matrix Arithmetic 2.8.4 Matrix array arithmetic . . 2.8.5 Systems of Linear Equations 2.9 Calculus . . . . . . . . . . . . . . . 2.10 Programming Considerations . . . . 2.10.1 Logicals . . . . . . . . . . . 2.10.2 If Statements . . . . . . . . 2.10.3 Loops . . . . . . . . . . . . 2.10.4 Other Control Structures . .
. . . . . . . . . . . . . .
. . . . . . . . . . . . . .
. . . . . . . . . . . . . .
. . . . . . . . . . . . . .
. . . . . . . . . . . . . .
. . . . . . . . . . . . . .
. . . . . . . . . . . . . .
. . . . . . . . . . . . . .
. . . . . . . . . . . . . .
. . . . . . . . . . . . . .
. . . . . . . . . . . . . .
. . . . . . . . . . . . . .
. . . . . . . . . . . . . .
. . . . . . . . . . . . . .
. . . . . . . . . . . . . .
. . . . . . . . . . . . . .
. . . . . . . . . . . . . .
. . . . . . . . . . . . . .
. . . . . . . . . . . . . .
. . . . . . . . . . . . . .
. . . . . . . . . . . . . .
. . . . . . . . . . . . . .
20 21 21 21 22 23 23 23 24 24 24 25 26 27
Chapter 1 What is MATLAB 1.1 What is Matlab? The Matlab documentation describes Matlab as a high-performance language for technical computing, integrating computation, visualisation, and programming in an easyto-use environment where problems and solutions are expressed in familiar mathematical notation. Typical uses include • Mathematics and computation; • Algorithm development; • Data acquisition; • Modelling, simulation, and prototyping; • Data analysis, exploration, and visualisation; • Scientific, engineering and financial graphics; • Application development, including graphical user interface building; Matlab is used for across a wide range of application areas covering science, engineering and business/finance. Matlab is an interactive system whose basic data element is an array that does not require dimensioning. This allows you to solve many technical computing problems, especially those with matrix and vector formulations, in a fraction of the time it would take to write a program in a scalar non-interactive language such as C or Fortran. MAPLE, which is used in the standard first year mathematics courses, is an environment for doing mathematics. The basic object in MAPLE is an expression, which can be symbolically manipulated (for example integrated or differentiated). In contrast Matlab is primarily a package for numerical computations whose basic object is a array. Both packages have integrated facilities for two and three dimensional visualisation and animation, tools which are essential for displaying and interpreting the results of mathematical models. There are several versions of Matlab. This chapter tells you how to use the version which is available in the School of Mathematics and Statistics’ computer laboratories located on the ground floor and mezzanine level of the Red Centre. Matlab is available on both the Linux and Windows computers in these laboratories. You may find other versions on computers elsewhere in the university and there is a student version [2] which you can buy from the UNSW Bookshop and run on your home computer. If you are UNSW students, you can download a free version of Matlab from UNSW IT website 2
1.2. The Matlab Window
3
https://www.it.unsw.edu.au/students/software/matlab.html. You can also run Matlab on a mobile device using UNSW MyAccess service from https://aaa-access.unsw.edu.au/v Further information about Matlab is contained in chapter 2, will be given in lectures, or will be in the reference books [4, 1]. The book [3] by Cleve Moler, one of the creators of Matlab is available online, has an introduction to Matlab and also to numerical methods. Matlab has an extensive online help system. In this chapter we will concentrate on the features of Matlab common to both Linux and Windows and also on how to create the files needed for your course.
1.2 The Matlab Window To start a Matlab session (i.e. open a Matlab window), click on the Matlab Application Icon:
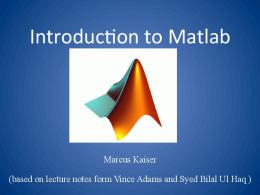
Figure 1.1: Matlab icon After some time, a Matlab window, similar to that shown in figure 1.2, will appear.
Figure 1.2: Initial Matlab windows Figure 1.2 shows the Matlab windows when you start Matlab for the first time. This window contains a tabbed set of menus across the top and a Search Documentation box in the top right hand corner. Most of the time you will be using the HOME tab. Immediately below the menu tab is a list of the folders you are in, ending in Matlab’s
4
CHAPTER 1. WHAT IS MATLAB
current folder. It is good practice to create folders for your different courses, all under your UNSW home drive (not on the local computer) so you can access them from any computer. The first time you start Matlab the main window will be split into several subwindows, including the Current Folder, Command Window, Workspace and Command History. • The Current Folder sub-window lists all the files in the the current folder. • The Command Window is where you type commands and see the results of commands that Matlab has executed. The Command Window has the Matlab prompt >>, indicating Matlab is waiting for you to enter a command. • The Workspace sub-window lists the variables you have created and some of their properties. • The Command History sub-window lists the commands you have used recently, enabling you to easily go back to a previous command. After you have become familiar with Matlab, all but the main Command window may be closed. This depends on what you find to be the most efficient way to work. You may also like to change the height and width of this window as well. Note: Throughout this chapter (unless otherwise stated) we will use ‘click’ to mean ‘click the left mouse button’. When you want to terminate a Matlab session (i.e. close a Matlab window), either simply type quit at the Matlab prompt, or click the close button (small circle with a x) in the top right hand corner. When you quit Matlab your configuration is saved. The next time you start Matlab, your saved configuration will be used.
1.3 Preparing Matlab script Files You will prepare script files and function files during laboratory classes. These are both often called M-files, as they all have the file extension .m (lower case). A script file contains commands to carry out specified tasks; a function file defines a Matlab function. These files are discussed in more detail in section 2.6, and will be covered in lectures. Both types of file should also contain comments — these could give the purpose of the M-file, how to use a function M-file or particular features of your code. NOTE that a Matlab M-file is a text file which contains nothing except a list of Matlab commands (with no prompts) and comments (which start with a %). You should first read the relevant parts of the lecture notes, these notes, any reference book and work out a suitable sequence of commands. Then you should try them out on the computer and modify them if they do not work. Finally you save the script file for later reference.
1.3.1 Using the Matlab Editor An editor is a piece of software used for editing files (also known as word-processing). Since M-files are text files, any editor can be used. However, Matlab has its own built in editor which has the advantage of being purpose built for creating script and function files. Among its features, the Matlab editor has • Syntax highlighting: for example, comments (green) and strings (purple) appear in different colours to commands.
1.3. Preparing Matlab script Files
5
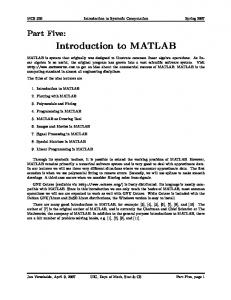
• Program layout: easily indent your Matlab code to reflect the program structure. • Debugging support: breakpoints may be set on any executable line of a M-file and the values of any quantities inspected and manipulated. • Profiling: collect information on the amount of CPU time taken by functions and individual lines of code. To start the Matlab Editor, click the New Script icon (this is the first of the icons in the icon bar in Figure 1.2) or type the command edit in the command window. A new window appears: the Matlab Editor. Alternatively you can use the Open icon to open an existing file, or type the command edit cubic.m. If the file cubic.m is not in Matlab’s current folder then Matlab will ask you if you want to create the file. Figure 1.3 shows a Matlab Editor window, with a script file called cubic.m that will
Figure 1.3: A Matlab Editor Window draw a cubic when executed. The Matlab editor window has its own menus and tabs with icons. These behave in roughly the same way as the corresponding icons in, for example, Microsoft Word. Note that clicking on the first of the icons will open up a new buffer (editing space), so it is possible to have several M-files being edited at the same time. Just under the tabs with the various icons is a list of tabs with the names of the M-files being edited: click on the appropriate name to change to that file. You may see that there is a second file called parabola.m being edited in figure 1.3.
6
CHAPTER 1. WHAT IS MATLAB
Before you can run an M-file, that is sequentially execute all the Matlab commands in the file, you must save the file and the file must be in Matlab’s current folder. Check the files is listed in the Current Folder sub-window (see Figure 1.2), or type the command what in the command window. A very common mistake is to edit and save a file which is not in Matlab’s current folder, so it cannot be run. Note that the lines beginning with a % sign are comments. Matlab ignores everything on a line that comes after a % sign. When saving a script file, you will have to give the file a suitable name; with function files the editor will fill in the name for you — it will always be the name of the function (with the .m file extension added). To prepare a Matlab M-file using a different editor, you work out what commands you want to use and simply use the editor to create a text file containing these commands (and suitable comments). Don’t forget to check that • irrelevant output is suppressed by ending appropriate commands with a semicolon • your file works To check that your script file works enter the Matlab command clear to clear all variables in the current workspace (see section 2.1.5 for more information on the clear command). Then enter the name of the file (without the .m) and the file should run. To check that a function file works just use the function as if it were a standard Matlab function (without any .m extension). Note: We advise you always to do these checks; the commonest problems are caused by students creating an M-file that does not work. Running this check will enable you to spot where errors occur and save a great deal of time, frustration and marks. Exercise Open a Matlab session and open the Matlab editor. Enter the commands in figure 1.3 and save the file as cubic.m. Then activate the Matlab command window and enter cubic at the Matlab prompt and press the Enter key. Running the file cubic.m should produce a plot of the cubic in a new window. When you press the Enter key, Matlab immediately tries to interpret and execute the command(s) you have entered. If the command is the name of a script M-file, then Matlab will try to sequentially interpret and execute all the commands in the file.
1.4 Online self-paced lessons for Matlab A number of introductory self-paced learning modules to provide an introduction to Matlab are available through your course on the Moodle Learning Management System. You should work through these, preferably at a computer with Matlab running so you can try all the exercises. You can also use these notes as an additional reference. The on-line Matlab learning modules also include tests using Maple TA, which may count as part of the assessment for your course. You are expected to create and store in a logical fashion script or function M-files that answer exercises. These may be inspected as part of the assessment of your laboratory participation mark or you may be required to create M-files as part of your Matlab computer laboratory test.
1.5. The Matlab interface
7
1.5 The Matlab interface The Matlab tabbed interface, both for the main Matlab window and the Matlab editor has a large number of icons and associated menus. This tabbed interface was introduced in Matlab R2012b, so older versions have a (very) different graphical user interface (GUI). The underlying Matlab commands are still the same. A context sensitive set of menus (that is it changes depending on which window/subwindow is active) can be obtained by right-clicking. This is often the most efficient way of accomplishing a task. For example if you have a complicated script open in the editor with various structural elements, then using the right-click and choosing Select All followed by Smart Indent causes Matlab to automatically indent loops and logical blocks. Note that in the Matlab editor, roughly in the middle of the HOME tab, is a large green arrow labelled Run (see Figure 1.3). Clicking this arrow gets Matlab to first save the current file that is being edited and then to try to run the file. Any syntax errors are reported in the command window, coloured in red. There will also be a link to the line in the file which caused the error. Clicking on this link will open the file in the Matlab editor and position the mouse as close to the source of the error as possible. Warning: The School of Mathematics and Statistics holds computer laboratory exams in many courses. For these exams the computers are in a special Linux based exam mode. While Matlab runs on Windows, Linux and Macintosh operating systems, the short-cut control keys are often different between the different operating systems. For example in the Windows version of the Matlab editor, Cut and Paste are Ctrl+c and Ctrl+v respectively, while under Linux Cut and Paste are Alt+w and Ctrl+y respectively. Thus it is preferable not to depend heavily on the use of short-cut keys. The context sensitive menu obtained by right-clicking gives you the same set of items under both Widows and Linux.
1.5.1 Help facilities Matlab comes with a variety of help facilities as part of the software product (plus many more available over the www). A Matlab command in the file task.m uses the comments (up to the first blank line) at the beginning of the file or function to provide documentation about the purpose of the script and input and output arguments for functions. In the Matlab command widow, typing help exp displays information in the command sub-window about the exp function which is obtained from the comments at the beginning of the file exp.m. At the bottom of the information displayed in the command window are suggestions for related commands (for example the log command with help exp. (Do not worry if you have not heard of some of these commands at this stage). Matlab’s help browser, pictured in figure 1.4, provides another interface to Matlab’s documentation.. The information from the comments at the beginning of a file may be displayed in Matlab’s help browser using the links at the end of the information displayed by the help command, or directly with the command doc exp
8
CHAPTER 1. WHAT IS MATLAB
Figure 1.4: The Help browser window with a listing of available toolboxes
You can also search for information using the Search Documentation box in the top right hand corner of the main Matlab window – see Figure 1.2 or Matlab editor – see Figure 1.3. Alternatively Matlab’s help browser can be opened by clicking on the question mark ? in a small circle just to the left of the Search Documentation box. You can then enter the term you wish to search for. You can search the help pages either for a known function name or search for a phrase if you do not know the command name (for example, search on “log”). The documentation for both exp and log mentions complex numbers which you may have seen in high school mathematics, but will definitely see in first year university mathematics. One of the powers of packages like Matlab, in contrast to Microsoft Excel for example, is that Matlab can automatically work with complex numbers (this is both powerful and dangerous). The best way to learn how to use Matlab is to experiment and try commands, and explore the online help facilities and examples. The Help browser has tutorials and information about Matlab toolboxes (additional packages of programs for special applications – see Figure 1.4) amongst other information. You may use the Help browser in the laboratory. It may also be used in Matlab tests held in the computer laboratory.
Chapter 2 MATLAB COMMANDS This chapter provides an introduction to some Matlab commands and basic features of the language. More details will be provided during your course. There are many books on Matlab and its use in Engineering, Science and Business. Cleve Moler, one of the founders of Matlab, has a text book [3], while the Matlab Guide [1] is very useful for more advanced techniques. The best way to use this chapter is first to glance through it to get an idea of what Matlab can do (actually it can do far more than what we have described here), bearing in mind that many of the things in this chapter refer to mathematical ideas and processes covered in first year mathematics courses. Later, when you are solving a specific problem, read through the relevant sections of this chapter and your lecture notes, before preparing a list of Matlab commands to solve that problem. Then, when you are entering these commands, use Matlab’s Help browser (see section 1.5.1) for the exact syntax. NOTE There are built in demos in Matlab. To use them, either enter the command
demo during a Matlab session or select the “Demos” tab in the Matlab Help browser window. For further information, see section 1.5.1.
2.1 Basics 2.1.1 Arithmetic The usual arithmetic operations are available in Matlab and you should use the following notation to enter them in commands. addition subtraction multiplication division exponentiation
+ * / ^
So a^b means a to the power b (i.e. ab ). These follow the usual order of evaluation, i.e. anything in brackets, then powers, then multiplication or division, then addition or subtraction. If you want to use a different order then you will have to insert brackets ‘(’ and ‘)’ in the appropriate places.√ For example -1^(1/2) means -(1^(1/2)) (i.e. −1 ), whereas (-1)^(1/2) means −1 (i.e. the imaginary number i , which is denoted 1.0000i in Matlab) and -1^1/2 gives −0.5000 .
2.1.2 Assigning variables
= to assign a value to a variable, for example x=1,f = sin(x)
You use
9
10
CHAPTER 2. MATLAB COMMANDS
This assigns the value 1 to x and then sin(1) ≈ 0.8415 to the variable f. If x were an unknown (it had not been assigned a value), then you would get an error message. What we have been doing is called assigning a value to a variable and the general format for doing it is variable name = expression After you have given an assignment command, Matlab will replace the named variable with its assigned value wherever that variable name occurs in the future. If you do not assign an answer to a variable, then Matlab will assign the result of the calculation to the default variable ans, which you can then use in the next calculation like any other assigned variable.
2.1.3 Variable Names Variable names must start with a letter and the initial letter can be followed by letters, digits and the underline character “_”. There is effectively no limit to the length of a name, but Matlab only looks at the first few characters, where “few” depends on how that system is set up: on the version in the Mathematics and Statistics computer laboratories it is the first 63 characters that count (see the command namelengthmax). Upper and lower case letters are treated as different in names. Here are some examples
t
t3
A_b
T
time
You should avoid using names already used as function names for your own variables, as then you would be unable to use the function. You can test to see if a name is being used by a command like
>> which -all tan_x tan_x not found. This means that tan_x can be used as a variable. Anything else means it cannot. Special Variables Five names stand for constants that are important namely,
pi i or j Inf eps
π ≈√ 3.14159265358979 i = −1 ∞ 2−52 ≈ 2.2 × 10⁻¹⁶ the machine epsilon The machine epsilon eps is the smallest positive number such that Matlab considers 1+eps to be greater than 1.
2.1.4 Controlling Output Often in doing Matlab calculations you will create a very long output that you do not need to actually see. You should get into the habit of suppressing long output by ending such commands with a semi-colon ; so that your Matlab screen does not get cluttered up. So for example
>> a=3; b=5^2-a^2 b = 16 You can also control the amount of space that Matlab uses between lines using the command format compact.
2.1. Basics
11
2.1.5 clear The command clear can be used to remove variables and functions from memory:
clear clears all variables clear functions clears (i.e. forgets about) all M-files and other defined functions clear a b clears variables (or M-files) a and b only clear all clears everything: variables, M-files etc. See the help on clear for further detail.
2.1.6 Number Formats Matlab does all its calculations in IEEE double precision (64 bit) floating point binary arithmetic. This means that Matlab works to about 16 decimal digits and can handle floating point numbers as large as about 10308 and as small as about 10−308 . See the functions realmin and realmax. To control how a number is displayed, you use the format command: changing the format has no effect on Matlab’s internal calculations. √ The following table shows the output of 2009 in the various formats. command
format format format format format format
short short e long long e bank rat
output 44.8219 4.4822e+01 44.821869662029940 4.482186966202994e+01 44.82 14343/320
this is the default that is, 4.4833 × 101 , note rounding 16 places (double precision) as if it were money a rational approximation
There are two other possible types of output you might get from Matlab: Result Inf NaN
Meaning ∞ not a number, e.g. 0/0
2.1.7 Complex numbers
√ Matlab can also handle complex numbers, such as i = −1 . Matlab will recognise both i and j (if they have not been used as variable names) as this complex number. For example
>> 1/2+sqrt(3)*i/2 ans = 0.5000 + 0.8660i The commands real, imag, abs and angle when applied to a complex number give, respectively, the real part, imaginary part, modulus (absolute value) and argument of the complex number. For example:
>> z=1/2-3*i/4; >> real(z),imag(z),abs(z),angle(z) ans =
12
CHAPTER 2. MATLAB COMMANDS
0.5000 ans = -0.7500 ans = 0.9014 ans = -0.9828 You could also have defined the complex number z by
z = complex(1/2,-3/4)
2.2 Saving Sessions, Input and Output Matlab’s main purpose is to perform tasks on large amounts of data, so you need to be able to get data into Matlab and save data from Matlab for later processing. In some of the laboratories exercises, you may be asked to perform some analysis on data will be provided for you (such as the temperature at each point of a grid in a two or three dimensional object or daily share prices for a portfolio of fifty stocks over two years). It is also useful to be able to record your Matlab session so that you can later rerun the same commands, maybe with different data or with minor modifications.
2.2.1 Data Input and Output The save command is used to save the values of some or all of the variables in your Matlab session. This command saves into a file known as a Mat-file. Note that you cannot edit these files, as the information is stored in a binary (non ASCII) format. Also, Mat-files must have the .mat file extension, which Matlab will add if you do not. The load command does the opposite of save, and loads a Mat-file into the workspace. For example,
>> save price.mat jan feb >> save apr21 >> load apr1 The first command saves variables jan and feb to the file price.mat; the second saves all variables into the file apr21.mat, with the .mat automatically added by Matlab; the last command loads the file apr1.mat, again automatically adding the .mat extension.
2.2.2 Recording your Session Matlab has a built in feature that allows you to re-run the previous commands: a history file. This file stores all the previous commands you have entered into Matlab as you type them. You can see this in the the Command History sub-window (see Figure 1.2). If you are using more than a couple of commands it is better to write a script file (see section 2.6) when you use Matlab. If the Command History sub-window is not displayed, tick the box “Command History” under the Layout icon. If you double click on a command in Command History sub-window, it will be entered into Matlab and executed. To select more than one line, hold down the Ctrl key and click each line. The you can right-click the mouse button, select copy, click in th command window, again right-click and select paste, to execute the selected commands.
2.3. Built-in Functions
13
The history file is separated into sections for each different Matlab session, and each of these will have a time stamp. An entire session’s history can be “collapsed” by clicking on the − symbol on the left of this time stamp. There is an option on the Edit menu allowing you to clear your command history if you want to.
2.3 Built-in Functions Although we will not discuss the creation of new functions until section 2.6, we will be using functions in the next few sections, and so we will need some functions which have already been defined. Matlab has an enormous number of ‘initially-known’ mathematical functions (i.e. ones which are already there when you start Matlab). These include the trigonometric functions sin, cos, tan, csc (i.e. cosec), sec, cot and their inverse functions
asin, acos, atan, acsc, asec, acot and the hyperbolic functions
sinh, cosh, tanh, csch (i.e. cosech), sech, coth and their inverse functions
asinh, acosh, atanh, acsch, asech, acoth as well as, for example:
Function
Description
Example
abs sqrt max min factorial round floor ceil exp log log10
absolute value square root largest element in an array smallest element in an array factorial function round (up/down) to an integer round down to an integer round up to an integer exponential natural logarithm logarithm to base 10
abs(-2) sqrt(4) max([132,129,66,120]) min([132,129,66,120]) factorial(12) round(3.5) floor(-3.1) ceil(-3.1) exp(1) log( exp(2) ) log10(100)
Note that most of these function will work on one number, or if applied to a vector or matrix (see sections 2.4 and 2.8) to each element of the vector or matrix. For a complete list of the initially-known Matlab functions, use the Help browser (see section 1.5.1).
2.4 Basic Vectors From its beginning, Matlab was designed to work with matrices and vectors, as its name suggests. Everything in Matlab is, potentially, a matrix: a number on its own is really a 1 × 1 matrix to Matlab. Matrices and vectors are collectively called arrays in Matlab. We begin by looking at vectors.
14
CHAPTER 2. MATLAB COMMANDS
2.4.1 Row and Column vectors There are two types of vectors in Matlab: row vectors and column vectors. Both types of vector have square brackets enclosing the elements (also called components), and for both the command size will give the dimensions of the array, while numel gives the total number of elements in an array. A row vector is printed as a row, and when you define one you separate its elements by either commas or spaces. A column vector is printed as a column, and you use semi-colons or new lines to separate the elements. For example
>> v=[ 1 3 , sqrt(21) ] v = 1.0000 3.0000 4.5826 >> w=[1 ; 3 ; sqrt(21) ] w = 1.0000 3.0000 4.5826 >> size(v) ans = 1 3 You can convert a row vector to a column vector and vice versa using the apostrophe or back quote ’ — we call this transposing.
>> v=[ 1 3 sqrt(21) ] , v’ v = 1.0000 3.0000 4.5826 ans = 1.0000 3.0000 4.5826 To refer to an element of a vector, for example the third element of vector v, use an expression like v(3). This can be extended to extract sequences of elements using the colon notation, see section 2.4.3. You can change the value of an entry with something like w(2)=-3 as well. Note that in Matlab all vectors (and matrices) are indexed from 1 (that is v(1) is the first element). You can also use end to refer to the last entry in a vector.
2.4.2 Vector arithmetic Two vectors of the same size can be added and subtracted. In fact, you can make any linear combination of the vectors you want:
>> a=[1 -4 9 ]; b=[-2 >> 2*a - 3*b ans = 8 -14 9
2
3];
If the vectors are not compatible then you will get an error message.
2.5. Plotting
15
You can apply functions to each element of a vector very simply:
>> v=[pi/4,pi/3,pi/2]; sin(v) ans = 0.7071 0.8660 1.0000 2.4.3 Colon and linspace Entering a small vector by hand is not a problem, but Matlab was designed for big problems, and often these involve vectors whose entries have some regularity, such as consecutive integers, or consecutive odd integers going downwards. If the entries of a vector are an arithmetic sequence, then you can use the colon operator or the linspace command to build the vector. Both of these produce row vectors, which can be transposed to column vectors with the apostrophe. For example
>> a=[1:4] a = 1 2 3 4 >> b = linspace(1,4,4) b = 1 2 3 4 >>c = [7:-2:1] c = 7 5 3 1 In general using [ a : b : c ] where a , b and c are numbers will create a row vector whose first element is a , second element a + b etc and whose last element is no greater than c (if b > 0 , no less than c if b < 0 ). If there are only two numbers then Matlab assumes the increment ( b above) is 1, as in the first example. On the other hand, linspace( a , b , c ) creates a row vector with exactly c entries (100 if c is omitted) with entries equally spaced between a and b . The colon operator can be used to extract more than one element at a time. Suppose vector w had 12 elements. Then the command
>> w( [ 1:2:5, 10:end ] ) will create a vector consisting of elements w(1),w(3),w(5),w(10),w(11),w(12) only.
2.5 Plotting Matlab has a large number of plotting commands, used for various special plots. We will only look at a few of the simplest and easiest.
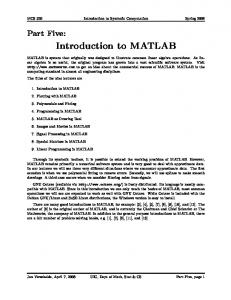
2.5.1 plot command The basic plotting command is plot. The file containing figure 2.1 was produced with the following commands
>> >> >> >>
x = linspace(0,1,101); y = sin(4*pi*x); plot(x,y); print -dps ’sinplot.ps’
16
CHAPTER 2. MATLAB COMMANDS 1
0.8
0.6
0.4
0.2
0
−0.2
−0.4
−0.6
−0.8
−1
0
0.1
0.2
0.3
0.4
0.5
0.6
0.7
0.8
0.9
1
Figure 2.1: Plot of sin(4πx) over [0, 1]
The first command sets up a vector of 101 points along the x -axis, equally spaced between 0 and 1 (so 0.01 apart) and including both 0 and 1. Then we define sin(4πx) for each of these points. The plot command then plots the points (xi , yi ) for each xi in the vector x and corresponding yi in vector y, then joins them up with straight lines: since the points are so close together the graph looks like a curve, but if you did this with points spaced 0.1 apart you would see the lines. The final command saves the plot into a PostScript file called sinplot.ps, which can be viewed using ghostview and/or printed out. See section 2.7.3 for plotting parametric curves and more complicated functions.
2.5.2 ezplot The plot command is very powerful, but often you just want to plot a function directly. The ezplot command can do this. A graph similar to figure 2.1 could have been produced with one command using
>> ezplot(’sin(4*pi*x)’, 0 , 1) Note the use of the apostrophes here: they cannot be left out.
2.5.3 Style options There are a large number of options you can use with plot to change how the graph is plotted or its colour. If you wanted to plot the graph of sin(4πx) with a red dashed line instead of the default blue solid line, for example, you would use the command
>> plot(x,y,’r--’) where the quotes make the third argument a string. The r is the colour and the the code for dashed. Some other possibilities are as below.
-- is
2.6. M-files and New Functions code colour
r red
y yellow
g green
b blue
c cyan
m magenta
w white
k black
code style
. points
o circles
solid
: dotted
-. dash-dot
-dashed
x x-marks
* stars
17
The different styles and colours allow you to plot several graphs at once in a way you can tell them apart. To plot both sin(4πx) and cos(4πx) you could use (with x and y as above)
>> z = cos(4*pi*x); >> plot(x, y , ’r-’ , x , z, ’b--’) Here the sin plot is red and solid, the cos plot blue and dashed.
2.5.4 Titles, axes and grids The ezplot command will automatically put a title on a graph — it uses the function as the title, not surprisingly. You can put a title on any plot using the title command, for example
title(’My first plot’); adds the title “My first plot” to the current plot. Here the quotes define the title as a string. Also, ezplot will label the x -axis with whatever you have used as the variable ( x in the example above). To label axes for any other plot, use the commands xlabel and ylabel in the obvious manner. Finally, you can put a grid over a plot with grid on. Figure 2.2 shows what the earlier plot of sin(4πx) looks like after the additional commands
>> title(’My plot of sin(4 \pi x)’); >> xlabel(’x axis’), ylabel(’y axis’), grid on Note: The use of \pi to define the symbol π . This tells Matlab that you want the correct symbol and not just the letters pi.
2.5.5 Specialised plot procedures We mention one other useful specialised plotting command: polar, used to draw graphs in polar coordinates. For example, figure 2.3 is the result of the following commands
>> >> >> >>
t = linspace(0, 2*pi, 200); r = 1 + cos(t); polar(t,r); title(’Cardioid’)
2.6 M-files and New Functions In section 1.3 we looked at an example of a script file, also called an M-file. This was an ordinary text (ASCII) file containing Matlab commands; typing the name of the file (without the .m extension) causes Matlab to run those commands as if you had typed them in. Note that when you run a script file, Matlab only prints the results of the commands, not the commands themselves. Use echo on to echo the commands; echo off turns
18
CHAPTER 2. MATLAB COMMANDS My plot of sin(4 π x) 1
0.8
0.6
0.4
y axis
0.2
0
−0.2
−0.4
−0.6
−0.8
−1
0
0.1
0.2
0.3
0.4
0.5 x axis
0.6
0.7
0.8
0.9
1
Figure 2.2: Second plot of sin(4πx) over [0, 1]
this echoing off. You can also use what to get a list of the M-files in your current directory (as well as finding out what Matlab thinks is your current directory).
2.6.1 Function Files A function file is another type of M-file, and is one way to define new Matlab functions. To illustrate how these work, we consider an example: Suppose you had r identical objects (coins perhaps) to be distributed to n people where each person can get more than one object: this is known as a selection. The number (n + r − 1)! of ways you can do this can be shown to be . The following commands creates (n − 1)!r! a Matlab function selection that calculates this number.
function [N] =selection(n,r) % % N=selection(n,r) % number of ways N of distributing r objects among n % N = factorial(n+r-1)/(factorial(n-1)*factorial(r)); %%%% end of file %% To make use of this you have to save this sequence of commands into a file called
2.6. M-files and New Functions 90
19
2
120
60 1.5
150
30
1
0.5
180
0
330
210
300
240 270
Figure 2.3: Plot of the cardioid r = 1 + cos(θ) using polar
selection.m — the name of the file and the name of the function must be the same. To use the function, all you need to do is use it like any standard Matlab command
>> selection(11,4) ans = 1001 There are several important points to be made 1. As already mentioned, the name of the file and the name of the function must be the same. 2. The first (non-comment) line must be of the form function [list of outputs] = name( list of inputs) 3. Do not forget to document your function. The comment lines immediately after the opening line are printed out when you ask Matlab for help on the function, so make them useful. This is why we have included the calling sequence in the comments. 4. It is possible to have more than one output variable (see the help pages on functions).
2.6.2 Anonymous Functions An alternative way to define a function is to create an anonymous function. This is useful if you have a function (say a polynomial) that you wish to evaluate at several points
20
CHAPTER 2. MATLAB COMMANDS
in your session but do not want to save as an M-file. These anonymous functions are also used in numerical integration (see section 2.9) and other places. A simple example will illustrate the idea:
>> polynom=@(t) t.^2-2.*t-3 polynom = @(t) t.^2-2.*t-3 >> polynom(-2) ans = 5 Note the use of the compulsory @ symbol, which is used to create the function handle, in this case polynom. The parentheses immediately after the @ contain the function parameters, which behave like the parameters of a function file. It is possible to have more than one parameter, or even no parameters. However, even if there are no parameters to pass to the function, you must include the parentheses to call the function (see the Matlab help page on anonymous functions for an example).
2.7 Further Vectors 2.7.1 Ordinary Product Given a row vector v and a column vector w both with the same number of elements, you can get Matlab to calculate the usual matrix (or dot) product of v and w using a star for what is really matrix multiplication. So for example
>> v=[1 >> v*w ans = -8
3
5
7]; w = [-2 ; 3 ; 4 ; -5];
An alternative is to use the Matlab command
>> dotprod(v, w) 2.7.2 Array Arithmetic One of Matlab more useful but unusual features is a heavy reliance on array operators. These are operations that are applied element-by-element to an array (a vector or matrix). We have already noticed that we can say, for example, sin(v) for a vector v and get a vector whose entries are the sines of the entries of v. We can apply more basic functions to the elements of an array (or more than one array, as appropriate) by using array operators, sometimes called dot operators, as they use a dot. For example, we can create a vector whose elements are the cubes of the first 5 integers by the command
>> [1:5].^3 Note the dot: .^3 means cube each member of the array separately. It’s not the same as cubing an array in the usual mathematical sense you would use for, say, square matrices. Other examples include .*, which can be applied to two arrays of exactly the same shape and will multiply corresponding entries together, and ./ which will similarly divide corresponding entries. For example
>> v = [1 >> v.*w
2
3
4]; w = [2
3
5
7];
2.8. Matrices and Linear Equations
21
ans = 2 6 >> v./w ans = 0.5000
15
28
0.6667
0.6000
0.5714
2.7.3 More on plotting We can use the array arithmetic mentioned above to plot more complicated functions, 2 for example polynomials, or something like e−x . So we could plot x3 − 2x2 + 3 over [−2, 2] with
>> x = linspace(-2,2,200); y = x.^3-2*x.^2 + 3; plot(x,y) 2
And plot e−x over [−2, 2] with
>> x = linspace(-2,2,200); y = exp(-x.^2); plot(x,y) But we can also plot parametric functions this way. As a simple example, suppose we want to plot the curve given by x = t2 , y = t3 for −1 ≤ t ≤ 1 . Then we could use the commands
>> t=-1:0.01:1; >> plot(t.^2, t.^3)
2.8 Matrices and Linear Equations We next turn to the mathematical objects that give Matlab its name: matrices. A p × q matrix is a rectangular array of numbers, with p rows and q columns, for example � � 1 2 3 A= 6 7 −2 is a 2 × 3 matrix.
2.8.1 Definitions To enter the matrix A above we follow the same syntax as for vectors. We enter each row with spaces (or commas) separating the entries and with semi-colons separating the rows (that it, defining the columns). So we can enter the matrix A above with
>> A = [ 1
2
3 ; 6
7
-2 ]
Alternatively, you can take a new line for each new row:
>> A = [ 1 6
2 7
3 -2 ]
You can use the colon to create rows of a matrix as well, so the first row of A could have been defined using 1:3. The apostrophe can be applied to a matrix to get the transpose matrix: all the rows are swapped to columns and vice versa. There are other commands in Matlab to rearrange matrices, such as flipud and fliprl will flip a matrix up-down (around a horizontal axis) and right-left (around a vertical axis) respectively — compare these to the transpose, which is a flip around a diagonal.
22
CHAPTER 2. MATLAB COMMANDS You can get the size of a matrix using the command size, for example
>> size(A) ans = 2 3 size is an example of a function that returns a matrix: a 1 × 2 matrix in fact.
Entries of a matrix can be extracted or changed just as for a vector, although you need to give two indices of course. For example A(2,1) extracts the entry in the second row, first column of A (if A has a second row). Similarly to vectors you can extract more than one element using the colon, and in this way create submatrices. Once again, the indexing begins from 1 and the keyword end can be used for the last entry, see section 2.4.1. For example
>> B = [1 3 5 ; 2 4 6 ; 4 9 16 ]; >> C = B( 2:3 , : ) C = 2 4 6 4 9 16 Note that the colon on its own is equivalent to columns) of the matrix.
1:end and means all the rows (or
In many applications matrices have some sort of structure and are most easily made by being built up from smaller matrices and/or vectors. One obvious example is creating the augmented matrix for a system of linear equations (see section 2.8.5 for solving linear equations). However, in Matlab you can not only augment matrices/vectors (put them side by side) but also stack them (put one on top of the other). For example:
>> A=[1 2; 3 4]; v=[-1; -1]; B= [-3 -2 ; 0 -1 ]; >> [A v] % augmenting ans = 1 2 -1 3 4 -1 >> [A ; B] % stacking ans = 1 2 3 4 -3 -2 0 -1 2.8.2 Special matrices Matlab includes several useful commands for creating special types of matrices: 1. For a 3 × 3 (say) identity matrix, use eye(3) 2. For a 3 × 4 (say) matrix of zeros use zeros(3,4) 3. For a 3 × 2 (say) matrix of ones use ones(3,2)
2.8. Matrices and Linear Equations
23
4. To create a diagonal matrix whose entries are the elements of the vector v use
diag(v) These matrices can be particularly useful in stacking and augmenting matrices.
2.8.3 Standard Matrix Arithmetic For the usual mathematical product of two matrices, or a matrix and a vector, use the * symbol on its own. The two arrays you multiply must have compatible dimensions. Also, do not forget that A*B and B*A will in general give different results
>> A = [1 2 3; 4 5 6]; >> B = [0 1 ; 1 0 ; 0 0]; >> A*B ans = 2 1 5 4 >> B*A ans = 4 5 6 1 2 3 0 0 0 Later on in your courses you will need to use the various Matlab commands for calculating with matrices. For example,
inv(A)
for the matrix inverse;
det(A)
for the determinant;
eig(A)
for calculating eigenvalues and eigenvectors;
rank(A)
for the rank.
2.8.4 Matrix array arithmetic Just as in the case of vectors, Matlab allows you to operate on each element of a matrix individually, so for example exp(A) will give a matrix whose (i, j) th entry is eaij . In later year courses you may come across the matrix exponential, (expm in Matlab) which is a completely different thing, used for solving systems of differential equations. Also, the “dot” operators work on matrices. So A.^2 will square every entry of matrix A . This is very different to A^2, which is shorthand for A*A of course.
2.8.5 Systems of Linear Equations There are special built in procedures \ and rref for solving systems of linear equations. The backslash or left division operator is used for solving a system of equations of the form Ax = b . For example
>> A= [ 3 >> A\b ans =
7 ; 2
5]; b = [1 ; 2];
24
CHAPTER 2. MATLAB COMMANDS
-9.0000 4.0000 This is mathematically the same as calculating A−1 b (you could solve the problem with inv(A)*b in Matlab) but left division is generally faster and uses some sophisticated techniques appropriate for solving systems with floating point numbers, so is a better way of finding the solution, as well as being easier to type. However, be aware that left division will return a result even if the system is actually inconsistent (has no solutions). In this case the answer you get is the least squares best fit to a solution, since this is what is usually wanted in such situations, as you may see in future courses. You need to use rank(A) or something similar to check you have a unique solution if you are uncertain. If you actually want to do a row reduction (Gaussian elimination), the command rref(A) will reduce A to reduced row echelon form. If A were the augmented matrix of a system of linear equations (see page 22), then the last column of the reduced row echelon form is a solution to the system.
2.9 Calculus Matlab is not capable of doing true calculus on its own — for that you would need to use a Computer Algebra System such as MAPLE. But Matlab can do some calculus calculations, for example numerical integration also called quadrature: finding the approximate value of a definite integral. The simplest commands to use are trapz and quad. The former uses the trapezoidal rule and the latter Simpson’s Rule to calculate an integral. Note that quad uses an adaptation of Simpson’s Rule to make itR faster and more accurate. For example, suppose π you wished to approximate the value of 0 sin(x2 ) dx by Simpson’s rule using an absolute error tolerance of 10−15 . Then we begin by defining an anonymous function (section 2.6.2)
>> format long >> fcn=@(x) sin(x.^2); >> quad(fcn,0,pi,10^(-15)) ans = 0.77265171269007 We see here the use of the function handle fcn: it literally gives us a “handle” on the anonymous function so we can use it in quad.
2.10 Programming Considerations So far, the examples we have discussed have been essentially using Matlab as a (sophisticated) interactive calculator. However, Matlab is programmable, in the sense that you can get it to do repeated calculations and make choices. You may be expected to be able to do some simple programming in this sense in your course, and if you are to make proper use of Matlab’s power you need to be able to use the two constructs we now turn to: conditionals and loops.
2.10.1 Logicals Before we look at if statements and loops, we need to consider how Matlab will be handle true/false, in other words how Matlab does boolean algebra. A variable or command that results in true/false is known as a boolean. Quite simply, in Matlab
2.10. Programming Considerations
25
the integer 0 represents false and 1 represents true. Suppose you had a variable x and you wanted to test to see if it is greater than ten (without actually looking at it). In Matlab this would look like
>> x>10 ans = 1 and the value of ans tells you that x is greater than 10. There are 5 other relational operators apart from >, illustrated below. Note that they can all be used on arrays and then are applied elementwise, as is typical. Suppose we have a vector defined by
>> x = [0 -1 2 4] ans = [0 -1 2 4] then we have the following possibilities command
x==2 x>2 x>=2 x x>=0 & x > x1 ans = [0 1 1 1] >> ∼ (x>2) ans = [1 1 1 0] 2.10.2 If Statements An if...elseif...end statement is known as a conditional, a branch or a fork — control is sent down one of two possible paths depending on the truth value of a boolean statement. For example
if (x>3) | (yb) & (c>d) ... end If the boolean is true then Matlab runs the commands after the boolean. If you want to, you can make Matlab do something else if the boolean is false, or do nothing; you do the former with an else clause. For example, the following commands find the absolute value of a real number:
if x>=0 x else -x end You can nest if statements as well; the general form of the if command is something like
if condition1 commseq1 elseif condition2 commseq2 elseif condition3 commseq3
else commseq4
end 2.10.3 Loops Suppose that you want to execute a set of Matlab commands several times, changing the value of one variable n at each repetition. This is called creating a loop, and is very common in scientific and financial programming. The way you create the loop depends on whether you know in advance exactly how many times you want to repeat the commands or not. If you know that you want to repeat the commands 100 times then you can use a construction of the type
for n = 1:100 commands
end The 1:100 is the colon operator we met before, and can be generalised here too, so 100:-2:0 would have n run through even numbers backwards. Also note that unlike many other languages, Matlab allows non-integer increments in loops, so h=0:0.1:1 is legal. The end is essential to tell Matlab where the commands to be repeated end. If you do not know how many repetitions you want to make then you will have to tell Matlab to keep repeating until some condition is no longer satisfied, using a construction of the type
while a> t=linspace(0,2*pi,200); >> for n = 0.5:0.5:4 polar(t,2+n*sin(t)) pause end This block will plot various polar curves known as lima¸cons, with the pause statement making it stop after each plot until you press any key (a message at the bottom of the main Matlab window tells you this). Note also that there is a message at the bottom of the Matlab window as you enter the commands in the loop, telling you to “continue entering statement”. Secondly, suppose you wish to find all the Fibonacci numbers up to and including the first one that is larger than 1000 . The natural way to do this is to calculate each number, check to see that it is smaller than 1000, if not, then calculate the next one and repeat. But we cannot check the size of the number at the end of a loop in Matlab, only at the start. To get around this, we do the following:
>> F(1)=0 ; F(2)=1 ; n=2; >> while F(n)