Jun 15, 2011 - 2 Creating an R Package. 10. 2.1 The Package Skeleton Function . ... Extensive documentation and examples are available on his website and also through pre- .... which includes a table of 11 aspects of automobile design and ..... for caching graphics generated with Sweave on top of the caching ...
Introduction to Sweave and How to Build an R Package Markus Schr¨oder1 and Aed´ın C. Culhane1 1
Biostatistics and Computational Biology, Dana-Farber Cancer Institute, Harvard School of Public Health, Boston, USA
October 24, 2011
Contents 1 Introduction to Sweave 1.1 What is Sweave? . . . . . . . . . . . . . 1.2 What is LATEX? . . . . . . . . . . . . . . 1.3 Code Chunks in Sweave . . . . . . . . . 1.4 Getting started: The Sweave R Package 1.5 A Sweave Example . . . . . . . . . . . . 2 Creating an R Package 2.1 The Package Skeleton Function 2.2 The DESCRIPTION File . . . 2.3 The NAMESPACE File . . . . 2.4 The Vignette . . . . . . . . . . 2.5 Using pgfSweave . . . . . . . .
. . . . .
. . . . .
. . . . .
. . . . .
3 Session Info
1 1.1
. . . . .
. . . . .
. . . . .
. . . . .
. . . . .
. . . . .
. . . . .
. . . . .
. . . . .
. . . . .
. . . . .
. . . . .
. . . . .
. . . . .
. . . . .
. . . . .
. . . . .
. . . . .
. . . . .
. . . . .
. . . . .
. . . . .
. . . . .
. . . . .
. . . . .
. . . . .
. . . . .
. . . . .
. . . . .
. . . . .
. . . . .
. . . . .
. . . . .
. . . . .
. . . . .
. . . . .
. . . . .
. . . . .
. . . . .
. . . . .
. . . . .
. . . . .
. . . . .
. . . . .
1 1 2 2 3 4
. . . . .
10 11 12 12 13 13 15
Introduction to Sweave What is Sweave?
Sweave is based on Cweb, which was developed by Donald Knuth for the C programming language and the aim was to provide high quality documentation by mixing text and programming code. Sweave itself was created by Friedrich Leisch; member of the R Core Team and Professor for Computational Statistics at the Ludwig-Maximilians University Munich. The main homepage is: http://www.stat.uni-muenchen.de/~leisch/Sweave/. Extensive documentation and examples are available on his website and also through previous publications (see References). What is Sweave? It is a tool that allows to embed the R code for complete data analyses in LATEXdocuments. The purpose is to create dynamic reports, which can be updated automatically if data or analysis change. Instead of inserting a prefabricated graph or table into the 1
report, the master document contains the R code necessary to obtain it. When run through R, all data analysis output (tables, graphs, etc.) is created on the fly and inserted into a final LATEXdocument. The report can be automatically updated if data or analysis change, which allows for truly reproducible research. The R code of the complete analysis is embedded into a Latex document using the noweb syntax (Ramsey, 1998). Hence, the full power of LATEX(for high-quality typesetting) and R (for data analysis) can be used simultaneously. See Leisch (2002) and references therein for more general thoughts on dynamic report generation and pointers to other systems. Many R users are also LATEXusers, hence no new software or syntax has to be learned. For introductions to LATEXand tools/editors to use, see http://www.latex-project.org/.
1.2
What is LATEX?
Sweave documents have the file ending ’.Rnw’ and the main structure of an Rnw file is basically the same a LATEXdocument with the Sweave package included in the list of packages loaded for LATEX. LATEX(see http://en.wikibooks.org/wiki/LaTeX/) is different from other typesetting systems in that you just have to tell it the logical and semantical structure of a text. It then derives the typographical form of the text according to the ’rules’ given in the document class file and in various style files. LATEXallows users to structure their documents with a variety of hierarchal constructs, including chapters, sections, subsections and paragraphs.[from LATEXwikibooks] The standard document structure of a LATEXfile includes the definition of the document class, where the document starts and ends. Additional information can include title, author(s) and affiliation of the author(s) as well as a table of content and different chapters and sections within the document. Figures, tables and a bibliography are also very common in most LATEXdocuments. The following code shows a basic LATEXdocument structure with title, table of contents and a section where the text of the document is entered. \documentclass[11pt,a4paper,oneside]{report} \begin{document} \title{Basic \LaTeX document structure with table of contents} \author[1]{Your Name} \affil[1]{Some Affiliation} \maketitle \tableofcontents \section{Section Header} Some text. ... \end{document}
1.3
Code Chunks in Sweave
R code can be included in a Rnw file as code chunks as follows (I escaped the lines so that Sweave is not interpreting them):
2
#= #a a b print(a + b) [1] 5
1.4
Getting started: The Sweave R Package
The Sweave package is part of the base installation of R (everybody should have it within the standard R installation), for more details see: > help("Sweave", package = "utils") The two main functions of the Sweave package are: Sweave(): Produces suitable documentation from the main source files. Rnw -> tex Stangle(): Produces programming code from the main source files. Rnw -> R
Multiple options can be placed in the construct = to control how the code in the chunks is executed (bold means default setting). eval (TRUE, FALSE): Whether the R chunk is run. echo (TRUE, FALSE): Whether the R chunk is shown in the LATEXfile. results (verbatim, tex, hide): Type of output used to show the printed results produced by the R code. ’hide’ will show no output at all.
3
If the R code insight a chunk generates a figure, additional options can be set for whether or not a figure should be generated insight the document and what size (width, height) the figure should have: fig (FALSE, TRUE): Whether the output is a figure. By default, EPS and PDF files are produced. width: Width of the plot in inch. height: Height of the plot in inch.
1.5
A Sweave Example
For explaining the basic functionality of a Sweave document, we are creating some functions, plots and tables in the code below that are in the end run as R code, translated into LATEXcode and displayed in the pdf. We start by creating a small function that takes for example a numeric vector as input and returns a list of different statistics and summaries for that numeric vector. The code chunk named summaryFUN has no additional options set, so the R code is executed and displayed as code insight a verbatim environment in LATEX. #= [this would be the code from below] Results in the following output in the pdf: > custom.summary result result $Mean [1] 15.4 $Max [1] 25 $Min [1] 4 $Summary 4
Min. 1st Qu. 4.0 12.0
Median 15.0
Mean 3rd Qu. 15.4 19.0
Max. 25.0
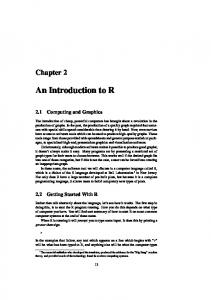
$Head [1] 4 4 7 7 8 9 $Class [1] "numeric" $Length [1] 50 The custom.summary function returns a list that is stored into the result object and printed out. Since we now stored results in a variable, we can also include specific objects from a list or the content of a variable in text outsight code chunks. We therefor use the \\ function. So the mean of the speed from the cars from the 1920’s was 15.4 (\\15.4). Going to more advanced Sweave use cases, we can define our own plotting function or use existing once (for example plot(), hist(), boxplot(), ...) to integrate figures in our document. For a simple example we use another car dataset that is included in the R base installation which includes a table of 11 aspects of automobile design and performance for 32 cars from 1973-1974. To access the columns of the mtcars data frame easier, we attach() it. This just means we attach the data frame to the current R search path so that R is searching a variable name we enter not only in the current environment but also in the columns names of the mtcars object. > attach(mtcars) So we can now access the content of the data frame by just typing the name of the columns, for example miles per gallon (mpg) or car weight (wt). To display the plot insight our document, we have to set the figure option equal to TRUE (fig=TRUE): A histogram plot of the miles per gallon data for the 32 cars results in: > hist(mpg)
5
6 0
2
4
Frequency
8
10
12
Histogram of mpg
10
15
20
25
30
35
mpg
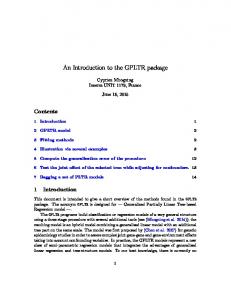
Which tells us that the minority of cars was actually able to reach beyond the 30 miles per gallon range. The same data displayed as a density plot allows us to see that the peak (highest number of cars) needs around 20 miles per gallon. > plot(density(mpg), main = "Miles per gallon Densityplot")
6
0.04 0.03 0.00
0.01
0.02
Density
0.05
0.06
0.07
Miles per gallon Densityplot
10
20
30
40
N = 32 Bandwidth = 2.477
The next, more advanced, code chunk creates a function called plot.data that takes two numeric vectors and some labels for describing the data and creates a custom plot that includes a normal plot and two boxplots that summarizes the content of the plot besides the main plot. > plot.data plot.data(mpg, wt, "Miles per gallon", "Car weight", "Complex Plot")
7
Complex Plot
● ●
● ●
4
● ●
● ● ●● ●
●
●
●●●● ●
●
3
Car weight
5
●
●
●
●
● ● ● ● ●
●
2
● ●
● ● ●
10
15
20
25
30
Miles per gallon
As we can see, the heavier the car, the more gas it needs per mile (which isn’t a trend that we would see with an up-to-date version of sport cars and sedans). Whereas the biggest group of cars cluster at approximately 20 miles per gallon and 3200 lb. Another maybe interesting comparison would be the correlation between the number of cylinders and the resulting horsepower of a car: > plot.data(cyl, hp, "Number of cylinders", "Gross horsepower", + "Complex Plot")
8
Complex Plot
●
250
●
200
● ● ● ● ● ●
150
●
50
100
Gross horsepower
300
●
● ● ● ●
● ● ● ● ● ● ●
4
5
6
7
8
Number of cylinders
And as expected, we see that more cylinders result in more horsepower. As for fuel usage efficiency of the cars from the 1970’s, we could also compare miles per gallon vs. the time a cars needs for a quarter mile in seconds: > plot.data(qsec, mpg, "1/4 mile time", "Miles per gallon", "Complex Plot")
9
Complex Plot
●
● ● ●
●
25
● ● ● ●
20 15
Miles per gallon
30
●
●
● ●
● ●
●
●
●
●
●
●
●
● ● ● ● ● ●
●
●
●
10
●●
16
18
20
22
1/4 mile time
And we see that there is actually a wide range between the values in the plot. We should buy the fastest and also (in comparison) most efficient car, the Lotus Europa with 30.4 miles per gallon and 16.9 seconds for a quarter mile. Sweave and R also allow displaying tables in the document and creating these directly from for example a data frame or matrix. Therefor we have to load the xtable package in R, create the LATEXcode with xtable() (see code below) and set the results option to tex to directly get LATEXcode without interpreting it from Sweave. > library(xtable) > texTable xtable(texTable)
2
Creating an R Package
Building a package in R can be a tedious venture, depending on the number of functions and the complexity of the whole package. Developer who coded parts of their functions in a different programming language (for example C, C++ or FORTRAN) have to make sure to register all the non-R code and to follow the guidelines on how to use external code in R 10
Min. 1st Qu. Median Mean 3rd Qu. Max.
mpg 10.40 15.42 19.20 20.09 22.80 33.90
cyl 4.00 4.00 6.00 6.19 8.00 8.00
disp 71.10 120.80 196.30 230.70 326.00 472.00
hp 52.00 96.50 123.00 146.70 180.00 335.00
drat 2.76 3.08 3.69 3.60 3.92 4.93
wt 1.51 2.58 3.33 3.22 3.61 5.42
qsec 14.50 16.89 17.71 17.85 18.90 22.90
vs 0.00 0.00 0.00 0.44 1.00 1.00
am 0.00 0.00 0.00 0.41 1.00 1.00
gear 3.00 3.00 4.00 3.69 4.00 5.00
carb 1.00 2.00 2.00 2.81 4.00 8.00
functions and packages. If the authors’ intention is to make the package publicly available, the two standard repositories for R packages are CRAN (cran.r-project.org) and Bioconductor (www.bioconductor.org). Helpful informations on all important steps of building an R package can be found in the R extension manual (cran.r-project.org/doc/manuals/R-exts. html). Depending on the repository choice, the restrictions and the review process are different. For Bioconductor the package guidelines are more rigorous than elsewhere and are available at: http://bioconductor.org/developers/package-guidelines/. CRAN usually excepts packages that generally follow the R extension manual and that are not submitted as precompiled binaries (due to security reasons).
2.1
The Package Skeleton Function
After writing some functions in your current R environment you can build a package automatically in R using the package.skeleton() function. You only have to provide a name for the package. So, since we already created two functions earlier, we are going to create our own package with the name SweaveExample with the following command: > package.skeleton("SweaveExample7") A folder named SweaveExample should now be located in the current working directory. The common structure of an R package is the following: DESCRIPTION file with a description of the package, the dependencies, author(s), license, maintainer, ... NAMESPACE file for exporting the functions from the package therefor making them accessible for other packages, and also for importing other packages or functions from other packages that are used insight this package. README file with additionale information about the package or changes since the last version of the package R folder with the functions of the package man folder with the manpages in the Rd format for each function or data in the package inst folder with information for citation
inst/doc folder with the Vignette that explains the functionality of the package and maybe also shows some use cases of functions of the package. 11
data folder with data used insight functions of the package.
By default, if you have at least one function and one R object in your current environment, the package.skeleton() function is creating the DESCRIPTION file and the folders R, man and data. The man folder already includes prototypes of the manpages for each R function.
2.2
The DESCRIPTION File
The DESCRIPTION file provides basic informations about the package (see http://cran. r-project.org/doc/manuals/R-exts.html#The-DESCRIPTION-file for information) and has in general the following structure: Package: PackageName Type: Package Title: Package Title Version: 0.1 Date: 2011-06-15 Author: Max Muster Maintainer: Max Muster Description: Package Description License: Artistic-2.0 LazyLoad: yes Depends: packageA Imports: packageB Suggests: packageC If the package is going to be submitted to Bioconductor, the additional field: biocViews: must includes keywords from the Bioconductor biocViews categories list (http://wiki.fhcrc. org/bioc/biocViews_categories) in order to be categorized into specific groups from the Bioconductor taxonomy.
2.3
The NAMESPACE File
R has a name space management system for packages. This system allows the package writer to specify which variables in the package should be exported to make them available to package users, and which variables should be imported from other packages (see http: //cran.r-project.org/doc/manuals/R-exts.html#Package-name-spaces for details). A NAMESPACE file could look like this: exportPattern("^[^\\.]") import(packageA) importFrom(packageB,functionInPackageB,anotherFunctionInPackageB) The exportPattern line exports all functions from the R folder of the package, that do not start with a dot. For importing other packages the import() lines imports the whole package and only loads it into the R environment if a function from that package is used in an R session. The importFrom() line only loads the specified functions. Functions and packages can only be imported from a package A if that package A exports those functions in the NAMESPACE file 12
of package A, otherwise that package has to be listed as a dependency in the DESCRIPTION file.
2.4
The Vignette
In addition to the help files in Rd format, R packages allow the inclusion of documents in arbitrary other formats. The standard location for these is the subdirectory inst/doc of a source package, the contents will be copied to subdirectory doc when the package is installed. Pointers from package help indices to the installed documents are automatically created. Documents in inst/doc can be in arbitrary format, however it is strongly recommended to provid them in PDF format, so users on almost all platforms can easily read them. To ensure that they can be accessed from a browser (as an HTML index is provided), the file names should start with an ASCII letter and be comprised entirely of ASCII letters or digits or hyphen or underscore. All R packages on Bioconductor also must have a Vignette that describes the functionality and maybe some use cases for the R package. So a user can get a brief and fast overview of the functions insight a specific R package. Since we already wrote our Vignette for this specific R package (if you didn’t noticed: this document is the Vignette) we just have to create the inst/doc folder in the SweaveExample folder and copy this ’.Rnw’ file to the /doc folder. Additionaly the manpages for our two functions can be manually extended with examples, details, descriptions, input and output, authors or references.
2.5
Using pgfSweave
The pgfSweave package is about speed and style. For speed, the package provides capabilities for caching graphics generated with Sweave on top of the caching funcitonality of cacheSweave. For style the pgfSweave package facilitates the integration of R graphics with LATEXreports through the tikzDevice package. With these tools, figure labels are converted to LATEXstrings so they match the style of the document and the full range of LATEXmath symbols/equations are available. In addition pgfSweave can produce syntax highlighted and/or cleaned up source code. The backbone of pgfSweave is a a new driver for Sweave (pgfSweaveDriver). The driver provides new chunk options tikz, pgf and external, sanitize, highlight and tidy on top of the cache option provided by cacheSweave. pgfSweave is an extension of the standard Sweave package, because Sweave runs into problems when the amount of data or the complexity of the analysis insight a Sweave documents grows. For small projects, Sweave works well. For large papers or projects, heavy data analysis or computation can cause document compilation times that are unacceptable. The existing methods (for example Sweave) have some drawbacks: Plots are not cached (since plots do not generally create objects in the global environment). If a plot takes a long time to generate, the same problem exists as when lengthy computations are present. Ideally we would like to reuse a plot if the code that generated it has not changed. Consistency in style (font, point size) in automatically generated graphics is difficult to achieve. The default font and point size in R does not match LATEXvery well and getting
13
this to match precisely is tricky business. The previously mentioned tools, tikzDevice and eps2pgf, counter this but using them with Sweave manually can be cumbersome. The pgfSweave package addresses these drawbacks. For for information see http://cran. r-project.org/web/packages/pgfSweave/ and the Vignettes on that page.
14
3
Session Info R version 2.13.1 (2011-07-08), i386-pc-mingw32 Locale: LC_COLLATE=English_United States.1252, LC_CTYPE=English_United States.1252, LC_MONETARY=English_United States.1252, LC_NUMERIC=C, LC_TIME=English_United States.1252 Base packages: base, datasets, graphics, grDevices, methods, stats, tools, utils Other packages: cacheSweave 0.6, codetools 0.2-8, filehash 2.2, formatR 0.2-2, getopt 1.16, highlight 0.2-5, optparse 0.9.1, parser 0.0-13, pgfSweave 1.2.1, Rcpp 0.9.6, stashR 0.3-4, tikzDevice 0.6.1, xtable 1.5-6 Loaded via a namespace (and not attached): digest 0.5.0
References [1] Friedrich Leisch. Sweave, part I: Mixing R and Latex. R News, 2(3):28-31, December 2002. [2] Friedrich Leisch. Sweave, part II: Package vignettes. R News, 3(2):21-24, October 2003. [3] Friedrich Leisch. Sweave and beyond: Computations on text documents. In Kurt Hornik, Friedrich Leisch, and Achim Zeileis, editors, Proceedings of the 3rd International Workshop on Distributed Statistical Computing, Vienna, Austria, 2003. ISSN 1609-395X. [4] Friedrich Leisch and Anthony J. Rossini. Reproducible statistical research. Chance, 16(2):46-50, 2003. [5] Anthony J. Rossini and Friedrich Leisch. Literate statistical practice. UW Biostatistics Working Paper Series 194, University of Washington, WA, USA, 2003.
15