tron and nuclear magnetic resonance spectrosco- pies is almost as ... The NMR spectrum of a macromolecule is ... The nuclear Overhauser effect, which occurs.
NUCLEAR AND ELECTRON SPIN RELAXATION TECHNIQUES FOR OF BIOINORGANIC AND BIOLOGICAL ACTIVITIES R.Basosi. N.Niccolai,
E.Tiezzi and
DELINEATION
G.Valensin
Department of Chemistry Piano del Mantellini 44-53100 Siena Italy I.
Page 119
Introduction
II. Conformational analysis from * 3 C-1 H selective NOE HI.
x
H NMR relaxation investigations of ligand-receptor interactions
IV. Biomolecular structure and dynamics of liquid phase metal complexes by computer aided multifrequency ESR A. Electron Spin Relaxation of Copper in solution. Multifrequency ESR in the determination of rigid limit magnetic parameters B. Multifrequency ESR of CuBlm complex in solution C. Multifrequency ESR and nuclear relaxation of Cu(II)-(L-Histidine)2 complex in solution References
/. INTRODUCTION The history of biological applications of electron and nuclear magnetic resonance spectroscopies is almost as long as that of the techniques themselves. The first magnetic resonance experiments were in fact, published (1,2) a few years before the first biological applications were devised (3). The development of the field of magnetic resonance is however a typical example of how an original discovery in the field of physics can become of widespread applicability in several research areas of chemistry, biology and, more recently, medicine. The reasons for such rapid development and widespread interest are to be found in the close correlation between magnetic resonance parameters and molecular features. It has been stated, for instance, that nuclear magnetic resonance yields the same information for liquids as X-ray spectroscopy does for solids. Three approaches have been given particular prominence in the field of biological applications of magnetic resonance: (i) investigation of the preferred conformations in solution of biologically active molecules; (ii) delineation of the receptor interactions of effector molecules; (iii) analysis of the structural and dynamic features of complexes of metal ions with biomolecules. Conformational analysis in solution can be aided by several NMR approaches, among which the measurements of the nuclear Overhauser Vol. 7, No. 2/3
120 129 131 132 134 137 138
enhancements (NOE) are by far the most exploited, yielding information on the throughthe-space dipolar connectivities and/or the molecular dynamics of the investigated system (4). In the case of " C - O H } N O E ' S , both ID (5,6) and 2D (7) methods have been proposed as alternative approaches. However, no quantitative analysis in terms of heteronuclear distances has been so far performed. Such analysis will be described in this review for carbonyl carbons in a wide range of molecular systems (8-10) in order to test the reliability and to define the limits of the method of obtaining heteronuclear distances from selective proton-carbon NOE's observed in ID x 3 C spectra. The NMR spectrum of a macromolecule is usually a broad envelope which seldom allows one to observe any individual resonance lines. Moreover it often happens that a small quantity of the macromolecule, insufficient to give a strong resonance absorption, can be isolated. Consequently the problem of studying interactions between a small ligand and its macromolecular receptor has then to be approached by observation of any changes in the NMR parameters of the ligand caused by the presence of the macromolecule. Exchange between at least two environments, free (f) and bound (b) to the macromolecule, must then be considered in developing theoretical equations for the NMR parameters of the ligand; namely either 119
chemical shift or relaxation rates have been shown (11, 12) to be a function of the rate of chemical exchange. Occasionally it may be possible to detect the resonances of the bound ligand directly, but generally the concentration of the macromolecule, and hence of the bound ligand, will be small and this detection will be difficult. If however the rate of chemical exchange between the bound and free environments is fast with respect to either the difference in chemical shift or the nuclear relaxation rate, then the ohserved NMR parameters will be a weighted average of those in each environment and thus information on the bound resonance signals can be gained in the bulk. Paramagnetic metal complexes found in or interacting with biological system have been extensively investigated by magnetic resonance researchers. The study of copper in metalloproteins or small complexes has attracted widespread interest in part because of the unique opportunity of gaining detailed information on the electronic structure of copper containing systems, using parameters deduced from optical spectroscopy and from ESR spectroscopy. There are only two metal ions, VO2* and 2 Cu *, where this approach is possible at any temperature and degree of motion, and of these Cu2 * is by far of greater biological significance. A primary tool in the examination of the structure of many copper complexes as well as of their chemical and biological reactions has been ESR spectroscopy of frozen samples. Although immobilized phase ESR spectroscopy has provided very fruitful insight into the biological behavior of these complexes, it is limited by the change in temperature and physical state of the system which affects the biological significance of the model. An alternative is to run room temperature, solution ESR measurements. The advantage is that spectral conditions match reaction conditions. This may be particularly important in the study of cellular reactions, for interactions of membranes and complexes which alter the motional properties of the paramagnetic species. The apparent disadvantage is the relative lack of information in the room temperature ESR spectrum, due to the motional averaging of the magnetic parameters associated with the principal magnetic axes. However, in principle this problem can be minimized by multifrequency ESR analysis used in combination with other complementary procedures such as computer simulation of spectra, isotopic selective substitution and nuclear paramagnetic relaxation measurements. The rationale for multifrequency analysis is 120
that fitting ESR spectra at several frequencies using the same spin Hamiltonian input parameters is a very stringent requirement which ensures an unambiguous characterization of the system under study and the relaxation mechanisms involved. Conformational Analysis from * 3 C-1 H
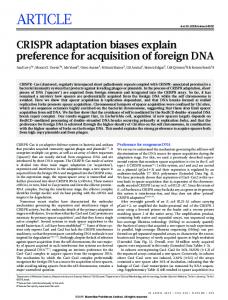
Selective NOE The selective heteronuclear NOEs were generated by the pulse sequence described in Figure 1. The selective low-power decoupler pulse had, typically, a duration of 5-10 times the relaxation time of the irradiated proton. The delay Dl allows complete recovery of 1 3 C longi-
Pl 01
H
13,
Figure 1. The pulse sequence used for obtaining the selective heteronuclear NOE's.
tudinal magnetizations. The delay D2 allows proper switching of the decoupler between the low power and high power modes. The nuclear Overhauser effect, which occurs whenever spectra are recorded under conditions of continuous broad-band proton decoupling (BB), causes intensity changes of the peaks. For 1 3 C nuclei, these range from 1.988 to 0.153 in the ( O J H + « C ) 2 T 2 < < 1 and« c T c > > 1 limits, respectively, provided that the nuclear spin-lattice relaxation process of carbon nuclei is overwhelmingly dominated by proton carbon dipolar interactions. In general, for a given I = 1/2 nucleus: NOEX(BB) = (I z - I o )/I o = 7_B_ yx
W2-Wo 2W, + W2 + Wo + W*
(D
where y is the magnetogyric ratio, I z and I o are the peak intensities measured under continuous Bulletin of Magnetic Resonance
MEASUREMENT OF SPIN-LATTICE RELAXATION RATES OF 'H DECOUPLED X NUCLEI
IF NOE 0
QUANTITATIVE MEASUREMENT OF SELECTIVE
DETERMINATION OF R"> AND i.
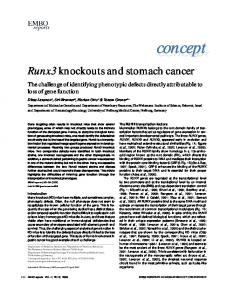
CALCULATION OF X.-H. DISTANCES
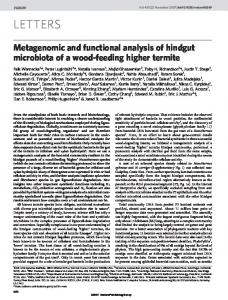
Figure 2. The strategy for obtaining information on molecular structure and dynamics from a combined analysis of selective NOEs and spin-lattice relaxation times.
and gated decoupled conditions, W's are the transition probabilities which determine the relaxation of the X nucleus and W* accounts for relaxation contributions other than the 1 H- 1 3 C dipolar one. As previously suggested in 1 H- 1 H NOE analyses (13,14), for a nucleus X surrounded by i protons eqn. 1 can be rewritten as:
R
NOE C b (H a )Rc b =
(3)
It follows that: NOE C b (H a )Rc b = 6T
-
X
where cr ^ is the ith cross-relaxation contribution and Rx is the spin-lattice relaxation rate of the nucleus X, measured in the absence of cross-relaxation with the dipolarly coupled protons. This relaxation rate is the one routinely measured under BB conditions. Upon selective presaturation of a proton H a which dipolarly interacts through space with a Vol. 7, No. 2/3
C nucleus CD at a distance r a b , its resonance experiences a NOE given by:
f
NOE X (BB)= 1
13
Thus, by combining selective NOE measurements and spin-lattice relaxation rates, information on single proton-carbon distances can be obtained in two different ways: a) the ratio method: when the saturation of H a gives NOEs on two or more carbon resonances, internuclear distances can be calculated from the following relationship: 121
Table
1.
i3
C relaxation parameters measured for compound J_.
ppma
5
1
3
4 2
6
7 8 9
168.44 156.00 133.62 118.66 115.21
64.66 53.45 49-67 14.57
RrL b n
N0Ec (BB)c
0.09 0.25 1.74 0.10 1.72 2.22
1.06 1.19 1.84 1.30
1.61
1.90 2.04 1.67
0.81 O.38
1.94 1.95
X Cn DD *
0.53 0.59 0.92 0.65 0.97 O.98 0.95 1.02 0.84
•.»•/*
•, — —• 1.60 1.66 1.09 0.76 0.27 0.10
a) ppm from internal TMS; b) 1 3 C spin-lattice relaxation rates in s'1; c) non-selective NOEs; d) fractional effectiveness of 1 H- 13 C x dipole-dipole relaxation mechanism; e) R^"Vm=(Rr,n X r ^ D ) / m is the dipolar contribution to the spin-lattice relaxation rate measured for carbon n which has m attached protons.
Table 2.
13
C relaxation parameters measured for compound 2.
ppma
8 5
1 2
4
3 6 9
7
168.73 165.19 143.52 130.01 123.87 118.09 60.17
23-97
14.00
R Cn b
0.16 0.08 0.19 1.66
0.11 I.69
1.11 O.63 0.51
N0Ec (BB)c
1.30 1.00 1.23 1.87 1.22 1.99 1.84 1-74 1.89
Xc DD d
0.65 0.50 0.62 0.94 0.61 1.00 0.92 0,87 0.95
R DD /m e
1.56 1.69 0.51 0.18 0.16
a), b) , c) , d) and e) see note of Table 1.
122
Bulletin of Magnetic Resonance
Table 3- Selective NOEs and internuclear distances calculated for 1.
C n (Hm)
NOEr (Hm)
c, (NH ) c, (H2 ) c2 (H2 )
O.96c 0.56= 1.87 1.67 0.95= 0.39=
2
)
(H* ) c
*
(u }
r r -Hm
1.81 1.99
1.92 2.11 1.07 1.07 2.11 2.72
1.05 1.07 2.12 2.50
a) Distances calculated from Dreiding models (in A); b) distances calculated according to method 1 described in the text (in A ) ; c) these NOEs, observed in single carbons, derive from a simultaneous irradiation of two equivalent protons. Hence, they have been divided by two to yield correct internuclear distances (see text).
Table k. Selective NOEs and internuclear distances calculated for 2.
C n (Hm)
NOE C (Hm)
r c -Hm r
a
' o
C 8 ,-H(N) C,-H(N)
0.27 0.37
2.08 2.08
r
b
' i
2.15 1.98
a ) , b) and c) see the note of Table 3-
Vol. 7, No. 2/3
123
NOE C 2 (H a )Rc 2
(5)
provided that one of the two distances is known and the same correlation time, T C, modulates the dipolar interaction of H a with Cl and C2 atoms. With this method, structural information can be obtained without having any "a priori" estimate of
V b) the absolute method: on the basis of eqn. 4, r a k can be calculated if the correlation time is known. This correlation time can be evalulated from the dipolar contribution of the spin-lattice relaxation rates of protonated carbons. In general, the experimental strategy shown in Figure 2. has been followed in order to obtain structural and dynamic information from the measured relaxation parameters. It should be noted that a simultaneous irradiation on n equivalent protons yields a n times larger selective NOE, provided that the same correlation time and internuclear distance control all the n X-H dipolar interactions. Two molecular systems of different size and spectral complexity are here analyzed. In the first case, two small organic compounds have been studied:
Their 1 3 C spin-lattice relaxation rates Rcn> and the non-selective NOEs, NOE(BB), have been measured (see Tables 1 and 2 respectively). These data suggest the following conclusions on relaxation mechanisms and molecular dynamics of 1 and 2: i) in both molecules protonated carbons exhibit NOE(BB)'s very close to 7 J J / 2 T C indicating that their relaxation pathways are dominated by the dipolar interaction with the 124
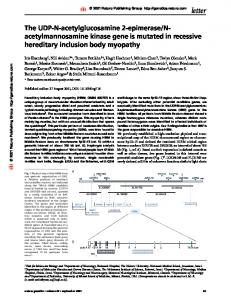
bound proton(s) and that this relaxation mechanism has to be modulated by correlation times which satisfy the extreme narrowing conditions: 2 (wJJ + O>Q)2 T < < 1. ii) Quaternary carbons have a much slower relaxation rate and a fractional effectiveness of the dipolar mechanism, X D D , which ranges from 0.5 to 0.65. These X D D values, calculated from NOE(BB)/1.99 ratios, indicate that the dipolar-mechanism still plays a significant role in the relaxation of these carbon nuclei. NOEs built up by the selective proton presaturations in the range of 5.5-8.5 ppm have been measured for compounds 1 and 2 and their values are reported in Tables 3 and 4 respectively. It is interesting to note that in 1 the strong dipolar interaction C 2 -H 2 and C 3 -H 3 are J modu2 2d l (3 l lated. This J modulation ( l Jc 2 H2 = 1 J Q 3 J J 3 = 163 Hz) can be explained by considering that 1 3 C- 1 H dipolar interactions occur at the frequency of the 1 3 C satellite proton resonances. The J modulation is not observed for the other NOEfwjj m )'s due to the small coupling constants involved and to the low resolution of the frequency dependence study shown in Figure 3. For a quantitative evaluation of this J modulated selective NOEs a sum of the two maxima is needed. On the other side, the selective Overhauser enhancements observed on C, ,C4 and C5 upon selective irradiation of amino and H 3 protons have to be divided by two. Indeed in these three cases the distance between the simultaneously excited equivalent protons and the considered carbons are the same; then the observed NOEs must be divided by two to determine the contribution from one proton, so as to deduce the correct C-H distance. Internuclear distances can be evaluated by using the absolute method, provided that a suitable T C can be determined. This can be done by analyzing the dipolar contribution of the 1 3 C spin-lattice relaxation rates of protonated carbons (15). From (R.DD/m)'s re p Or ted in Table 1, effective correlation times can be calculated. In particular, by assuming r^ 2 JJ 2 = r £ 3 j j 3 = 1.07 A, a correlation time r c = 6.1 1 0 . 2 X 1 0 ' 1 1 scan be estimated. The same value for r c has been found for compound 2. Once the correlation times have been defined, the absolute method previously described can be used to obtain proton-carbon distances, reported as r, 's in Tables 3 and 4. The distances so calculated show a good agreement with the corresponding distances estimated from Dreiding models (r o 's in Tables 3 and 4). Of particular interest are the distances involving aminic or amidic proton(s): these groups occur in a wide variety of important Bulletin of Magnetic Resonance
8.5 ppm
5.0
i
i 1000
1300
1700 Hz NOEo,
A
»•
0.9
j
0.5
•
• i
i .
;
\
i \ i \ \ i \\
/ /
/
i •
/ / /
*
0.1
\ !\
# #
f
*
A I\ ! \\A\/f •, '»\/•: * \ *
, ri u J'
•/ \ !
\
«\
\
\
•
\
\
W r
• • • •
A ; /\ ;« V \I
\
\
^ \ ^ \
. i .i
*
•
1. I .1 . hU
Hz
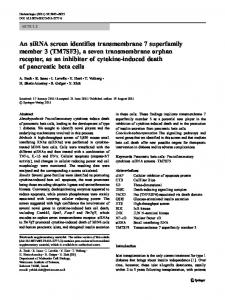
Figure 3. Frequency dependence of selective NOEs observed on C, ( ), C2 ( ), C 3 ( ), C4 ( ) and C5 ( ) 1 3 C resonance of 1, upon the decoupler settings indicated by the arrows. The top insert shows the irradiated region of the proton spectrum.
classes of organic molecules. The fact that r o 's are close to the corresponding r ^ s suggests that a suitable r c has been chosen for the calculations and a good accuracy in internuclear distance measurements can be achieved, if NOEs and R's are carefully determined and a reasonable selectivity of the Vol. 7, No. 2/3
decoupler pulse can be obtained. This was not the case for the irradiation of H 2 and H 3 in 2, where the presence of a more strongly coupled H 2 -H 3 system (5/J = 26. and 3.8 in 1 and 2 respectively), has the consequence that the J modulation of selective NOEs did not yield sharp maxima as for compound 1. A quantitative treatment of selective NOEs in strongly coupled systems is, therefore, more complex and this constitutes actually a limit of the method. As an example of a more complex molecular system, gramicidin S has been investigated. This cyclic decapeptide in DMSO solution does not show very significant NOE(BB)'s at room temperature, suggesting that a long correlation time modulates the x H- 13 C dipolar interactions. Therefore, all the NMR measurements for the decapeptide were run at 80° C. In these experimental conditions and in the applied frequency range of proton selective irradiation, many selective NOEs are observed, see Figure 4. For discriminating between real and spill-over generated selective The on-resonance excitation of amide protons always yields large NOEs on the geminal carbonyl carbons, which can be used for carbon resonance assignments but do not contain any structural information. Furthermore, several conformationally dependent NOEs were observed on: a) Phe C=O upon selective irradiation of Val NH (this NOE is characteristic of the peptide (3 turn structure); b) Phe C=O upon irradiation of Orn NH2 due to the formation of a side chain-backbone hydrogen bond; c) Leu C=O and Val C=O upon irradiation of Leu NH, consistent with the * and ¥ angles of the Leu residue and with the presence of a transannular hydrogen bond characteristic of the gramicidin S antiparallel D pleated sheet conformation. All the proton-carbon distances shown in Figure 5 are calculated from the observed selective NOEs on gramicidin S 13 C resonances using eqn. 4 and a r c = 3.5 X 10" 1 ° s. From the experimental results reported above it is apparent that a combined analysis of selective NOEs and spin-lattice relaxation rates can yield powerful structural information and heteronuclear distances. For this type of structural approach the selection of the experimental conditions has a critical importance due to the NOE dependence on w 0 , r c and, hence, on temperature, viscosity and molecular size. The proton decoupler selectivity may cause spillover and, therefore, a difficult interpretation of experimental data of molecules whose proton spectrum is not well spread out in the region of interest. 125
Table 5. Nonseiective (Rns) and selective (Rs) longitudinal relaxation rates of the phenyl protons of Glycyl-L-tyrosine bound to Zn-carboxypeptidase A
Tyr H € € , Freqquency (MHz)
90 90 90 90 270 270 270 270
| Enzyme| (mM)
|Gly-Tyr| (mM)
0 0.66 0 0.83 0 0.66 0 0.16
4343.
Rns
1
(V ) 1.19 1.28 1.14 1.35 O.65 O.78 0.64 O.69
22. 22.
43. 43. 10. 10.
Rs
• R ns / R s
Rs
1
(s-1)
O.76 1.39 0.84 2.04 0.51 0.85 0.53 0.77
Rns
(V )
0.17
—
0.21
1.56 1-72 • 51 1.78 • 19 • 19 1.13 1.13
1
R n s /R s
(s" )
(s-i)
1.11 2.00 1.06 2.50 1.06 1.43 0.94 1.26
——
0.20 — 0.22
Note, T - 274 K.
Table 6. Nonselective and selective spin-lattice rates of colchicine 0.1 mol dm'3 at pH « 7.0 after the addition of 0.1 ml of different biological preparations. Preparation added
_ DPPC vesicles Rbc 4% Rbc ghost 4%
126
11
Rns
Rs
Rns
Rs
Rns
Rs
Rns
1.29 1• 31 1.42
O.89
2.96 3.08 3.01 3.06
2.07
3-95 3-97
2.72
4.35
3.02
4.31 4.36 4.30
5.13
1
.34
1.18 1.51 1.21
2.78 3.48 2.81
4.07 4.01
3.65 4.56 3.72
3.97 3.89
Bulletin of Magnetic Resonance
9
8 Iha
«ni
PP"
*rm~mt
Ua
• Hz
no* 0.4 0.2-J
— —
U.C*
-•--
m«c-e
—
MC4
r r . c^o
-
/yCs
•-
-
0.0 i
I 1800
i
i
i
i
i
i
1600
i
1
T 1400
-
t
Hz
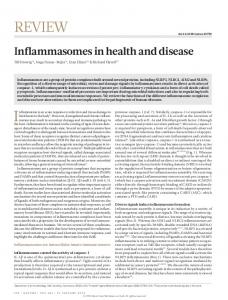
Figure 4. The frequency dependence of selective NOEs on proton chemical shift observed for gramicidin S in DMSO at 50.3 MHz and 80° C.
Figure 5. The solution structure of gramicidine S. The arrows indicate the detected 1H-13 C dipolar couplings and the corresponding intemuclear distance are shown. Overhauser effects, only NOE maxima obtained under on-resonance irradiation, are taken into account.
Vol. 7, No. 2/3
127
11
l/iR
S
..NNCOCH.
_ (s)
II
MjCO-Jls" „
0.6
HsCO
0.5
• OCH, r
0.4
•
0.3
0.2
0.1 ,
i
i
1
0.01
A
0.02
i
0.03
i
0.04
t
0.05 iColrhinnr '
i
0.06 (mol
Figure 6. 1/ARS vs. colchicine for the H proton in the presence of red blood cells. pH = 7.0, T = 298 K.
Then, 2D heteronuclear NOE spectra can be comparatively analyzed, even though their quantitative interpretation is not straightforward.
II. x H NMR RELAXATION INVESTIGATIONS OF LIGAND-RECEPTOR INTERACTIONS The applicability of the NMR approach to investigations of ligand-receptor interactions suffers from the following drawbacks: 1) The amount of ligand bound may be too 128
small to be detected, such that under conditions of slow exchange no effect on the bulk resonance will be observed. 2) Conditions of fast exchange may not apply to all the resonances, since they may have different relaxation times and chemical shifts in the bound site. 3) The observed parameter may be intrinsically insensitive to the presence of the macromolecule. The third point needs further discussion since it represents the reason why diamagnetic Bulletin of Magnetic Resonance
systems have been up to now neglected and why the method of selective irradiation has been shown (16-20) to allow a very suitable approach to diamagnetic ligand-receptors pairs. In fact, if two environments are assumed, a fast exchange rate yields the following equation. M
M
Pb b
obs =
(6)
where M is a generalized NMR parameter, f and b refer to the free and bound environments and the p's are the fractions of ligand molecules (Pf+Pb = *)• Since p^ must be usually kept very small (pjj < < 1, pf = 1), the NMR approach is feasible only provided M^ is quite different from Mf. If the M is the chemical shift, observation of any effect practically occurs only in the presence of nearby paramagnetic centers within the molecule. If M is the spin-lattice relaxation rate (the spin-spin relaxation rate will not be considered here since many complications arise in the measurements), the relaxation mechanism as well as the modulation of the relaxing field must be considered. In the most frequent case of protons relaxed by intramolecular 1 H- 1 H dipolar interactions the spin-lattice relaxation rate can be expressed as a sum of interactions extended to all the actual spin-pairs (13) (7)
i, = ? P i ; +
Pj: and a•• named the direct and cross relaxation terms of any spin i dipolarly coupled to a spin j , depend upon the transition probabilities among the four energy levels (aa, aP, Pa, Pp): Wo
=2W, + W 2
- Wo
(8) (9)
where W1 is the single quantum transition probability (aP •PP, aa • • Pa), Wo is the zeroquantum transition probability (aP ~$a, and W2 is the double quantum transition probability (aa~ -P3). The explicit forms of Py and cr- in the case of intramolecular dipolar interactions are: 37",
6T,
(10)
(11) where r is the interproton distance, w is the proton Larmor frequency and T C the motional Vol. 7, No. 2/3
correlation time. Substitution of eqns. 9 and 10 into eqn. 7 yields, for a given spin pair: (12)
1+O> 2 T C 2
Since binding to a macromolecular receptor slows down the reorientational motions to the WTC >> 1 region, where f(r c ) is very small, the spin-lattice relaxation rate of the bound ligand will be large only in cases where the relaxation mechanism has changed, which, as a matter of fact, has limited the applicability of relaxation studies to paramagnetic systems. However, when selective irradiation is used to excite the spin i such that the spins j are not perturbed eqn. 7 is modified as follows (21): (13) and, as a consequence, 3r, 2
1+« TC
6T, 2
+ Tc
(14)
in such a case, even if the relaxation mechanism does not change, entering the slow motion region does not alter the direct dependence of R I J S on T C and thus the selective relaxation rate of the bound ligand is expected to be quite different from that of the free ligand in solution. It follows that selective irradiation of properly chosen spin systems within relatively small "NMR visible" biomolecules allows detection of binding to macromolecular receptor without requiring insertion of paramagnetic spin probes. As an example, binding of the substrate glycyl-tyrosine to the Zn-enzyme carboxypeptidase can be tested as shown in Table 5 (16). Selective irradiation of whichever doublet within the AA'BB' spin system of the aromatic ring yields changes in R s in the range 40-100% depending upon the Larmor frequency; whereas changes in R n s (=non-selective) are negligible, especially at high frequency (16). The method of selective irradiation can then be exploited to detect binding to ill-defined receptors within biological preparations, such as blood or whole cell samples. In Table 6 the effect of adding different samples to a solution of colchicine (a well known anti-mytotic and tumor-inhibiting alkaloid) are reported. It is evident that only binding may be responsible for the observed enhancement of R s , since no change in viscosity, such that molecular motions are slowed down by more than one order of magnitude, can be demonstrated. 129
Once the ligand-receptor binding has been isolated, as in the case of colchicine interacting with erythrocytes (RBC), details of the interaction can be gained by proper changes in the experimental variables, such as pH, temperature, concentration etc. In particular titration of the R s enhancement vs. the ligand concentration allows evaluation of the apparent association constant K a s g . For a 1:1 interaction the binding equilibrium can be schematized as; C + RBC
RBC-C
The apparent equilibrium constant is given by: K =[RBC-C]/[C][RBC] = [RBC-C] [C]{[RBC]n - [RBC-C]}
(16)
where [C] is the concentration of free colchicine and [RBC]0 represents the initial concentration of red blood cells. The fraction of bound colchicine, p^, is given by: p b = [RBC-C]/{[C] + [RBC-C]} * [RBC-CMC] Eqn. 16 way:
(17)
can be rearranged in the following
[RBC-C] = K[C][RBC]O/{1 + K[C]}
(18)
Substituting eqn. 18 into eqn. 6 and 17
yields:
1/ARS = (l/K + [C])/R|[RBC]0
(19)
Eqn. 19 states that extrapolating the plot of i/ARs vs. [C] to zero allows evaluation of K (1/ARS is zero when [C] = -l/K). A typical plot is shown in Figure 6 for the H2 proton of colchicine: the linear relationship is evident, allowing staightforward extrapolation to 1/ARS = 0.
///. BIOMOLECULAR STRUCTURE AND DYNAMICS OF LIQUID PHASE METAL COMPLEXES BY COMPUTER AIDED MULTIFREQUENCY ESR Most conventional ESR is linear and "approximately" CW, operating at around 9 GHz, the X-band microwave region, and employing 100 kHz field modulation. However, since the resonance conditions can be fulfilled for a variety of frequency-field combinations, many other 130
frequencies are possible. In the case of copper complexes (22) multifrequency ESR can: (i) be used to study frequency effects on relaxation times and linewidths; (ii) provide a critical test of theoretical simulations; (iii) provide a means to increase spectral resolution by varying the interplay of Zeeman and hyperfine interaction (e.g. to separate the spectra of different species) ; (iv) be used to study higher order and state mixing effects. Microwave frequency is thus an important experimental parameter. Increasingly, application of ESR is demanding a detailed consideration of spectral profiles, rather than simply the positions and intensities of the lines. This has led to greater use of computer simulation in interpreting the spectra. A simulated spectrum will be in the best agreement with an experimental one if the parameters used in calculating the simulated spectrum are adjusted so that the least squares quantity is minimized. With this kind of approach subjective judgements in the evaluation of "goodness of fit" can be eliminated. Computer simulation when used alone is a quite efficient tool for ESR spectral analysis, but when used in combination with isotopic selective substitution and multifrequency ESR results in a synergistic effect yielding a complete and precise description of the system under study (23). In fact, even when the study is limited to the less complicated room-temperature spectra the use of isotopically pure samples is recommended because in so doing the time necessary for spectral simulation is minimized. In a bioinorganic system involving a paramagnetic center like copper ion, further information on the molecular structure and dynamics can be provided by the combined use of ESR and FT-NMR. It is well known that the transverse and longitudinal relaxation times are shortened by interaction with a paramagnetic species such as a transition metal ion. The selective variation of the T, 's and T 2 's in the same ligand molecule depend on the distance from the metal and on the ESR hyperfine coupling constant according to the Solomon-Bloembergen equation (24, 25). The interpretation is correct provided that exchange between free and coordinated ligands is rapid on the NMR time scale. The selective broadening of the ligand NMR peaks after the addition of the paramagnetic metal ion probe provides independent information about the assignment of the binding sites. Furthermore nuclear relaxation rates of the 1H and x3 C nuclei of the ligand allows us to infer about dynamic and structural properties. In fact the Bulletin of Magnetic Resonance
dipolar and the scalar I.S. interactions become the most effective relaxation mechanism whenever fast exchange conditions between bulk and bound ligand hold. As a consequence a paramagnetic contribution to the nuclear relaxation rates can be measured in the following way: 1/Tip = 1/T i(metal) - 1/T i(blank ) = f/TiM fi =1,2)
(20)
where T i ( m e t o j) and T i ( b l a n k ) are the experimental relaxation times after and before the metal addition respectively. When Cu(II) is the paramagnetic probe the following simplified Solomon-Bloembergen equation holds: 1/T1M =KV c /r«
(21)
That is to say the paramagnetic contribution to transverse relaxation rate fl^p"1) is determined only by the scalar interaction, whereas the paramagnetic contribution to the longitudinal relaxation rate (T^ p " 1 arise from the dipolar interaction only. It is noteworthy that the (Tjp" 1 ) contributions depend (as concerns nuclei in the same complex) upon the distance r between the ligand nuclei and the metal ion. The independent check by means of the FT-NMR technique gives direct information on the ligand in most cases; whereas the ESR spectra gives straightforward evidence of the metalligand bond by means of the Fermi contact interaction between the unpaired electron of the copper atom and the ligand nuclei. The interplay of multifrequency ESR, computer simulation, isotopic substitution, together with the difference in the time scale for ESR and NMR can provide a deep insight into the relaxation mechanisms and the molecular structure and dynamics of copper complexes in solution. Althought some examples will be presented in detail, the material described is by no means comprehensive, as the topic reviewed has become such a broad area of study. Rather we have tried to provide information from our work and experience that we hope will be of general interest.
A. Electron Spin Relaxation of Copper in Solution. Multifrequency ESR in the Determination of Rigid-limit Magnetic Parameters. The ESR linewidth for Cu(II) in solution can be attributed to the incomplete averaging out of Vol. 7, No. 2/3
the spin Hamiltonian parameters (anisotropic g factor and hyperfme coupling A) by the tumbling motion (26-28). The theory of relaxation mechanisms governing the ESR lineshape has been refined to a very satisfactory level for the motionally narrowed limit (29-34). The general theories of magnetic resonance (35) predict modification of the position of hyperfine lines (second order shift(s) in ESR spectra as a result of the effects of the line broadening and relaxation mechanisms (35-37). As these shifts have usually been considered small, compared to the linewidths, they have invariably been neglected (38, 39). However, second-order shifts become quite significant at lower microwave frequency and they can readily provide direct information on the magnetic parameters in the liquid phase at room temperature. The second-order shifts vary within an appreciable range with an inflection in a plot of the dynamic second-order shifts as a function of rotational correlation time, when WTJJ = 1; where w is the microwave frequency. Dynamic second-order shift effects are expected to be pronounced at low microwave frequencies in systems with large hyperfine interactions, such as square-planar CuJ * complexes. Furthermore, they give observable effects at X and Q band. The rationale for combining lineshape and frequency shift measurements was developed by Hyde and Froncisz (22), reformulating in Kivelson's notation, the expression of Bruno (40) for the dynamic second-order frequency shifts in the fast tumbling limit. A complete treatment of the non-secular contributions to the spin Hamiltonian (using a perturbation approach) definitely demonstrated the reliability of a general theory for complexes displaying axial magnetic tensors with S = 1/2 over the expanded range of the motional region ( T R = 10- 1 X - 5X 10- 8 s)(41). The dynamic second-order frequency shifts can be explicitly included in computer simulation programs. In a recent paper (42) an unambiguous, rigorous way has been found to extract all of the necessary magnetic parameters in the fluid phase by a combination of multifrequency ESR spectroscopy and computer simulation. The approach depended critically on the analysis of dynamic second-order frequency shifts. Previously, the only approach was to freeze the sample and extract the magnetic parameters from analysis of the frozen solution powder pattern. This is undesirable for many reasons. Vanngard (43) called attention to changes in 131
Table 7. Magnetic parameters of ' s Cu(dtc) 2 .
Error from Gof 298 K Data Analysi s 2.0Ai»0 2.015 2.102 0.087 -229.0 MHz -90.3 MHz -506.3 MHz
9iso
9l
gg Ag a
iso
A
l
A|
AI T
-It 16.0 MHz 75 ps
R
±0.0003 ±0.003 ±0.006 ±0.008 ±2 MHz ±12 MHz ±21» MHz ±36 MHz ±15 ps
67%
77 K
2.118
33%
2.130
-i»95 MHz
-459 MHz
Table 8. ESR parameters for CuBlm.
9g
g±
^
9iso
A
I
(MHz)
A
l
(MHz)
M
(MHz)
A
iso (MHz)
T
R (ps)
*iso Room Temp.: Best fit for -1/2, +1/2, +3/2 lines
2.20
2.03
0.171
2.09
-651-7
+^8.3
-700
-185
.250
Best fit for +3/2 line
2.20
2.03
0.171
2.09
-651-7
+*»8.3
-700
-185
275
Frozen: Simulated data
2.210
2.039
0.171
2.096
-51*9
-kS.
-501
-215
132
Bulletin of Magnetic Resonance
coordination that can occur. Other authors (44) observed a temperature dependence of equilibrium between two species. Aggregation can occur (45) and often tedious empirical approaches to get good glasses must be employed. In water, freezing can change the local pH (46) and Wilson and Kivelson (47) found that the isotropic g and A values of copper acetylacetonate are actually temperature dependent. All of these complications can be avoided by exploitation of multifrequency ESR of copper complexes. What has been done thus far in this area is limited to rather small complexes that tumble sufficiently rapidly in solution that motional narrowing theory can be used. However the Freed theory of slow tumbling ESR spectra based on the stochastic Louiville equation would allow the approach to be extended to systems where the rotational correlation time is 100 times greater, permitting experiments on larger complexes and in more viscous environments. This extension will permit systems of real biological interest to be investigated. The very complex expression for the linewidths of copper complexes developed by Kivelson permits in principle by suitable detailed analysis the determination of all spin Hamiltonian input parameters. However, the dominant terms are all proportional to the rotational correlation time, Tj£, and, in the real world of noise and experimental error, the less dominant terms are extremely difficult to measure. Thus one cannot possibly obtain uniquely both the correlation time and the spin Hamiltonian input parameters. A suitable formulation of dynamic second-order shift contributions to the position of the lines of Copper are given in:
2Mt BoAyAAf/15coo - M, 2(AA)2f/9O*ol} (22)
where: AA = (A| - A I )(rad s" *), Ag = gj - g l , &Y = (Ag3e)fi, w0
=2nv0,
a = (1/3)(2A 1 +A|), u = 1/(1+W O T R 2 ), and f = w 0 2 T R 2 u, Ag, n = g, B - 2.0023. Vol. 7, No. 2/3
At low microwave frequency second-order effects have to be reconsidered, dominant terms are proportional not to r ^ but to TJ£ . If dynamic second-order shifts can be measured, then a full solution leading to a unique determination of all spin-Hamiltonian input parameters and also the rotational correlation time can be determined. From a computer simulation of dynamic shifts developed as a function of microwave frequency and rotational correlation time, it was apparent that the shifts should in fact be readily determinable. However, always in the real world systematic errors in the experiment, noise, background contamination and omission of subtle effects in the theoretical formulation makes things more difficult. What eventually was done was to extract all of the linewidths and all of the line positions with respect to DPPH at five widely varying microwave frequencies (1.19, 2.51, 3.44. 9.12 and 34.7 GHz) using a low molecular weight complex Cu(dtc)2 in toluidine at room temperature. A two step approach for determining directly at room temperature the spin Hamiltonian input parameters (gj so , a i s o , A and AA) and correlation time (TC) in the motional narrowing limit, was developed. In the first stage an interplay of experimental and algebraic approaches yielded initial values, and in the second stage these values were refined by full computer simulation of the spectra and evaluated by an objective goodness-of-fit procedure. With these values and errors a full blown comparison of simulated and experimental spectra was undertaken. All of the spectral data points were used rather than just the points corresponding to widths and positions, resulting in what must be considered excellent agreement (see Figure 7). A conscientious approach to error determination from the small residual differences was undertaken, and what is thought to be a new branch of computer aided ESR spectroscopy is introduced: "Sensitivity Analysis." Using only simulated spectra, the change in a spectrum when only one parameter is changed is studied using least squares analysis, this is done for every input parameter at every microwave frequency. Not surprisingly, high frequencies are best for Zeeman terms and low frequencies for hyperfine terms. This sophisticated analysis led eventually to the data and errors shown in Table 7. These errors are less than any others that have ever been assigned in the history of copper ESR spectroscopy of frozen solutions of copper complexes. It is noteworthy from Table 7 that magnetic parameters obtained from analysis of 133
CH, \
CH,
B. Multifrequency ESR ofCuBlm Complex in Solution CuBlm is an active antitumor agent currently used clinically whose mechanism of action has not been fully resolved (48).
J—IT-CO-TERMINAL AMINE
g i s o = 2.044"^
Figure 7. Experimental and simulated room temperature spectra for ' s Cu(dtc)2 in o-toluidine using the input parameters given in Table 7 at five different microwave frequencies (1.19, 2.50, 3.44, 9.12, 34.7 GHz).
frozen solution spectra bear little resemblance to the values obtained from liquid phase analysis, confirming our previous considerations.
134
The aim of this report is to characterize the copper complexes of Blm from the room temperature data using a strategy based on multifrequency ESR spectroscopy combined with computer simulation of the spectra. Room temperature EPR data only provide new information concerning the coordination mode of the drug to the metal ion, but provide new information concerning the dynamic motion of the complex. It has been shown that the fast tumbling theory of Kivelson can be used for copper complexes with molecular weights as high as 1600, the molecular weight of CuBlm, if an optimum frequency is available (22). It was anticipated that the ESR data for CuBlm at low frequency (4 GHz) could be analyzed by the fast tumbling theory. In addition, the intermediate size of the complex might model some of the constraints anticipated for the cupric ion bound to higher molecular weight proteins. The strategy for data analysis in the present study has been to focus on the high field lines (the +1/2 line at X-band and the +3/2, +1/2. and possibly the -1/2 line at S-band) and to use
Bulletin of Magnetic Resonance
computer simulations based on Kivelson's fast tumbling theory to determine a set of ESR parameters consistent with the room temperature data. Initial values for Ag, AA, and gj s o are taken from the frozen solution data (see Table 8). Aj so is estimated from the experimental data taken at low frequency (42) following "Sensitivity Analysis" previously discussed in Section IV.A. The correlation time r^ and each of the parameters in the calculation are systematically varied until a best fit is obtained. The configuration of the copper complex of the giycopeptide bleomycin, CuBlm, is presumed to be pyramidal square planar from a previous X-ray structural determination of a fragment of cupric bleomycin. Computer simulations of the room temperature spectrum using parameters from the frozen CuBlm data also suggest that the ESR parameters for CuBlm vary upon going from the immobile to the mobile state (Table 8). At room temperature, the fast tumbling theory appears to dominate the X-band spectrum for the +1/2 line and the S-band spectrum for the +3/2, +1/2, and possibly the -1/2 lines. A decrease in Aj so for CuBlm in the liquid state can be directly surmised from the low frequency S-band spectrum for which three of the four cupric hyperfine lines are partially resolved (Figure 8). Computer simulated spectra indicate that the absolute value of Ag increases about 100 MHz and the value of Aj^ may change sign for CuBlm in the liquid state. The parameters can be used to measure the extent of ionic bonding a) and the extent of the contact term (k) from the eqns. 23 and 24. Ag = P [ - k - 4 a 2 / 7 + (gj-2.0023) + 3^-2.0023)/?]
(23)
A x = P[-k+2a 2 11+11^-2.0023/14)1(24) where P is taken as 350 X 10" 4 cm" 1 (44). The symmetry is assumed to be tetragonal with the unpaired hole in the d ^ _ys orbital (49). A comparison of the ionic bonding (a) and the contact term (k) between the parameters emphasizes the effect of the changes in An and A^ described in Table 8. The ionic bonding increases (af rozen = 0.85 and art = 1.0) and the contact term decreases (kf rozen = 0.34 and k
R.T. = °- 25 )-
Simulations using a rotational correlation time of about 250 psec indicate that CuBlm may not be spherical in the liquid phase. Vol. 7, No. 2/3
Figure 8. S-band (3.46 GHz) (upper) and (X-band) (lower) ESR spectra for