using either support vector machines (SVMs) or neural networks for intrusion ... 3 service. Network service on the destination, e.g., http, telnet, etc. D. 4 flag.
Intrusion Detection: Support Vector Machines and Neural Networks Srinivas Mukkamala, Guadalupe Janoski, Andrew Sung {srinivas, silfalco, sung}@cs.nmt.edu Department of Computer Science New Mexico Institute of Mining and Technology Socorro, New Mexico 87801 Abstract: This paper concerns intrusion detection and audit trail reduction. We describe approaches to intrusion detection and audit data reduction using support vector machines and neural networks. Using a set of benchmark data from the KDD (Knowledge Discovery and Data Mining) competition designed by DARPA, we demonstrate that efficient and highly accurate classifiers can be built using either support vector machines (SVMs) or neural networks for intrusion detection. Further, we present SVMs and neural networks that use only the (13 of 41) most significant features of the data and deliver only-slightly-lower detection accuracy in the binary attack/normal classification. We also compare the performance of neural networks and SVMs. 1. INTRODUCTION Information assurance is an issue of serious global concern as the explosive growth in connectivity and accessibility to the Internet has created a tremendous security threat to information systems worldwide. This paper concerns intrusion detection: we present the use of support vectors machines (SVMs) and neural networks for intrusion detection. Since most of the intrusions can be uncovered by examining patterns of user activities, many intrusion detection systems have been built by utilizing the recognized attack and misuse patterns [2, 9, 10, 11]. The data we use in our experiments originated from MIT’s Lincoln Lab. It was developed for a KDD competition by DARPA and is considered a standard benchmark for intrusion detection evaluations [16]. The approach is to train support vector machines or neural networks to learn the normal behavior and attack patterns; then deviations from normal behavior are flagged as attacks. It is demonstrated that both SVMs and neural networks are capable of making highly accurate attack/normal classifications. We also perform audit data reduction by using SVMs; and show that the (binary classification) performance of SVMs and neural networks would degrade only slightly when they are trained with the reduced data. 2. THE DATA In the 1998 DARPA intrusion detection evaluation program, an environment was set up to acquire raw TCP/IP dump data for a network by simulating a typical U.S. Air Force LAN. The LAN was operated like a true environment, but being blasted with multiple attacks. For each TCP/IP connection, 41 various quantitative and qualitative features were extracted. Of this database a subset of 494021 data were used, of which 20% represent normal patterns. Attack types fall into four main categories: 1. DOS: denial of service 2. R2L: unauthorized access from a remote machine 3. U2R: unauthorized access to local super user (root) privileges 4. Probing: surveillance and other probing Table 1 below shows 32 different exploits that were used in the intrusion detection evaluation.
Table 1: Attacks in the DARPA evaluation. Attack Class
OS: Solaris
OS: SunOS
OS: Linux
Denial of Service
Apache2 Back Mail bomb Neptune Ping of death Process table Smurf Syslogd UDP storm Dictionary Ftp-write Guest Phf Xlock Xnsnoop
Apache2 Back Mail bomb Neptune Ping of death Process table Smurf Syslogd UDP storm Dictionary Ftp-write Guest Phf Xlock Xnsnoop
Eject Ffbconfig Fdformat Ps Ip sweep Mscan Nmap Saint Satan
Load module Ps
Apache2 Back Mail bomb Neptune Ping of death Process table Smurf Syslogd UDP storm Dictionary Ftp-write Guest Imap Named Phf Sendmail Xlock Xnsnoop Perl Xterm
Ip sweep Mscan Nmap Saint Satan
Ip sweep Mscan Nmap Saint Satan
Remote to User
User to Superuser
Probing
The following table shows the list of 41 features of the data. Table 2: List of features (KDD-CUP-99 task description [16]). Type C is continuous, while D is discrete. #
Feature name
Description
Type
1
duration �
Length (# of seconds) of the connection �
C�
2
protocol type �
Type of the protocol, e.g. tcp, udp, etc. �
D�
3
service �
Network service on the destination, e.g., http, telnet, etc. �
D�
4
flag �
Normal or error status of the connection �
D�
5
src_bytes �
# ofdatabytes fromsourcetodestination �
C�
6
dst_bytes �
# of data bytes from destination to source �
C�
7
land �
1 if connection is from/to the same host/port; 0 otherwise � D�
8
# of “wrong” fragments �
C�
9
wrong_fragme nt � urgent �
# of urgent packets�
C�
10
hot �
# of “hot” indicators�
C�
num_failed_log ins � logged in �
# of failed login attempts �
C�
1 if successfully logged in; 0 otherwise �
D�
# of compromised conditions �
C�
14
num_comprom ised � root_shell �
1 if root shell is obtained; 0 otherwise �
D�
15
su_attempted �
1 if “su root” command attempted; 0 otherwise �
D�
16
num_root �
# of “root” accesses �
C�
17
num_file_creati ons � num_shells �
# of file creation operations �
C�
# of shell prompts �
C�
# of operations on access control files �
C�
# of outbound commands in an ftp session �
C�
21
num_access_fil es � num_outbound _cmds� is_host_login �
1 if the login belongs to the “hot” list; 0 otherwise �
D�
22
is_guest_login �
1 if the login is a “guest’ login; 0 otherwise�
D�
23
count �
C�
24
srv_count
# connections to the same host as the current one during past two seconds # of connections to the same service as the current connection in the past two seconds
25
serror_rate �
% of connections that have “SYN” errors �
C�
26
srv_serror_rate
% of connections that have “SYN” errors
C
27
rerror_rate �
% of connections that have “REJ” errors �
C�
28 29 30 31
srv_rerror_rate � % of connections that have “REJ” errors � same_srv_rate � % of connections to the same service � diff_srv_rate � % of connections to different services � srv_diff_host_r % of connections to different hosts � ate � dst_host_count dst_host_srv_count dst_host_same_srv_rate
C� C� C� C�
11 12 13
18 19 20
32 33 34 35 36 37 38 39 40 41
dst_host_diff_srv_rate
dst_host_same_src_port_rate dst_host_srv_diff_host_rate dst_host_serror_rate dst_host_srv_serror_rate dst_host_rerror_rate dst_host_srv_rerror_rate
C
C C C C C C C C C C
3. IDS USING SVMs Support vector machines, or SVMs, are learning machines that plot the training vectors in highdimensional feature space, labeling each vector by its class. SVMs classify data by determining a set of support vectors, which are members of the set of training inputs that outline a hyper plane in the feature space [12].
SVMs provide a generic mechanism to fit the surface of the hyper plane to the data through the use of a kernel function. The user may provide a function (e.g., linear, polynomial, or sigmoid) to the SVMs during the training process, which selects support vectors along the surface of this function. The number of free parameters used in the SVMs depends on the margin that separates the data points but not on the number of input features, thus SVMs do not require a reduction in the number of features in order to avoid over fitting--an apparent advantage in applications such as intrusion detection. Another primary advantage of SVMs is the low expected probability of generalization errors. There are other reasons that we use SVMs for intrusion detection. The first is speed: as real-time performance is of primary importance to intrusion detection systems, any classifier that can potentially run “fast” is worth considering. The second reason is scalability: SVMs are relatively insensitive to the number of data points and the classification complexity does not depend on the dimensionality of the feature space [14], so they can potentially learn a larger set of patterns and thus be able to scale better than neural networks. Once the data is classified into two classes, a suitable optimizing algorithm can be used if necessary for further feature identification, depending on the application [14]. 3.1 Experiments Using SVMs We partition the data in to two classes: normal and attack, where the attack is the collection of all 22 different attacks belonging to the four classes described in section 2. The objective of our SVM experiments is to separate normal and attack patterns. In our case all attacks are classified as +1, and normal data classified as -1. In all experiments described below the freeware package SVM light [13] is used. For data reduction, we also apply SVMs to identify the most significant features for detecting attack patterns [5]. The procedure is to delete one feature at a time, and train SVMs with the same data set containing 40 features; those features whose deletion result in more accurate performance (as compared to the original SVM trained with 41 features) is deemed insignificant. This way, 13 of the 41 features are identified as most significant: 1,2,3,5,6,9,23,24,29,32,33,34,36. 3.2 Training In our first set of experiments, the processed data consists of 65000 randomly selected data points. We composed two training sets containing the same 10000 data points with, respectively, 41 features and 13 features each. (The 10000 data points are randomly generated, and include a subset of data points from each of the 23 classes in proportion to the relative size of the 23 classes). Data points are randomly generated and contain actual attacks and normal usage patterns. Training is done using the RBF (radial bias function) kernel option; an important point of the kernel function is that it defines the feature space in which the training set examples will be classified [13]. In our second set of experiments, the data consists of 14000 randomly generated points, with a number of data from each class in proportion to its size. We used a training set of 7000 data points with, respectively, 41 features and 13 features [16] each. The results are summarized in the following table. 3.3 Testing In our first set of experiments, the test set consists of 55000 data points (with, respectively, 41 features and 13 features). In our second set of experiments, the test set consists of 7000 data points with 41 features and 13 features. Results are given in table 4.
Table 3: SVM training results. Training results
Experiment 1
Experiment 2
Data set Training set # of features Kernel Gamma value C value CPU run time # of misclassifications
65000 10000 41 RBF 0.000001 1000 126.94 sec 23
65000 10000 13 RBF 0.000001 1000 211.34 sec 32
# of iterations Max difference # of Support vectors
30387 0.00096 249 (79 at upper bound)
25807 0.00099 205 (129 at upper bound)
Liner loss Normalization of weight vector # of kernel evaluations
57.38954 175.79429
93.9988 220.61209
6673531
7248374
Training results Data set Training set # of features Kernel Gamma value C value CPU run time # of misclassifications
Experiment 3 14000 7000 41 RBF 0.000001 1000 52.02 sec 15
Experiment 4 14000 7000 13 RBF 0.000001 1000 108.62 sec 22
# of iterations Max difference # of Support vectors
11605 0.00099 209 (53 at upper bound)
23766 0.00095 163 (92 at upper bound)
Liner loss Normalization of weight vector # of kernel evaluations
40.45970 159.75859
65.25182 203.82591
3798517
4358680
Table 4: SVM testing results. Testing Test data set # of features Accuracy % CPU run time
Exp 1 55000
Exp 2 55000
Exp 3 7000
Exp 4 7000
41 99.60 15.44
13 99.57 10.04
41 99.53 1.60
13 99.52 1.06
# of mis-classifications
230
234
33
35
# of false positives
122
102
17
19
# of false negatives
98
132
16
15
Table 5: Results of the main test set with 41 features and 55000 data points.
Class
Normal
Attack
Accuracy
Normal
10767
122
98.9 %
Attack
98
44013
99.7 %
Accuracy
99.7 %
99.9 %
The top-left entry of Table 5 shows that 10767 of the actual “normal” test set were detected to be normal; the last column indicates that 98.9 % of the actual “normal” data points were detected correctly. In the same way, for the attack class 44013 of the actual “attack” test set were correctly detected; the last column indicates that 99.7% of the actual “attack” data points were detected correctly. The bottom row shows that 99.7% of the test set said to be “normal” indeed were “normal” and 99.9% of the test set classified as “attacks” indeed were attacks.
Comaprison of SVM's 2.5
Class
2 Actual
1.5
SVM 13 1
SVM 41
0.5
31
28
25
22
19
16
13
10
7
4
1
0 Data points
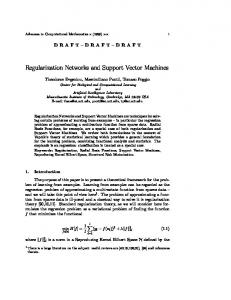
Fig. 1. Comparison of SVMs using 41 and 13 features for detection. An output of 2 indicates attack; 1 indicates normal data. 4. IDS USING NEURAL NETWORKS Using neural networks for intrusion detection has been done in the security community [1,4, 7,8,10,11]. Comparison of NN's 2.5
Class
2 NN 13
1.5
Actual 1
NN 41
0.5
31
28
25
22
19
16
13
10
7
4
1
0 Data points
Fig. 2. Comparison of Neural networkss using 41 and 13 features for detection For performance comparison with SVMs, the objective of our neural network experiments is to make binary normal/attack classification.
4.1 Training the Neural Network In our experiments, we use a dataset consisting of 14000 randomly generated data points from the 2 classes of attack and normal. From this dataset, we then randomly select a subset of 7000 data for training; and prepare two training sets, with 41 features and 13 features each, respectively. A multi-layer, feedforward network was trained using the scaled conjugate gradient decent algorithm with convergence criterion set to be MSE (mean square error) of 0.001. During the training process of using 41features, the goal was met in 538 epochs with MSE=0.000999; Using 13 features, the goal was reached in 608 epochs with MSE=0.000638. Table 6: Neural network training. Training
Experiment 1
Experiment 2
# of features # of data points Architecture Performance Epochs CPU time
41 7000 [41,50,40,1] 0.000999 538 30 min
13 7000 [13,40,40,1] 0.00638 608 38 min
4.2 Testing the Neural Network The test set consisting of 7000 data points with 41 features and 13 features. The one with 41 features received 99.48% accuracy and the one with 13 features received 99.41%. The following graph gives a comparison of the neural network detection performance using 41 and 13 features. Table 7: Neural network testing. Training
Experiment 1
Experiment 2
# of features # of data points Architecture Performance Epochs CPU time
41 7000 [41,50,40,1] 0.000999 538 30 min
13 7000 [13,40,40,1] 0.00638 608 38 min
5. PERFORMANCE COMPARISON Figure 4 shows the combined results of neural networks and support vector machines on the KDD data subset, using 41 and the 13 most significant features. Only a tiny fraction of the dataset is shown here to illustrate the very infrequent cases where SVMs and neural networks give different classifications, due to the fact that both SVMs and neural networks have been trained to deliver highly accurate results, in either the 41- or 13-feature case. To summarize, SVMs consistently (either 41 or 13 features) outperform neural networks, in terms of training time and accuracy of detection. Even though the margin in accuracy is small and may not be statistically significant, there is an order of magnitude in the difference of training times. SVMs (respectively, neural networks) trained with the 41-feature data set consistently outperform that trained with the 13-feature data set. But, again, the difference is small and may not be significant.
Comparison of NN's and SVM's
Class
2.5 2
Actual
1.5
NN 13 NN 41
1
SVM 41
0.5
SVM 13
31
28
25
22
19
16
13
10
7
4
1
0 Data points
Fig. 3. Neural network and SVMs testing on two classes attack/normal data. 6. CONCLUSIONS We have performed a number of experiments to measure the performance of support vector machines and neural networks in intrusion detection, using the DARPA data for intrusion evaluation. All classifications were performed on the binary (attack / normal) basis. Both SVMs and neural networks deliver highly-accurate (99% and higher) performance, with SVMs showing slightly better results. Further, when a reduction is performed to reduce the 41 features to the 13 most significant, both SVMs and neural networks again were able to train to deliver accurate results. Our ongoing experiments include making 5-class (4 attack classes plus normal) and 23-class (22 specific attacks and normal) identification using SVMs and neural networks. Even though SVMs are limited to making binary classifications, their superior properties of fast training, scalability and generalization capability give them an advantage in the intrusion detection application. Finding cost-efficient ways to speed up or parallelize the multiple runs of SVMs (to make multi-class identification) is also under investigation. 7. REFERENCES [1] Ryan J, Lin M-J, Miikkulainen R (1998) Intrusion Detection with Neural Networks. Advances in Neural Information Processing Systems 10, Cambridge, MA: MIT Press [2] Kumar S, Spafford EH (1994) An Application of Pattern Matching in Intrusion Detection. Technical Report CSD-TR-94-013. Purdue University [3] Luo J, Bridges SM (2000) Mining Fuzzy Association Rules and Fuzzy Frequency Episodes for Intrusion Detection. International Journal of Intelligent Systems, John Wiley & Sons, pp 15:687703 [4] Demuth H, Beale M (2000) Neural Network Toolbox User’s Guide. MathWorks, Inc. Natick, MA [5] Sung AH (1998) Ranking Importance of Input Parameters Of Neural Networks. Expert Systems with Applications, pp 15:405-411. [6] Cramer M, et. al. (1995) New Methods of Intrusion Detection using Control-Loop Measurement. Proceedings of the Technology in Information Security Conference (TISC) ’95. pp 1-10 [7] Debar H, Becke M, Siboni D (1992) A Neural Network Component for an Intrusion Detection System. Proceedings of the IEEE Computer Society Symposium on Research in Security and Privacy [8] Debar H, Dorizzi B (1992) An Application of a Recurrent Network to an Intrusion Detection System. Proceedings of the International Joint Conference on Neural Networks. pp 78-483
[9] [10] [11] [12] [13]
[14] [15] [16]
Denning D (Feb 1987) An Intrusion-Detection Model. IEEE Transactions on Software Engineering, Vol. SE-13, No 2. Ghosh AK. (1999). Learning Program Behavior Profiles for Intrusion Detection. USENIX Cannady J. (1998) Artificial Neural Networks for Misuse Detection. National Information Systems Security Conference Vladimir VN (1995) The Nature of Statistical Learning Theory. Springer, Berlin Heidelberg New York Joachims T (2000) SVMlight is an implementation of Support Vector Machines (SVMs) in C. http://ais.gmd.de/~thorsten/svm_light/ . University of Dortmund. Collaborative Research Center on 'Complexity Reduction in Multivariate Data' (SFB475) Joachims T (1998) Making Large-Scale SVM Learning Practical. LS8-Report, University of Dortmund, LS VIII-Report Joachims T (2000) Estimating the Generalization Performance of a SVM Efficiently. Proceedings of the International Conference on Machine Learning, Morgan Kaufman http://kdd.ics.uci.edu/databases/kddcup99/task.htm