Journal of Advances in Computer Research Quarterly ISSN: 2008-6148 Sari Branch, Islamic Azad University, Sari, I.R.Iran (Vol. 4, No. 3, August 2013), Pages: 83-101 www.jacr.iausari.ac.ir
Intrusion Detection System in Computer Networks Using Decision Tree and SVM Algorithms Zeinab Kermansaravi 1* , Hamid Jazayeriy1,2, Soheil Fateri1 (1) Computer Engineering Department, Islamic Azad University, Babol Branch, Babol, Iran (2) Electrical and Computer Engineering Department, Noshirvani University of Technology, Babol, Iran
[email protected];
[email protected];
[email protected] Received: 2013/04/17;
Accepted: 2013/06/05
Abstract Internet applications spreading and its high usage popularity result in significant increasing of cyber-attacks. Consequently, network security has become a matter of importance and several methods have been developed for these attacks. For this purpose, Intrusion detection systems (IDS) are being used to monitor the attacks occurring on computer networks. Data mining Techniques, Machine Learning, Neural networks, Collective Intelligence, Evolutionary algorithms and Statistical methods are some of algorithms which have been used for classification, training and reviewing detection accuracy with analysis based on the standard datasets in Intrusion Detection Systems. In this Paper, the hybrid algorithm is introduced based on decision tree and support vector machine (SVM) using feature selection and decision rules to apply on IDS. The main idea is to use the strengths of both algorithms in order to improve detection, enhance the accuracy and reduce the rate of error detection of the results. In this algorithm, the best features are selected by SVM, afterwards decision tree is used to make decisions and define rules. The results of applying proposed algorithm are analyzed on the standard dataset KDD Cup99. The proposed method guarantees high detection rate which is proved by simulation results. Keywords: Intrusion Detection System, Clustering, Decision Tree, Support Vector Machine
1. Introduction Nowadays, the use of networks and especially the Internet has become a big part of daily life and because of its availability and integrity, has met many people requirements like handling of finance, trade, sales, business, research and academic affairs, news and entertainment and it has created a huge change in modern life. This way, people can carry out their essential tasks with less waste in cost and time. For this purpose, each individual is required to use internet applications such as websites, emails and etc. Moreover, with technology advances and the emergence of computer it is now possible to remote managing and control of resources and information. Besides, the internet has provided a gateway for entry and access to any information in any branch. In this context, organizations face problems of maintaining and protecting their information, availability and reliability, and thus obtain confidential and distinguished information which are accompanied with major challenges. Thus, intrusion motivation was created for people who are interested in gaining unauthorized access in computer 83
Intrusion Detection System in Computer …
Z. Kermansaravi, H. Jazayeriy, S. Fateri
networks to achieve confidential information like the benefits of attracting customers in similar businesses. It is obvious that the more usage of internet, the more risk of network attacks [1-3]. To deal with the risks of network attacks, several methods such as user authentication systems, symmetric and asymmetric encryption, avoiding programming errors, firewalls and highly complex security protocols have been designed as the first line of defense for computer security. But considering some cases is necessary. For example, when a weak password is selected, authentication system cannot prevent unauthorized entry, or system firewalls, which are often in between two or more computer networks, have been placed to stop attacks, due to being vulnerable against configuration errors, being uncertainty and lack of definition for security policies cannot be enough alone to secure a network. On the other hand, programming errors also cannot avoid the complexity of algorithms and systems, meanwhile application are developing rapidly, it is easily expected that computer systems will remain insecure in the future. Integrity, confidentially and availability are three features which are called security signs. Given that, the previous methods do not have an ability to deal with attackers and each of them have proven their inefficiency and vulnerability, therefore the use of intrusion detection system become a necessity as an additional mechanism in the defenses last line [2, 4-7]. Intrusion detection systems are designed to identify unauthorized access, manipulating or disabling of computer systems. These systems, by observing and analyzing the behavior, reviewing the internet attacks, sending real-time alarms to report before the outbreak of the attacks risk and implementing measurements for the corresponding response, dramatically reduce the probability of large damages. The system is designed to monitor and control all events in the computers or network systems and its structure generally has three following main sections: 1. Data collection: the collected data can be separated from the host, network or applications. 2. Analysis engine: analysis engine is able to analyze every signs or symptoms of intrusion. 3. Response to actions taken after analysis, records the results, send real-time alarm and adjust the intrusion detection system [2, 3, 5-8]. In recent years, many works are done for attacks classification which the most acceptable has been presented by Kendall [9]. According this classification, attacks are placed in one of four following categories: • Probing: the attacks in which attacker with scanning the port or network address, checking the network traffic and possession a map of available machines and services, gathers the information or finds the recognized damages for more intrusion. These researches are very valuable for the attacker, because they can use this information to identify and follow the network’s weak spots (such as nmap, saint, ipsweep, portsweep and etc). • Denial of Service (DoS): In this type of attack, the attacker occupies excessive computing resources or it makes unavailable memory resources which are fully handled legally users requests, or it reduces and in some cases it completely stops the usage of system or a particular service (such as smurf, apache2, pod, land, mail, back, neptune, teardrop and etc.)
84
Journal of Advances in Computer Research
(Vol. 4, No. 3, August 2013) 83-101
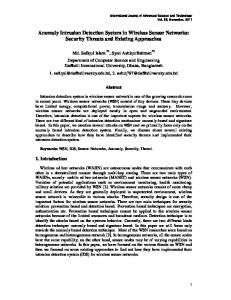
• User to Root (U2R): The attacker aims to gain higher access to the system using exploitation of vulnerabilities in operating systems or applications. Here the attacker has a normal user account. In this type of attack, an attacker begins its work with access to a normal user account (ability of access to track the password, attack and etc) and then by exploiting the vulnerability of network will become a root user (such as rootkit, perl, buffer_overflow, landmodule and etc). • Remote to Local (R2L): The attacks which try to gain local access as a user’s machine from outside of the network with sending packets over the network and misusing from some of damages. The attacker does not have an account on the remote machine. It sends the packets to network and it uses the networks vulnerabilities to gain local access as the machine user (such as xLock, send-mail, imap, worm, phf, guess_passwd, ftp_write, multihop, warezclient, warezmaster, etc.). Figure 1 shows some of the attacks. Attack Type Probing
DoS
U2R
R2L
Attack Name Ipsweep Nmap Portsweep Satan Back Land Neptune Pod Smurf Teardrop Rootkit Perl Loadmodule Buffer-overflow ftp-write Spy Phf guess-passwd Imap Warezelient Warezmaster Multihop
Figure 1: classification of attacks in the dataset KDD cup99 [8]
Lazarevic et al have presented wider classification for attacks according to which a new branch is intended for the applications which are repeated on the host machine and propagated via network. This new branch includes applications such as viruses, worms and Trojans [8-11]. Many analysis techniques have been used for intrusion detection systems. Statistical models, neural networks, Bayesian networks, fuzzy logic, Collective Intelligence and data mining algorithms are cases which are able to detect the attacks to the extent. Generally, there are three methods to solve this problem. Identification problem can be solved by an individual machine learning algorithms. In studies, many of machine learning techniques are used such as K nearest neighbors, SVM, neural networks, self 85
Intrusion Detection System in Computer …
Z. Kermansaravi, H. Jazayeriy, S. Fateri
organized mapping, fuzzy logic, genetic algorithms, detection trees and many other techniques. Methods that use this algorithm to solve intrusion detection system are called individual classifiers. In development of an intrusion detection system, the ultimate goal is to achieve the best possible accuracy. This purpose naturally leads to design combined approaches to solve problems. The idea behind the hybrid classifiers is combining several machine learning algorithms to significantly improve system performance. In other words, it is kind of combining two children from two different parents. After some time, the ensemble classifiers were proposed to improve classifications performance compared to individual classifiers. These models are applied in parallel on additional methods which make an individual output from multiple outputs. The “ensemble” term is called the combination of multiple weak learning algorithms. The weak learner has learned on training samples in order to improve all performances significantly. Studies show that all hybrid algorithms has a high detection rate and accuracy until 95%, while effective reduction of dataset’s features not only reduces the speed of information processing but also has a significant impact on increasing the detection rate. Previous researches indicate that all the proposed hybrid algorithms which applied after feature reduction have more accurate results. Former studies suggest that SVM and decision tree (DT) algorithms have been one of the most efficient algorithms for solving this problem [2, 5, 12, 13]. Therefore, in this implementation after feature reduction step and choosing the suitable feature, the hybrid algorithm of SVM and DT is used to increase the detection accuracy. After the preprocessing step which applied on KDD Cup99 standard dataset, initialing parameters and preliminary solution, several algorithms are used to select features with the best accuracy of test data, then some decision rules are defined to increase the accuracy of test data and the parameters are optimized. In the next step, the accuracy of test data are evaluated based on defined rules and so it is continued until the best features which have the best rules are selected with maximum accuracy. In this study, the proposed method is the hybrid of SVM and DT algorithms which is used to select features and decision rules. In the preprocessing step, SVM is used to increase the processing speed and decrease the complexity of DT algorithm. The proposed method decreases the size of dataset by selecting the best features with higher qualifications. This way, the processing speed and performance of SVM are dramatically increased. The main idea of the proposed method is using the strengths points of SVM and DT algorithms to improve the detection rate and enhance the results accuracy. So that the best features are selected by applying the SVM, then DT is used to create and define decision rules. Meanwhile set the parameters of these algorithms reduce the search time and increase learning, using the other algorithms leads to improve the accuracy of intrusion detection. The remainder of the paper is organized as follows. A brief description of intrusion detection systems is given in section 2. The two used algorithms are described in section 3. An overview of KDD Cup99 is done in section 4. The proposed algorithm is discussed in section 5 and eventually the simulation results are explained and compared in section 6. 2. Intrusion Detection System (IDS) IDSs are used as an additional mechanism to monitor the occurred attacks in computer networks. For the first time, the concept of IDSs was proposed in a technical 86
Journal of Advances in Computer Research
(Vol. 4, No. 3, August 2013) 83-101
report by Anderson in 1980. Anderson’s theory was based on the hypothesis that the computers’ revision mechanism must be transformed and should be able to detect internal treats and security behaviors. While, the statistical methods must be used to analyze users behavior and detect deformed accesses which are unauthorized to access the systems’ sources. In 1987, Dorothy was proposed a prototype of IDS called Intrusion Detection Expert System (IDES). After that, IDS become known gradually and several models are developed such as Discovery, Hay Stack, MIDAS, NADIR, NSM, Wisdom and sense, DIDS and etc [2-3,8]. There are two ways to categorize IDSs. One method is based on different data sources through which IDSs are divided in two categories called Host-based IDS and Network-based IDS. The other method which is based on different analysis methods that accordingly is divided into anomaly detection and misuse detection that also called signature based detection, that are defined as follows: Host-based IDS, by surveying current audit records such as system logs, application programs information and comparison with corresponding profiles determines if a record is deviated from the normal pattern then the network intrusion occurred. For example, Windows NT operating system, the system event log mechanism is composed of three patterns of system events: operating system events, security events and application events such as database systems, WWW servers and etc this IDS has many advantages and disadvantages which are listed in the following categories: Advantages: 1. These systems because of using data which obtained from the system audit records and system logs in comparison with network-based IDS have more accurate judgment on network attacks and intrusion detection. 2. On the other hand, because the encryption of data which is received from the file system and decoded on network hosts, that is why data is not affected in anyway. This system can detect attacks which are encrypted under the network environment. 3. This system does not requires additional hardware and it is only depends on the host where it is installed locally. Disadvantages: 1. IDS under monitored mode may occupy system resources, thus there is a possibility of a negative impact on the hosts’ productivity. 2. Since the monitoring systems must be installed on each host system and according to being different review files and different patterns for each system, therefore different IDSs are required for each system and thus the cost will go up. Network-based IDS, inspects data which collected from general network stream like internet packages. Hosts and even network protocols are vulnerable for reasons such as IP spoofing, port scanning and etc. Advantages: 1. This system because of detecting all attacks on the local area network (LAN) and its’ cost is only for devices, has a lower cost. 2. The system can detect attacks like Dos which are not detected by host-based IDS. 3. This system is designed to protect computer networks and its’ installation can reduces intrusion detections’ task load on each host. Disadvantages:
87
Intrusion Detection System in Computer …
Z. Kermansaravi, H. Jazayeriy, S. Fateri
1. Systems’ changeability and variability is very high and it is maybe happened that a lot of internet packages are lost due to the high number of packets and thus all packages cannot be detected. 2. In large scale networks, for analyzing the bulk data demands faster Cpu and more memory space. 3. The system due to cope with encrypted packets is not able to receive the information of them. In anomaly IDS, intruders profile is compared with the normal users’ profile. If the offset is higher than the threshold, user behavior is considered abnormal. In this method, it is assumed that intruders’ behavior always reflects the deviation from the normal user behavior. Advantages: 1. The detection rate is very high. This system is superior to signature detection system and it is able to detect attacks even when there is no detailed information about the attack. 2. This system is able to detecting new and unknown attacks. 3. These systems can be used to obtain signature information which used for Misuse IDS. Disadvantages: 1. There is a high miss-judgment rate, because usually users and networks behavior is not predetermined. 2. Anomaly detection approach requires a large set of learning data which contains system logs in order to create a normal users’ profile. 3. This system does not correctly detect known attacks which are similar to the normal user profile [3, 4, 6, 14, 15]. These systems also divided in two categories: static and dynamic. Static anomaly detection system is based on the assumption that part of the system which responsible for monitoring does not change. This type of systems is usually addressing the part of systems software and it is based on the assumption that the systems’ hardware does not need to be checked. The static part of system is a system code and data constants which the system performance is depend on. For example, operating system software and computers’ drive data do not ever change. If the static part of system has deviated from its normal form, an error has occurred or an intruder has changed static part of system. In general, it can be claimed that the anomaly detector is focused on reviewing the integrity. Dynamic anomaly detection is monitored on network traffic and audit records. Os audit records do not record all events and the only records are recorded which the results of an event occurring. These events may occur as a sequence [15, 16]. Misuse IDS are matching the stored activities with attacker’s activities continuously. For this purpose, each behavior will be modeled. In fact, these systems used a predefined knowledge to detect attacks. This method has very little capacity to detect the unknown attacks and the attacks’ database should be updated regularly. Advantages: 1. These systems are very convenient for detect attacks which do not have a false alarm. 2. The system can detect quickly the techniques and influence tools which designed specially. Disadvantages:
88
Journal of Advances in Computer Research
(Vol. 4, No. 3, August 2013) 83-101
1. The system only recognizes new attacks and unknown ones which are trained as an attack. Therefore, the system should always be updated with new attacks and it is considered as the biggest disadvantage of this method. 2. These systems are designed to detect attacks which have defined signature. When a known attack has a little change and various attacks are obtained from, system cannot detect the same attack [2, 3, 6, 14-16]. 3. Used Algorithms 3.1. Decision Tree
Decision tree is one of the classification algorithms in data mining. This algorithm was written jointly in 1984 by L. Breiman, J. Friedman, R. Olson and Ch. Stone which is brought an important step forward in the field of artificial intelligence, learning systems, non-parametric statistics and data mining. Clustering algorithms are trained inductively to build a model from the pre-defined data sets. Inductive learning means making general assumptions from specific examples and it used in order to classify obscure data using assumption. The model of inductive learning algorithms for classification is known as clustering. A classifier may be considered as a mapping of features set to a special class. Data are defined by their feature values and X is a vector of values {x1, x2, x3… xn} where the values are numeric or nominal. Feature space is defined as the set of all possible vectors and is shown by Z. Therefore, X is an element of Z. Decision tree is classified received data based on their feature values. In the beginning, decision tree is made from pre-classified data. The most important issue for selecting features which have the best samples is divided them into different classes. This process is applied recursively on each divided subset lf data. The process ends when all the data in existing subset are assigned to the same class. Decision trees’ mechanism goal is not to only make a tree, but also to produce a series nested modified trees which all of them are optimized candidates. Decision tree is done the following recursively: 1. Calculating obtained information for each feature 2. Feature with the highest information is selected as a feature which the division operation will be performed on it. 3. If the selected feature is discrete, the corresponding node is derived to all possible values. If the selected feature is continuous, one cut point is selected with the highest obtained information. 4. After segmentation, it is considered that a new node is leaf or not (data are belonging to the same type), otherwise the new node will be sub trees’ root. 5. All the above steps are repeated until all new nodes are leaves. The main problem here is the decision about features which the best division is done in their corresponding class. Decision tree has various algorithms, some of them include: ID3 (is introduced in 1986 by Quilan), C4.5 (is introduced in 1993 by Quilan) and C5.0. C4.5 algorithm is developed ID3 [4, 11]. The decision tree algorithm has many merits and demerits. Decision tree reveals all the relations between rules, thus it makes understanding the data structure easy, it describes generated rules and all existing classes in the training data. It has simple calculations. It is possible to produce very complex rules as a result pruning be along
89
Intrusion Detection System in Computer …
Z. Kermansaravi, H. Jazayeriy, S. Fateri
with difficulties. Decision tree is able to produce a number of related rules that if pruning techniques are not used; they will be hard to understand. Finally, a huge memory is required in order to store the entire tree and mining the rules [1, 3]. 3.2. Support Vector Machine
In today’s’ usage of machine learning, support vector machine is known as one of the strongest and most accurate methods in the machine learning algorithms. SVM is one of the supervised learning methods which used for classification, prediction and regression. This method is a relatively new approach that in recent years has shown good performance for classification compared to older methods like perceptron neural networks and it is fairly simple as well. This algorithm was introduced in 1998 by Vapnik [2, 10]. SVM due to its good ability to generalize and being superior to other algorithms in classification and regression is very popular. SVM in principle is designed for binary classification; hence its process forward to solve the existing classification problems between normal and abnormal or suspicious behavior is suitable in follow pattern audit [1, 10]. SVM is a machine learning that plots learning vectors in high-dimensional feature space and labels each vector to its corresponding class. The work based of SVM classifier is linear data classifier and in data linear division the most important issue is that the line should be selected which has a more confident margin. Finding the optimal line equation for data is solved with QP methods which are well known in solving constraint problems. Before linear division operation to making ability for machine to classify the high complexity data, the data should be moved to a higher dimension space using Phi function. The problem with high dimension using this method can be solved by using Lagrange binary theorem to convert the desired minimum problem to its binary form. This way instead of using a complex function called Phi, the simpler function called kernel function can be used which is a multiplication vector of Phi. The process of development SVM model acts as follows and has three steps: data preprocessing, model development, model extraction and finally implementation. The algorithm is scalable and is relatively insensitive to the number of data; therefore the complexity of clustering does not depends on the features space dimensions. Hence, a large set of models can be learned in the better scale compared to neural networks [1, 3, 17]. The algorithm is developed based on the structure of risk minimization. This algorithm is very effective in many applications and it has been very successful. Consider the learning pattern as the following: ( , ), … , ( , ), ∈ , ∈ {−1, +1} Where, is the number of learning patterns, is the number of dimensions, is an input data and is an output. SVM uses the optimal separated hyper plane to create a classifier with the highest limit (w), an auxiliary variable ( ) and a real value (b). SVM can solve the following primary problem: Min.F (w,b, ) = ‖ ‖ + C ∑
s.t. (〈 . 〉 + ) ≥ 1 − ,
(
≥0
(1)
Where > 0 is a penalty parameter. The Lagrange polynomials combination time) by equation (1) produces the following two equations: 90
Journal of Advances in Computer Research
( )=
s.t.0 ≤
≤ ,
−
1 2
∑
,
=0
(Vol. 4, No. 3, August 2013) 83-101
〈 . 〉
(2)
≥ 0، is indicated Lagrange polynomials. The input data . is computed by using the kernel function 〈 , 〉 = , and then equation (2) is changed as the following: ( )= ∑
−
∑,
( , )
(3)
Some of the kernel functions which are used included: linear functions, polynomials, Sigmoid and Radial Basis Function (RBF). RBF function is one of the kernel functions, which is highly used in SVM, because it can manipulate the information and data with high dimension. RBF function equation is as follows: ,
=
−
(4)
Two parameters called C and should be set in SVM approximately. When C is set too large, the accuracy on learning level will be very high and on test level will be very low. In addition parameter completely has an impact on the classification performance. Improper too small value of may lead to under-fitting and its improper too large value may lead to over-fitting [8]. SVM has considerable benefits in terms of practical and functional but it also has some limitations which one of the most important of them is selecting the kernel function parameters. The second limitation is related to the size and speed of the algorithm (both in training and testing). SVM is required a complex and time consuming computations. One solution is dividing a large optimization problem in to a series of smaller problems. In which each problem contains a carefully selected pair of variations that can be very effective for solving the problem. This process continues until all the decomposed parts will be solved. Perhaps the most serious demerits of this method are the complexity of their algorithms, requiring to a lot of memory and needing discrete data for process. Nevertheless, SVM has a coherent structure and the results which produced by them are general and unique. It is proved that the SVM due to its high speed is a good candidate for intrusion detection. [1, 10] 4. Dataset KDD Cup99 Providing input data is the first step of data mining method in every IDS. Such data are provided by different methods from various resources. To detect the anomalous behavior in network (not in host), the best resource we have is the network traffic which is the sending packets between the origin and the destination. In KDD Cup 99 dataset, the network traffic of the host or the network is collected. There are 494020 samples and 41 features registered in this standard dataset which are listed in table 1.
91
Intrusion Detection System in Computer …
Z. Kermansaravi, H. Jazayeriy, S. Fateri
Table 1: KDD Cup 99 dataset features [15, 18] No. 1 2 3 4 5 6 7 8 9 10 11 12 13 14 15 16 17 18 19 20 21 22
Feature Name Duration protocol_type Service Flag src_bytes dst_bytes Land Wrong_fragment Urgent Hot Num_failed_logins Logged_in Num_compromised Root_shell Su_attempted Num_root Num_file_creations Num-shells Num_access_files Num_outbound_cmds Is_hot_login Is_guest_login
Data Type Continuous Discrete Discrete Discrete Continuous Continuous Discrete Continuous Continuous Continuous Continuous Discrete Continuous Discrete Discrete Continuous Continuous Continuous Continuous Continuous Discrete Discrete
23
Count
Continuous
24
Srv_count
Continuous
25
Serror_rate
Continuous
26
Srv_serror_rate
Continuous
27
Rerror_rate
Continuous
28
Srv_rerror_rate
Continuous
29
Same_srv_rate
Continuous
30
Diff_srv_rate
Continuous
31
Srv_diff_host_rate
Continuous
32
Dst_host_count
Continuous
33
Dst_host_srv_count
Continuous
34
Dst_host_same_srv_rate
Continuous
35
Dst_host_diff_srv_rate Continuous Dst_host_same_src_port_r Continuous ate Dst_host_srv_diff_host_rat Continuous e
36 37 38
Dst_host_serror_rate
Continuous
39
Dst_host_srv_serror_rate
Continuous
40
Dst_host_rerror_rate
Continuous
41
Dst_host_srv_rerror_rate
Continuous
Description Length of Connection Connection protocol Destination Service Status Flag of the Connection Bytes Sent from Source to Destination Bytes Sent from Destination to Source 1 if connection is from/to the same host/port; 0 otherwise Number of Wrong Fragment Number of Urgent Packets Number of Hot Indicators Number of Failed Login Attempts 1 if successfully logged in; 0 otherwise Number of Compromised Conditions 1 if root shell is obtained; 0 otherwise 1 if “su root” command attempted; 0 otherwise Number of Root Accesses Number of File Creation Operations Number of Shell Prompts Number of Operations on Access Control Files Number of Outbound Commands in an ftp Session 1 if the login belongs to the hot list; 0 otherwise 1 if the login is a guest login; 0 otherwise Number of connections to the same host as the current connection in the past two seconds Number of connections to the same service as the current connection in the past two seconds (sameservice connection) % of connections that have “SYN” errors (same-host connections) % of connections that have “SYN” errors (same-service connections) % of connections that have “REJ” errors (same-host connections) % of connections that have “SYN” errors (same-service connections) % of connections to the same service (same-service connections) % of connections to different services % of connections to different hosts (same-service connections) Count of connection having the same destination host % of connections having same destination host and using same service % of connections having same destination host and using same service % of different services on the current host % of connections to the current host having the same src port % of connections to the same service coming from different hosts % of connections to the current host that have an S0 error % of connections to the current host and specified service that have an S0 error % of connections to the current host that have an RST error % of connections to the current host and specified service that have an RST error
92
Journal of Advances in Computer Research
(Vol. 4, No. 3, August 2013) 83-101
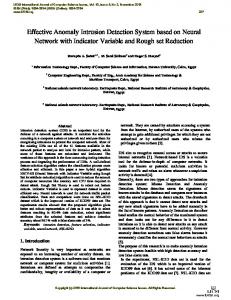
The KDD Cup99 dataset features can be classified into three categories: 1. Basic features: this capsulated category has shown all features which can be exploited from a TCP/IP connection. Most of these features lead to delay in implied detection. 2. Traffic features: this category includes features calculated based on similar factors in a certain time period. It is divided into two groups: A) same host features: this system investigates the last two seconds connections. Each host with same destination is considered as a current connection and the statistics related to behaviors, services, protocols and etc are calculated: B) Same service features: these features also investigate the last two seconds connections which have the same services as the current connections. 3. Content features: unlike most attacks of DOS and Probe, there are not any repeated intrusion and sequential patterns on U2R and R2L attacks which is because of the fact that DOS and Probe attacks have a lot of connections to some hosts in a short period. To identify such attacks, some features (e.g. unsuccessful entrances) have been considered that were able to show the suspicious behavior. These features are called content features. KDD Cup99 is widely used as a reliable dataset in design and implementation of IDS. Each record in this dataset has 41 features. Generally, features have three forms including continuous, discrete and symbolic which have different range of values. In this dataset, there are four main detected attacks, as well, outside of these classes some packets have normal value and the others are unidentified attacks [18]. 5. Proposed algorithm The proposed algorithm includes the following steps: 1. Preprocessing 2. Using SVM to select the proper features 3. Applying ID3 classifier based on selected features General structure of the designed intrusion system has been illustrated in figure 2.
Figure 2: general structure of proposed system
Preprocessing is the first and most important step in utilizing data mining tools. To achieve the most accurate results from data mining algorithms, discovering hidden knowledge process should be performed in dataset. In this algorithm, the data should be discrete in order to entering the data into the LibSVM algorithm. To implement the SVM, each data points should be demonstrated by a vector containing real numbers. For a feature with m rows, m numbers are used and only one of these m numbers is equal to 1 and the rest are 0. Therefore, the Discretize algorithm has been used. Scaling the data before implementing SVM is such important that the features with smaller values range are not affected by the ones with larger values range. The other advantage of this method is not facing numerical problems during the calculations. Since the core values are usually related to the inner product of features vectors (e.g. linear core and
93
Intrusion Detection System in Computer …
Z. Kermansaravi, H. Jazayeriy, S. Fateri
polynomial core), the large values of features may produce numerical issues. To solve this problem, each feature should be linearly scaled on periods [-1, 1] or [0, 1]. Next step is the features selection. There are many algorithms to select the feature. In this project, SVM has been employed to do the selection. After adjusting the existing parameters in SVM, the features that have the highest effect on system operation will be selected after examining the accuracy detection. In this algorithm the RBF core has been used. RBF core maps the samples nonlinearly to a space with larger dimensions. RBF has less numerical issues. In this method the training data are divided into two equal sections and one of them is assumed uncertain. Therefore, forecasting accuracy related to this dataset can show the categorizer operation in face of uncertain data. In WEKA software the LibSVM function is used to apply the SVM algorithm. This function is a complete set for SVM classifier (nu_svc), regression (epsilon_svr, nu_svr) and distributed estimation. It has been designed to support the multiclass classification. The options and parameters of the mentioned function are as follows: - Svm_type: determines the type of SVM which includes: C_SVC Nu_SVC One_class SVM Epsilon_SVR Nu_SVR - cacheSizee: regulates the memory in scale of MB (predefined value is set to 40 MB) - coef0: regulates the coef0 value inn core function (predefined value is 0). - Cost: adjusts the parameter c for the types c_SVC, epsilon_SVR and nu_SVR (the initial value is 1) - Degree: the degree of core function (the initial value is 3) - Eps: regulates the epsilon in missing function of epsilon_SVR (the initial value is 0.001) - Gamma: regulates the gamma in core function which is one over numbers of features (initial value is 1/16) - Kernel type: the core type which can be one of the following:
-
Linear: u' * v polynomial: (gamma*u'*v + coef0)^degree radial basis function: exp(-gamma*|u-v|^2) sigmoid : tanh(gamma*u'*v + coef0) Loss: amount of probable loss which is set to 0.1 Nu: regulates the parameter nu of nu_SCV, one_class SVM and nu_SVR (the predefined value is 0.5) Probability_estimates: gets the value 0 or 1 which determine if the SVR or SVC model are for probability estimation or not. (The initial value is 0) Shrinking: criterion to use the shrinking heuristics, 0 or 1 (the initial value is 1).
After selecting the features, categorizing the dataset samples would be performed based on the features. All decision tree algorithms are designed based on concept learning algorithm introduced by Hunt. In this method, the main features are clarified which can distinguish two main different groups. To do this, positive and negative educational samples are used. Hunt algorithm is based on divide and conquer algorithm. Here a set 94
Journal of Advances in Computer Research
(Vol. 4, No. 3, August 2013) 83-101
called S is assumed which includes n samples. The n samples are belonged to the class C the goal is to divide the S to some subsets as each one contains only samples belonging to one unique class. In this study, the ID3 decision tree algorithm has been used to increase the detection accuracy and decrease the false alarm rate. In this algorithm the Shannon’s entropy has been employed which is a criterion in selecting the most important or most distinguishing feature. ( ) Entropy (S) = ∑ − .
Where the Pi is the part of samples belonged ith class. The uncertainty of each node should be diminished by choosing features that maximizing the entropy reduction in that node. Therefore, the XV information gain was employed. Information gain investigates the required reduction in entropy regarding to the value of Fi. Information Gain (S,Fi) = F ) =Entropy (S) - ∑
∈
| |
. Entropy (
)
Where VFj is the collection of all possible values for Fj, Svi is a subset of S and its members are the samples with equal values of Fj and Vi. In each step of developing a DT, the information gain is used to select the best feature. If S is a set of training samples, the code for ID3 algorithm is as below: 1- Create the root node containing whole set of S 2- If the samples are all positive or all negative, then the tree growth is stopped. The DT has one node. 3- If the samples are not all positive or all negative, one Fj is selected which have the maximum value of information gain. 4- For each Vi from Fj, a new branch and a new node is added. All samples that have the identical Fj and Vi are saved in the new node. 5- If the node has only some samples belonging to one class, then the node will be turned to leaf. Else, a sub-tree is created in sub-node and go to step 3. Inductive bias is used in this algorithm. In ID3, the small DTs are having priority than the large DTs. A DT is composed of Boolean definitions related to the features values. Hence, it can be shown by a set of if-then rules [1, 4]. 6. Simulation and comparison results In this study, the Weka 3.6.9 software has been used to implement the proposed method. For implementation, after data preprocessing, SVM algorithm was used to select the appropriate features and finally the ID3 algorithm is used for classification. Since the relations between features may affect classification, it is clear that removing important features will decrease the classification accuracy. In addition, some features may have not any effect on results or they may be too noisy. Removing such features can increase the search speed and accuracy rate. At this step, using SVM algorithm, the features are selected which will result the highest detection rate. SVM is applied to optimize parameters and the best subset of features will be selected with the highest classification accuracy. For this purpose, after making all features discrete, LibSVM classifier is used which is the function in Weka through which SVM algorithm is performed. In this step the features will be selected to lead to higher detection accuracy and the lowest false alarm rate. By setting the parameters of the SVM algorithm and considering the following functions as the kernel function 95
Intrusion Detection System in Computer …
Z. Kermansaravi, H. Jazayeriy, S. Fateri
radial basis function: exp(-gamma*|u-v|^2) And set the parameters includes: nu = 0.5, loss = 0.1, gamma = 1, eps = 0.001 and considering the degrees of algorithm equal 3, the algorithm starts. Meanwhile the type of SVM has been determined as C-SVC (classification). After applying LibSVM algorithm on KDD Cup99 dataset, the results are as follows. Applying the algorithm leads to select 16 features for next step. The numbers of these selected features are: 2, 3, 4, 5, 6, 8, 10, 12, 24, 25, 29, 35, 36, 37, 39 and 40. Table 3 shows the selected features with their descriptions. It is clear that the selected features are related to the corresponding items included: send source and destination, communication protocols and occurred error in this path. That is why choosing this features in proposed algorithm has given rise the accuracy of detection.
Table 2: existing selected features in KDD Cup99 dataset Feature Name protocol_type Service Flag src_bytes dst_bytes Wrong_fragment Hot Logged_in
Data Type Discrete Discrete Discrete Continuous Continuous Continuous Continuous Discrete
Srv_count
Continuous
Serror_rate
Continuous
Same_srv_rate
Continuous
Dst_host_diff_srv_rate
Continuous
Dst_host_same_src_port_rate
Continuous
Dst_host_srv_diff_host_rate
Continuous
Dst_host_srv_serror_rate
Continuous
Description Connection protocol Destination Service Status Flag of the Connection Bytes Sent from Source to Destination Bytes Sent from Destination to Source Number of Wrong Fragment Number of Hot Indicators 1 if successfully logged in; 0 otherwise Number of connections to the same service as the current connection in the past two seconds (same-service connection) % of connections that have “SYN” errors (samehost connections) % of connections to the same service (sameservice connections) % of different services on the current host % of connections to the current host having the same src port % of connections to the same service coming from different hosts % of connections to the current host and specified service that have an S0 error
96
Journal of Advances in Computer Research
(Vol. 4, No. 3, August 2013) 83-101
The results of applying this algorithm are given in the following sample code: Correctly Classified Instances 443680 Incorrectly Classified Instances 938 Kappa statistic Mean absolute error Root mean squared error Relative absolute error Root relative squared error Total Number of Instances
99.789% 0.211% 0.9964 0.0002 0.0135 0.3567 % 8.4496 % 444618
The results show that 99.789% of the 443680 instances are correctly classified and only 938 instances are classified incorrectly which comprised 0.211%. There is a measurement called Kappa statistic which is an agreement normalized measurement for chance agreement. This measurement is derived from the following equation: K=
( )
( )
( )
In the above equation, P (A) is the percentage agreement (between the classifier and the truth fact); P (E) is the chance agreement. K = 1 represents perfect agreement and k = 0 shows chance agreement. - Mean absolute error calculate the mean absolute error which obtained value indicates that the proposed algorithm has high accuracy. - Root mean squared error is the root of mean square error. - Relative absolute error is obtained from dividing RMSE and it is only attained by the prediction of the target mean values (and then multiplied by 100). Therefore, the smaller values are the better ones. The values larger than 100% indicates that a running plane is going worse than the prediction average. The RAE is calculated similarly. In the last step, DT algorithm is applied on KDD Cup 99 dataset which selects features in order to increase the detection accuracy and then makes rules. ID3 is used in this step. At the beginning, pre-processing starts on training and test data. The parameters initial values are set and the primary solutions are generated randomly. In the proposed algorithm, k-fold method is used to evaluate the classification accuracy of KDD cup 99 dataset. When K = 10 is selected, the data is divided into 10 sections, 9 parts are considered as training data and one part is taken into test data. The results indicate that the proposed algorithm has trained the attacks effectively. The obtained results after applying ID3 algorithm are shown as a matrix in the table 3 and they are defined as the follows: Table 3: The matrix of equations Classified as
Correctly classified (TP) Correctly classified but show Incorrect (TN)
Incorrectly class but show Correct (FP) Incorrectly classified (FN)
Detection rate, false alarm rate and the accuracy of proposed method are obtained from the following equations: x 100 (1) Detection Rate =
97
Intrusion Detection System in Computer …
False Alarm Rate =
x 100
Z. Kermansaravi, H. Jazayeriy, S. Fateri
(2)
Accuracy = x 100 (3) - True Positive (TP): shows the number of attacks which are detected correctly and they had been attacks actually. True Negative (TN): indicates the number of detected normal instances which had been normal in fact. False Positive (FP): or the false alarm rate. It is the number of detected attacks which had been normal. False Negative (FN): the number of detected normal which had been attacks actually. In other words, one can say that these attacks are the intrusion detection systems aim. Results show the high detection rate in proposed algorithm compared to an individual SVM algorithm up to 99.789%. All results are given in tables (4), (5) and (6). From 87642 records, the 87542 records are detected correctly and 20 records are detected incorrectly in which 19 records was in warezclient category which is one of the DoS attacks class and one record was belonged to nmap category from Probing attacks class. In proposed algorithm the detection rate for normal class has been 99.9%. Thus, the results for other types of attacks are obtained according to table 4. Table 4: The accuracy obtained from applying proposed algorithm on each type of attacks Attack Type Normal DoS Probe R2L U2R
Accuracy (%) ٩٩.٩ ٨٩.٢ ٩۵.٨ ٨۶.٧ ۶١.٠٠
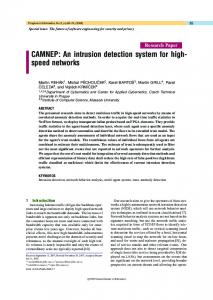
Table 5: Comparing the accuracy and detection rate obtained from proposed algorithm with the SVM Percentage of normal data (%) 10 20 30 40 50 60 70 80 90
Accuracy (%) Proposed Algorithm 50.31 55.72 61.29 67.42 74.84 83.82 88.85 95.96 99.8
Average
75.33
45.67 49.46 54.22 61.27 70.53 75.24 80.01 87.36 95.79
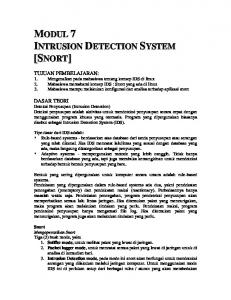
Detection rate (%) Proposed SVM Algorithm 99.79 76.74 93.15 74.44 97.44 77.05 86.14 69.12 88.82 73.67 82.88 71.91 81.84 71.48 80.63 67.92 80.49 67.25
68.84
87.91
SVM
72.17
Figure 3 shows the linear curve of detection accuracy and detection rate which are from proposed algorithm and SVM algorithm. As it is obvious, the proposed algorithm has more accurate results.
98
Journal of Advances in Computer Research
(Vol. 4, No. 3, August 2013) 83-101
Detection Rate
120 100 80 60 40 Proposed Algorithm
20
SVM
0
Normal Ratio
120
Accuracy
100 80 60 40 20
Proposed Algorithm
SVM
0
Normal Ratio
Figure 3: Comparing the detection accuracy and detection rate resulted from proposed algorithm with the SVM using linear curve
99
Intrusion Detection System in Computer …
Z. Kermansaravi, H. Jazayeriy, S. Fateri
The proposed algorithm has been implemented by Weka 3.9 which is run on eclipse SDK 4.2.2 Java environment on a computer system enjoyed Intel Core i52430M CPU 2.40GHz and 4.00 GB memory and is able to classify and detect attacks on 3.9 seconds. According to these results, the proposed algorithm was able to detect 99.789% of attacks correctly; the false alarm rate is estimated 0.211% and the accuracy is obtained 99.8%. Final results indicate the high performance of proposed algorithm. Table 6 compares the performance of the proposed algorithm with other presented methods. Results show that the correct feature selection is directly related to the accuracy of intrusion detection systems. Table 6: Comparing the detection accuracy rate of proposed algorithm with the recent similar algorithms Method SVM – ID3 DT-SVM [Sandhya P.2007] SVM + SA + feature selection [Shih-Wei Lin 2012] ID3 [B.Kavitha 2010]
Selected Features No. 16 41 25 14
Accuracy (%) 99.8 99.7 99.42 91.99
7. Conclusion Recently, communications between computer systems has been growing quickly. Therefore, network security becomes an important challenging field. IDS is one of the defensive systems designed for detecting unusual and harmful activities. Many procedures are used to design such systems. In this regard, hybrid methods have higher accuracy due to combining best results of various systems. In this paper DT algorithms and SVM have been combined to achieve the proposed hybrid method due to obtaining decision rules of dataset and capability of high extending, respectively. The selected features by this method are appeared to be related to some cases on the path including sending source and destination, communication protocol and the occurred errors. This fact proves the efficiency of the proposed method in reducing the training data and the calculation time. This method has been applied on KDD Cup99 dataset and the results have shown the best feature selection with the highest detection rate of 99.8% in 3.9 second which is better than the previous works in this field. The proposed method can be even used in other datasets and databases just by changing associated data. 8. References [1] Shojaie, Z., “Algorithms and Advanced Data mining Concept”, Jahad Daneshgahi, Amirkabir University of Technology, Tehran, 2005 [2] Tsai, C.-F., et al., Intrusion detection by machine learning: A review. Expert Systems with Applications, 2009. 36(10): p. 11994-12000. [3] Wu, S.-Y. and E. Yen, Data mining-based intrusion detectors. Expert Systems with Applications, 2009. 36(3): p. 56.٥٦١٢-٠٥ [4] Peddabachigari, S., et al., Modeling intrusion detection system using hybrid intelligent systems. Journal on network and computer applications, 2007. 30(1): p. 114-132. [5] Kolias, C., G. Kambourakis, and M. Maragoudakis, Swarm intelligence in intrusion detection: a survey. computers & security, 2011. 30(8): p. 625-642.
100
Journal of Advances in Computer Research
(Vol. 4, No. 3, August 2013) 83-101
[6] Om, H. and A. Kundu. A hybrid system for reducing the false alarm rate of anomaly intrusion detection system in Recent Advances in Information Technology (RAIT), 2012 1st International Conference on. 2012. IEEE. [7] Mukherjee, S. and N. Sharma, Intrusion Detection using Naive Bayes Classifier with Feature Reduction. Procedia Technology, 2012. 4: p. 119-128. [8] Lin, S.-W., et al., An intelligent algorithm with feature selection and decision rules applied to anomaly intrusion detection. Applied Soft Computing, 2012. 12(10): p. 3285-3290. [9] Catania, C.A. and C.G. Garino, Automatic network intrusion detection: Current techniques and open issues. Computers & Electrical Engineering, 2012. [10] Tribak, H., et al. Statistical analysis of different artificial intelligent techniques applied to Intrusion Detection System. in Multimedia Computing and Systems (ICMCS), 2012 International Conference on .٢٠١٢ .IEEE. [11] Ektefa, M., et al. Intrusion detection using data mining techniques. in Information Retrieval & Knowledge Management,(CAMP), 2010 International Conference on. 2010. IEEE. [12] Langin, C. and S. Rahimi, Soft computing in intrusion detection: the state of the art. Journal of Ambient Intelligence and Humanized Computing, 2010. 1(2): p. 133-145. [13] Tsai, C.-F. and C.-Y. Lin, A triangle area based nearest neighbors approach to intrusion detection. Pattern Recognition, 2010. 43(1): p. 222-229. [14] Aydın, M.A., A.H. Zaim, and K.G. Ceylan, A hybrid intrusion detection system design for computer network security. Computers & Electrical Engineering, 2009. 35(3): p. 517-526. [15] Chebrolu, S., A. Abraham, and J.P. Thomas, Feature deduction and ensemble design of intrusion detection systems. Computers & Security, 2005. 24(4): p. 295-307. [16] Depren, O., et al., An intelligent intrusion detection system (IDS) for anomaly and misuse detection in computer networks. Expert Systems with Applications, 2005. 29(4): p. 713-722. [17] Horng, S.-J., et al., A novel intrusion detection system based on hierarchical clustering and support vector machines. Expert Systems with Applications, 2011. 38(1): p. 306-313. [18] Tavallaee, M., et al. A detailed analysis of the KDD CUP 99 data set. in Proceedings of the Second IEEE Symposium on Computational Intelligence for Security and Defense Applications 2009. 2009.
101
Intrusion Detection System in Computer …
Z. Kermansaravi, H. Jazayeriy, S. Fateri
102