Proyecciones Journal of Mathematics Vol. 29, No 2, pp. 109-122, August 2010. Universidad Cat´olica del Norte Antofagasta - Chile
INVERSE SPREAD LIMIT OF A NONNEGATIVE MATRIX ATIF ABUEIDA UNIVERSITY OF DAYTON, U. S. A. MARK NIELSEN UNIVERSITY OF DAYTON, U. S. A. and TIN YAU TAM AUBURN UNIVERSITY, U. S. A. Received : June 2010. Accepted : August 2010
Abstract For a given nonnegative n × n matrix A consider the following quantity mini,j (Am )ij s(Am ) := , m = 1, 2, . . . maxi,j (Am )ij as long as the denominator is positive. It is simply the ratio between the smallest and the largest entries of Am . We call s(Am ) the inverse spread of Am which is interpreted as a measure of the maximum variation among the entries of Am in the multiplicative and reciprocal sense. Smaller s(Am ) means a larger variation for Am . Clearly 0 ≤ s(Am ) ≤ 1 for all m = 1, 2, . . . We study the asymptotic behavior of s(Am ), that is, the behavior of s(Am ) as m → ∞. The study arises from evolutionary biology. Subjclass : Primary 15A45, 22E46; Secondary 15A42. Key words : Nonnegative matrices, inverse spread, evolutionary biology, DNA 2000 Mathematics Subject Classification. Primary 92D15, 15A48.
110
Atif Abueida, Mark Nielsen and Tin-Yau Tam
1. Introduction Probabilistic models of protein evolution have been developed and refined over time to account for the biological processes involved in amino acid substitution, i.e., mutational biases in the DNA, translation of the DNA into protein according to the genetic code, and selective constraints on the protein [10, 11]. These models have been used primarily to calculate distances between sequences for use in phylogenetic reconstruction. Here we use graph theory to focus on the initial stages of the substitution process, and ask if there are biases toward particular amino acid identities in the initial steps of protein evolution, for example at the advent of a new protein(s) following a gene duplication, recombination, or hybridization event. Rather than seeking the shortest distance among a set of given sequences through parameterized substitution models, we modeled the problem with graphs where the vertices are either DNA codons in G1 or amino acids in G2 through G4 , with the associated adjacency matrices M1 , M2 , M3 and M4 respectively. G1 and G2 model evolutionary transitions in terms of the mutational distance between two codon states, or two amino acid states respectively. The remaining two graphs consider amino acid transitions in terms of their likelihood as determined through comparisons of real proteins [6]. The vertices of G1 are the possible 3 letter combinations of nucleotides (A, T, C, G) that comprise the genetic code. In the Genetic Code, each three letter combination, or codon, codes for an amino acid, the building block of proteins, with a typical protein consisting in 200-800 amino acids. The edges of G1 correspond to the hamming distance between any two codons (i.e. {u, v} is an edge in G1 if the codons corresponding to u and v differ in exactly one nucleotide). The entries in the adjacency matrix are either a 1 or a 0. A one indicates that the codons are only a single letter change apart; only a single mutational event separates the states and no intermediate must be traversed to arrive at the new identity. A zero indicates that more than a single nucleotide difference separates the codons, and a potentially maladaptive intermediate codon must be traversed to evolve from one codon to the other. In this way, G1 models transitions at the level of DNA evolution, how does the fact that, from a given codon state, only nine of the 63 non-identical codons can be reached in a single mutational step affect evolutionary outcomes? G2 models evolutionary transitions at the level of amino acid evolution by incorporating the degeneracy in the genetic code into the graph - the
Inverse spread limit of a nonnegative matrix
111
64 codons code for only twenty different amino acids. Each amino acid is coded by from one to six different codons, with the difference affecting the number of single-step pathways, and therefore the likelihood of evolution, between two amino acid states. The vertices of G2 are the 20 amino acids, with the edges containing the number of single step pathways between two amino acids when degeneracy in the code is considered. For example, there are two ways to code the amino acid Histidine (His), CAT and CAC, and two ways to code Glutamine (Gln), CAA and CAG, thus there are four single step paths between His and Gln, and hence there are four edges between the vertices His and Gln. The following is the adjacency matrix M2 associated with G2 : ⎛
A R N D C Q E G H I L K M F ⎜ ALA(A) 0 0 0 2 0 0 2 4 0 0 0 0 0 0 ⎜ ⎜ ARG(R) 0 0 0 0 2 2 0 6 2 1 4 2 1 0 ⎜ ⎜ ⎜ ASN(N) 0 0 0 2 0 0 0 0 2 2 0 4 0 0 ⎜ ⎜ ASP(D) 2 0 2 0 0 0 4 2 2 0 0 0 0 0 ⎜ ⎜ CYS(C) 0 2 0 0 0 0 0 2 0 0 0 0 0 2 ⎜ ⎜ ⎜ GLN(Q) 0 2 0 0 0 0 2 0 4 0 2 2 0 0 ⎜ ⎜ GLU(E) 2 0 0 4 0 2 0 2 0 0 0 2 0 0 ⎜ ⎜ GLY(G) 4 6 0 2 2 0 2 0 0 0 0 0 0 0 ⎜ ⎜ HIS(H) 0 2 2 2 0 4 0 0 0 0 2 0 0 0 ⎜ ⎜ 0 1 2 0 0 0 0 0 0 0 4 1 3 2 M2 = ⎜ ILE(I) ⎜ ⎜ LEU(L) 0 4 0 0 0 2 0 0 2 4 0 0 2 6 ⎜ ⎜ LYS(K) 0 2 4 0 0 2 2 0 0 1 0 0 1 0 ⎜ ⎜ MET(M) 0 1 0 0 0 0 0 0 0 3 2 1 0 0 ⎜ ⎜ ⎜ PHE(F) 0 0 0 0 2 0 0 0 0 2 6 0 0 0 ⎜ ⎜ PRO(P) 4 4 0 0 0 2 0 0 2 0 4 0 0 0 ⎜ ⎜ SER(S) 4 6 2 0 4 0 0 2 0 2 2 0 0 2 ⎜ ⎜ THR(T) 4 2 2 0 0 0 0 0 0 3 0 2 1 0 ⎜ ⎜ ⎜ TRP(W) 0 2 0 0 2 0 0 1 0 0 1 0 0 0 ⎜ ⎝ TYR(Y) 0 0 2 2 2 0 0 0 2 0 0 0 0 2 VAL(V) 4 0 0 2 0 0 2 4 0 3 6 0 1 2
P 4 4 0 0 0 2 0 0 2 0 4 0 0 0 0 4 4 0 0 0
⎞
S T W Y V 4 4 0 0 4 ⎟ ⎟ 6 2 2 0 0 ⎟ ⎟ ⎟ 2 2 0 2 0 ⎟ ⎟ 0 0 0 2 2 ⎟ ⎟ 4 0 2 2 0 ⎟ ⎟ 0 0 0 0 0 ⎟ ⎟ ⎟ 0 0 0 0 2 ⎟ ⎟ 2 0 1 0 4 ⎟ ⎟ 0 0 0 2 0 ⎟ ⎟ ⎟ 2 3 0 0 3 ⎟ ⎟ 2 0 1 0 6 ⎟ ⎟ 0 2 0 0 0 ⎟ ⎟ 0 1 0 0 1 ⎟ ⎟ ⎟ 2 0 0 2 2 ⎟ ⎟ 4 4 0 0 0 ⎟ ⎟ 0 6 1 2 0 ⎟ ⎟ 6 0 0 0 0 ⎟ ⎟ ⎟ 1 0 0 0 0 ⎟ ⎟ 2 0 0 0 0 ⎠ 0 0 0 0 0
The vertices of G3 and G4 also correspond to the twenty amino acids, however the edges are different. These consist of the likelihood of a transition between amino acid states as determined through comparisons of real proteins (multiplied by 105 ) [6]. Amino acids with similar biochemistry are more likely to substitute for one another than amino acids with very different biochemistry, as the latter type of transition is more likely to disrupt
112
Atif Abueida, Mark Nielsen and Tin-Yau Tam
protein function. G3 considers transitions under a model of purifying selection, in which most mutations, ie. evolutionary transitions, are deleterious, such that the most likely evolutionary transition is a transition to the same amino acid state. However, in rare instances, positive selection, transitions to different amino acid states are favored. This condition is modeled by the graph G4 , in which transitions to the same amino acid are not allowed (i.e. deleting all the loops in G3 to create G4 or placing zeros on the main diagonal of M3 to obtain M4 ). The matrices M1 , M2 , M3 , and M4 are on the following URL: http : //academic.udayton.edu/Atif Abueida/P ositive M atrix.htm By raising the matrix to integer powers, m, the codon or amino acid evolves, such that the (i, j) entry in the matrix, aij , represents the number of m-step pathways between the codon states in the ith row and j th column in question. By evolving the matrix, the following questions are answered: 1. Are evolutionary pathways unevenly distributed, such that there are more pathways to some codon identities than others, and 2. If so, how long does the uneven distribution of pathways persist?
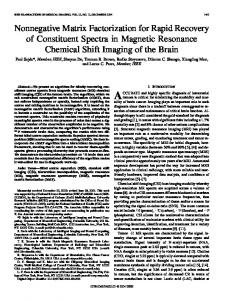
Figure 1. Min/Max vs. nucleotide matrix powers Results from G1 show that the number of pathways to different codon states are unevenly distributed early in the evolution of the matrix ; the ratio of the smallest entry to the largest entry in the matrix (Min/Max, or Inverse spread) is less than 1.0. After ten generations of evolution this signal disappears; over time, the accumulation of alternative pathways between codon states results in every codon state being equally likely (redMin/Max
Inverse spread limit of a nonnegative matrix
113
= 1.0. After ten generations of evolution this signal disappears; over time, the accumulation of alternative pathways between codon states results in every codon state being equally likely (Fig. 1). G2 reveals that degeneracy in the genetic code impacts the evolutionary process. G2 reaches an equilibrium min/max value in fewer generations than the nucleotide matrix (Fig. 2). The equilibrium value of 0.0469 is smaller than the (non-zero) min/max in the initial (A-zero) matrix (0.167).
Figure 2. Min/Max vs. amino acid coding matrix powers G3 and G4 show different behavior than G2 , expected given the fundamental role of functional considerations in evolution. After 2000 generations, the purifying selection matrix G3 arrives at a min/max approaching 0.1145. This value is larger than the initial, non-zero min/max of 0.00001 in the (A-zero) matrix.
114
Atif Abueida, Mark Nielsen and Tin-Yau Tam
Figure 3. Min/Max vs. Purifying selection matrix powers After 10 generations, the functional adjacency matrix, M4 , arrives at a min/max equilibrium of 0.00496 (see figure), larger than the (non-zero) min/max value in the (A-zero) matrix. This value is larger than the (nonzero) min/max in the initial (A-zero) matrix (.00016).
Figure 4. Min/Max vs. Positive selection matrix powers The above figures all point to a possible conclusion that the inverse spread of Am settles at some constant, where A is a nonnegative n × n matrix, for example, A = M1 , M2 , M3 and M4 are nonnegative matrices. It turns out it is true under certain circumstances. We discuss the inverse spread phenomenon in more mathematical form and we show when it converges. The matrices M1 , M2 , M3 and M4 are indeed primitive matrices which will be discussed in a later section.
Inverse spread limit of a nonnegative matrix
115
2. Preliminaries on nonnegative matrices Let Nn denote the collection all nonnegative n × n matrices. See [1, 5] for preliminaries for nonnegative matrices. To have a well defined s(Am ), Am ∈ Nn must have at least one nonzero entry. But this can be violated by the so called nilpotent matrices. A nilpotent n × n matrix A is a matrix such that Ak = 0 for some positive integer k. Indeed the smallest such k is no greater than n. For example N=
Ã
0 1 0 0
!
is a nilpotent matrix since N 2 = 0. Clearly s(N 2 ) is undefined. So we need to restrict our study to nonnegative non-nilpotent matrices. It is known that a (complex or real) square matrix A is nilpotent if and only if all eigenvalues of A are zeros. But this fact may not offer much help in practice to determine whether A ∈ Nn is nilpotent or not because of the presence of numerical error, especially when dealing with large matrices, for example, M1 is 64 × 64. Hearon [4] obtained the following characterization of nonnegative nilpotent matrices. The third condition makes a good check on whether A ∈ Nn is nilpotent. An algorithm to find cycles in directed graph has been developed in [9] which is useful to check the last condition. Theorem 3. (Hearon) Let A ∈ Nn . Then the following are equivalent. 1. A is nilpotent. 2. A is permutationally similar to a triangular matrix with zero diagonal entries. 3. A and each of its principal submatrices contain a zero row and a zero column. 4. the graph G(A) of A contains no cycles. The graph G(A) of A ∈ Nn is constructed in the following fashion (also works for any n × n matrix): we begin with n points or vertices v1 , . . . , vn . If aij 6= 0 we draw a directed line (arrow) from j to i. In particular if i = j, we draw a loop on vj . A cycle of length k is obtained from a path of length k by adding the arrow connecting their terminal vertex to the initial vertex. For example, v2 → v5 → v4 → v2 is a cycle of length 3. We regard a loop vi → vi as a cycle of length 1.
116
Atif Abueida, Mark Nielsen and Tin-Yau Tam
For our application, we can check An = 0 to see whether A ∈ Nn is nilpotent or not, provided that the size of A is not too large. Another practical criterion for nilpotence of A ∈ Nn is tr Ak = 0 for all k = 1, . . . , n [5, p.44], where tr Ak denotes the trace of Ak , i.e., the sum of the diagonal entries of Ak , especially the entries of our matrices are nonnegative integers. To carry our study further we need more concepts for nonnegative matrices. A matrix A ∈ Nn is said to be reducible if there exists a permutation matrix P such that P AP
T
=
Ã
B C 0 D
!
where B and D are square matrices but not necessarily of the same size. Otherwise P is said to be irreducible. The following result contains some characterizations of irreducible nonnegative matrices [5, p.362]. Theorem 5. Let A ∈ Nn . Then the following are equivalent. 1. A is irreducible. 2. (I + A)n−1 > 0. 3. the graph G(A) is strongly connected. The graph G(A) is strongly connected if between every pair of distinct vertices vi , vj , there is a directed path that begins at vi and ends at vj . Condition 2 in Theorem 5 is useful to have computer implementation if the entries of A are nonnegative integers like M1 , M2 , M3 . Notice that if A is reducible and non-nilpotent, then P AP
T
=
Ã
B C 0 D
!
where B and D are square matrices and thus m
PA P
T
=
Ã
Bm ∗ 0 Dm
!
Since P is a permutation matrix, the entries of A are those of P Am P T . So it is clear now s(Am ) = 0, m = 1, 2, . . . We thus turn our attention to the irreducible nonnegative matrices.
Inverse spread limit of a nonnegative matrix
117
3. The limit of inverse spread for irreducible nonnegative matrices An irreducible nonnegative matrix A is non-nilpotent by Theorem 3. By Perron-Frobenius theory [1, 3, 5], a nonnegative irreducible matrix A has the spectral radius, r(A), as a simple eigenvalue. The spectral radius of A is the maximal large eigenvalue modulus. However it is possible for A to have some eigenvalue λ other than r(A) such that the modulus of λ is also r(A). Suppose A has k eigenvalues of maximal modulus r(A), including r(A). When k = 1, A is called primitive; when k > 1, A is called imprimitive of index k. For each imprimitive matrix A with index k, there exists a permutation matrix P such that ⎛
⎜ ⎜ ⎜ T P AP = ⎜ ⎜ ⎜ ⎝
0
⎞
B1 0 B2 ..
Bk
.
⎟ ⎟ ⎟ ⎟ ⎟ ⎟ 0 Bk−1 ⎠
0
where the diagonal zero blocks are square. Moreover the diagonal blocks in P Ak P T = diag (A1 , . . . , Ak ) are all primitive and have one and the same maximal eigenvalue. Indeed one can see ⎛
0
⎜ ⎜ ⎜ ⎜ P A2 P T = ⎜ ⎜ ⎜ ⎜ ⎝ Bk−1 Bk
0 0
Bk B1
B1 B2 0 B2 B3 .. .
⎞
⎟ ⎟ ⎟ ⎟ ⎟ ⎟ 0 Bk−2 Bk−1 ⎟ ⎟ ⎠ 0 0
0
and so on. So P Am P T would always have some zero entry for any positive integer m. Thus s(Am ) = 0 for all m = 1, 2, . . . if A is imprimitive of index k > 1. So we only need to consider primitive A. It is known that [5, p.516] A ∈ Nn is primitive if and only if Ap > 0 for some positive integer p and one may pick p = n2 − 2n + 2 [5, p.520]. From [3, p.81] Am C(r) lim m = 0 , m→∞ r ψ (r)
118
Atif Abueida, Mark Nielsen and Tin-Yau Tam
where ψ(λ) is the minimal polynomial of A, ψ 0 (λ) its derivative, C(λ) := (λIn − A)−1 ψ(λ) is the reduced adjoint matrix [2, p.90], and r := r(A). So mini,j (Am )ij m→∞ maxi,j (Am )ij mini,j (Am /rm )ij lim m→∞ maxi,j (Am /r m )ij mini,j limm→∞ (Am /rm )ij maxi,j limm→∞ (Am /rm )ij mini,j (C(r)/ψ 0 (r))ij maxi,j (C(r)/ψ 0 (r))ij mini,j (C(r))ij maxi,j (C(r))ij
s(Am ) =
lim
= = = = To summarize:
Theorem 4. Let A ∈ Nn be a non-nilpotent nonnegative matrix. 1. If A is primitive, then (A) := lim s(Am ) exists and 0 < (A) ≤ 1. m→∞ Indeed mini,j (C(r))ij , (A) = maxi,j (C(r))ij where C(λ) is the reduced adjoint matrix C(λ) = (λIn − A)−1 ψ(λ) and ψ(λ) is the minimal characteristic polynomial of A. 2. Otherwise (A) := lim s(Am ) = 0. m→∞
There is another way to compute (A) for a primitive A ∈ Nn . Since [5, p.516] (3.1) lim Am /rm = L, m→∞
where L = So (3.2)
xy T ,
Ax = r(A)x and AT y = r(A)y, x > 0, y > 0 and xT y = 1.
(A) =
min1≤i,j≤n xi yj min1≤i,j≤n (xy T )ij = max1≤i,j≤n (xyT )ij max1≤i,j≤n xi yj xi yi min . 1≤i,j≤n xj 1≤i,j≤n yj
= min
Thus finding (A) is reduced to the minimum ratios of the components in the Perron vectors of A and AT without doing the normalization xT y = 1
Inverse spread limit of a nonnegative matrix
119
process. In addition, if A is a symmetric matrix, then x is also a Perron vector of AT and thus "
xi (A) = min 1≤i,j≤n xj
#2
.
Example 3. Using MATLAB the spectral radius and the Perron vector x of M2 are respectively r(M2 ) = 23.3522 and x = (0.2744, 0.3686, 0.1265, 0.1148, 0.1530, 0.1284, 0.1061, 0.2533, 0.1371, 0.2187, 0.3311, 0.1115, 0.0997, 0.1802, 0.3075, 0.4013, 0.2871, 0.0869, 0.0953, 0.2422)T Since M2 is symmetric, that is, M2T = M2 , y = x and thus (M2 ) = (min xi / max xj )2 = (0.0869/0.4013)2 ≈ 0.0469 which matches Figure 2. The à limit!in (3.1) may not exist if A is imprimitive, for example, when 0 1 A= , A2k = I2 and A2k+1 = A for all k = 1, 2, ... 1 0
4. The largest possible case (A) = 1 When will the upper bound 1 for (A) be attained? A simple example is ⎛ ⎜ ⎜ ⎝
Jn = ⎜
1 1 1 1 ··· ··· 1 1
··· 1 ··· 1 ··· ··· ··· 1
⎞
⎟ ⎟ ⎟ ∈ Nn , ⎠
that is, a matrix of all ones, since Jnm = nm−1 Jn . Notice that the row sum and column sum of Jn are identical. The following theorem covers this very special example. Theorem 4. Let A ∈ Nn . Then (A) = 1 if and only if A is primitive and the row sums and column sums of A are all identical. Proof: Suppose A is primitive and the row sums and column sums of A are identical to ξ. In other words, A is a positive multiple of a doubly stochastic D and primitive, say A = ξD. A doubly stochastic matrix is a square nonnegative matrices whose column sums and row sums are all 1. It is known that r(D) = 1 and thus r(A) = ξ. The vector e = (1, . . . , 1)T is a Perron vector for both A and AT . In other words, x = y = e, and hence (A) = 1 by (??).
120
Atif Abueida, Mark Nielsen and Tin-Yau Tam
On the other hand, if A ∈ Nn is primitive with (A) = 1, then by (3.1) one concludes immediately that x and y are multiples of e and thus Ae = AT e = ξe for some positive constant ξ. In other words, the row sums and column sums of A are all identical. Example 5. The matrix A = Jn − In ∈ Nn , n ≥ 3, is primitive since A2 = Jn2 − 2Jn + In = (n − 2)Jn + In > 0. So A is primitive. Clearly A has identical row sums and column sums, namely, n − 1.
5. Biological Interpretation Our results show bias (inverse spread < 1.0) in amino acid states early in an evolutionary process, resulting from differences in the number of evolutionary pathways leading to different amino acid states. These biases come to an equilibrium rapidly, except with respect to purifying selection. The inability to achieve certain amino acid states in the first few generations predisposes evolutionary trajectories, and is particularly important as the first generations following a significant evolutionary event, for example a gene duplication or species hybridization event, are the most significant to evolutionary outcomes [7, 8]. The inverse spread of the M1 matrix rapidly reaches 1.0, all codon states being equally likely after a few generations. However, the genetic code is degenerate, as modeled in G2 , resulting in more pathways to multiply-coded that singly coded amino acids. Over time (interations) the initial inverse spread in the M2 A-zero matrix is reduced four-fold, revealing the surprising result that degeneracy exacerbates the problem of intermediates - as the inverse spread decreases the relative number of pathways available to reach certain amino acid identities decreases, as does the relative likelihood that a path can be found that does not contain a maladaptive intermediate. This contrasts with the results obtained when selection is considered, using transition likelihood’s obtained from real proteins under purifying selection (G3 ) and positive selection (G4 ). Each of these modes of selection reduces the initial bias in codon states in their respective A-zero matrices, which has the paradoxical effect of increasing the likelihood of arrival of functionally unfavorable states over the course of evolution, mollifying the problem of intermediates. Under purifying selection equilibrium is not arrived at until 2000 generations have passed; in contrast to the other analysis, the effects of purifying selection on amino acid states persist over long periods of time.
Inverse spread limit of a nonnegative matrix
121
The M3 and M4 matrices model general cases of evolution based on observed frequencies of amino acid transitions. These values are not fixed, but vary from protein to protein, such that other cases are of interest. The case (A) = 0 is of interest. In a given protein it is possible, even likely, that some transitions are not viable due to a specific constraint on the function of that amino acid in the protein. This results in a zero entry for that transition in the matrix. Zeros tend to propagate in a matrix over time, constraint in evolutionary pathways begets constraint, potentially resulting in the (A) = 0 case, in which no evolution is possible. This stasis would be maintained until a change in the local environment in which the protein functions, resulting in a corresponding change in protein function and transition probabilities in the matrix, freeing the protein to evolve. The case (A) = 1 is also of interest. This result, obtained in our nucleotide matrix, states that all codon states are equally likely. In a biological sense, the initial bias in codon states (ie. only 8 of the 63 non-identical codons can be reached in a single step/generation) quickly disappears. This has the effect that functional considerations are free to shape codon identity without fighting any added pressures based in coding bias. We can determine ahead of time whether this is the case because of Theorem 4. In future work, we will assess the potential impact of pathway bias by comparing amino acid transitions in real proteins sharing recent ancestors.
References [1] A. Berman and R. J. Plemmons, Nonnegative Matrices in the Mathematical Sciences, Classics in Applied Mathematics, 9, SIAM, Philadelphia, (1994). [2] F. R. Gantmacher, The Theory of Matrices, Volume I, Chelsea Publishing Company, New York, (1959). [3] F. R. Gantmacher, The Theory of Matrices, Volume II, Chelsea Publishing Company, New York, (1959). [4] J. Z. Hearon, Compartmental matrices with single root and nonnegative nilpotent matrices, Math. Biosci., 14, pp. 135—142; (1972). [5] R.A. Horn and C.R. Johnson, Matrix Analysis, Cambridge University Press, (1985).
122
Atif Abueida, Mark Nielsen and Tin-Yau Tam
[6] D.T. Jones, W.R. Taylor, and J.M. Thornton, The rapid generation of mutation data matrices from protein sequences, Comput. Appl. Biosci. 8, pp. 275-282, (1992). [7] L.H. Rieseberg, Chromosomal rearrangements and speciation, Trends in Ecology and Evolution, 16, pp. 351-358, (2001). [8] J.S. Taylor and J. Raes, Duplication and Divergence, The Evolution of New Genes and Old Ideas, Annual Review of Genetics, 38, pp. 615-643, (2004). [9] J. C. Tiernan, An Efficient Algorithm to Find the Elementry Circuit of a Graph, Comm. ACM, 13 No. 12, pp. 722-726, (1970). [10] Z. Yang, R. Nielsen, Hasegawa M., Models of Amino Acid Substitution and Applications to Mitochondrial Protein Evolution. Mol. Biol. Evol. 15(12), pp. 1600-1611, (1998). [11] Z. Yang, R. Nielsen, Estimating synonymous and nonsynonymous substitution rates under realistic evolutionary models. Mol Biol Evol. 17(1), pp. 32-43, (2000). Atif Abueida Department of Mathematics University of Dayton, 300 College Park, Dayton, OH 45469-2316 U. S. A. e-mail :
[email protected]) Mark Nielsen Department of Biology, University of Dayton, 300 College Park, Dayton, OH 45469-2320 U. S. A. e-mail :
[email protected] and Tin-Yau Tam Department of Mathematics and Statistics, Auburn University, AL 36849-5310 U. S. A. e-mail :
[email protected]