Exp Appl Acarol https://doi.org/10.1007/s10493-018-0256-9
Investigating species boundaries using DNA and morphology in the mite Tyrophagus curvipenis (Acari: Acaridae), an emerging invasive pest, with a molecular phylogeny of the genus Tyrophagus Pamela Murillo1,2 · Pavel Klimov1,3 · Jan Hubert4 · Barry OConnor1
Received: 4 September 2017 / Accepted: 14 April 2018 © Springer International Publishing AG, part of Springer Nature 2018
Abstract Mites of the genus Tyrophagus (Acari: Acaridae) are among the most widespread and common mites, inhabiting diverse natural and anthropogenic habitats. Some species are pests of agricultural products and stored food and/or live in house dust, causing allergies to humans. We sequenced 1.2 kb of the mitochondrial COI gene for 38 individuals belonging to seven species of Tyrophagus, including T. curvipenis, T. putrescentiae, T. fanetzhangorum, T. longior, T. perniciosus, and T. cf. similis. Molecular phylogenetic analyses (1) recovered two major clades corresponding to the presence or absence of eyespots, and (2) separated all included morphological species. Tyrophagus curvipenis and T. putrescentiae had the lowest between-species genetic distances (range, mean ± SD): 14.20– 16.30, 15.17 ± 0.40 (K2P). The highest within-species variation was found in T. putrescentiae 0.00–4.33, 1.78 ± 1.44 (K2P). In this species, we recovered two distinct groups; however, no geographical or ecological dissimilarities were observed between them. Based on our analyses, we document important morphological differences between T. curvipenis and T. putrescentiae. For the first time, we record the occurrence of T. curvipenis in the New World and suggest that it may be an emerging pest as it is currently spreading in agricultural produce.
Electronic supplementary material The online version of this article (https://doi.org/10.1007/s1049 3-018-0256-9) contains supplementary material, which is available to authorized users. * Pamela Murillo
[email protected] 1
Department of Ecology and Evolutionary Biology, University of Michigan, Ann Arbor, MI 48109, USA
2
Laboratorio de Acarologia‑ CIPROC, Universidad de Costa Rica, Ciudad Universitaria Rodrigo Facio, San Pedro 2060, Costa Rica
3
Faculty of Biology, Tyumen State University, Tyumen, Russia
4
Biologically Active Substances in Crop Protection, Crop Research Institute, Prague, Czech Republic
13
Exp Appl Acarol
Keywords Tyrophagus curvipenis · DNA barcode · COI · Tyrophagus phylogeny · Genetic distances
Introduction Mites of the genus Tyrophagus have a worldwide distribution and are present in a varied range of natural and human-associated habitats (Robertson 1959; Hughes 1976). Most species are fungivorous (Hughes 1976) and occur in a wide range of food substrates including dried meat, seeds, cheese, wheat, flour, fruits, tubers and others, reducing the nutritional value of the products through direct damage and indirectly by spreading fungi and bacteria (Hughes 1976; Hubert et al. 2004; de Oliveira et al. 2007). Even though only a few astigmatid mites are considered as truly phytophagous, some species of the genus Tyrophagus, e.g., T. neiswanderi and T. similis, are economically important plant pests that have been associated with direct damage to plants (Lange and Bacon 1958; Hughes 1976; Buxton 1989; Fisher 1993; Kasuga and Amano 2003, 2006; Zhang 2003; Kasuga and Honda 2006; Khaing et al. 2014). One of the potential plant pest species, T. curvipenis, was described from a greenhouse in Portugal, feeding on algae and pollen of orchid flowers (Fain and Fauvel 1993). Later, this species was reported in various Old World countries: Greece, France, New Zealand and Australia (Fan and Zhang 2007; Badieritakis et al. 2012). Tyrophagus curvipenis occurs in stored food products as well as on various plants and animal materials (Fan and Zhang 2007) but unlike other species in the genus, T. curvipenis is more frequent on plants than in typical stored products. Distinction among different species of Tyrophagus can be challenging given the morphological similarities between closely related species, the presence of cryptic species and the occurrence of several species in the same geographical region (Yang et al. 2011; Erban et al. 2016). There are disagreements about the exact number of valid species, species boundaries, and distribution (Klimov and OConnor 2009, 2010, 2015; Fan and Zhang 2014). The lack of morphological differences adequate to easily distinguish between species, makes molecular tools highly valuable for precise identification. DNA barcodes are short sequences of a single gene present in a wide number of species and have been employed as a useful tool facilitating identification of closely related species and provide, most of the time, accurate species assignment (Hebert et al. 2003; Janzen et al. 2005; Meier et al. 2006; Yang et al. 2011; Puillandre et al. 2012; Pentinsaari et al. 2016). One of the most widely employed markers is the mitochondrial Cytochrome Oxidase subunit I (COI), which has been used to investigate intra- and interspecific variation in many arthropods including various mites, such as, feather mites (Bochkov et al. 2014; Doña et al. 2015; Klimov et al. 2017), phytophagous mites (Navajas et al. 1996; Skoracka and Dabert 2010; Khaing et al. 2015), predatory mites (Li et al. 2012), and stored product mites (Webster et al. 2004; Yang et al. 2011; Khaing et al. 2014; Sun et al. 2014; Erban et al. 2016; Yang and Li 2016; Que et al. 2016). This locus possesses a high level of variability, enabling distinction between two or more groups of individuals that originally were described by morphological characters either as a single or as distinct species and helps to establish the species status of these individuals (Hebert et al. 2003, 2004a; Pentinsaari et al. 2016). Several studies have used COI (Xia et al. 2007; Yang et al. 2011; Khaing et al. 2014; Erban et al. 2016) or other molecular markers (Noge et al. 2005; Yang et al. 2011; Beroiz
13
Exp Appl Acarol
et al. 2014) to identify some species of Tyrophagus: T. putrescentiae, T. fanetzhangorum, T. neiswanderi, T. similis, and T. longior. However, there is still much uncertainty regarding the genetic variation within and among species in Tyrophagus. Until now, no study has reported population genetic structure in any of the species of this genus. Here we infer phylogenetic relationships of seven species of Tyrophagus based on COI sequences (1.2 kb) including several economically important species: T. putrescentiae, T. curvipenis, T. fanetzhangorum, T. longior, T. perniciosus, and T. cf. similis. We then use this phylogeny to validate previously defined morphospecies. For species clustering as monophyletic groups, we calculate within- and between-species genetic distances. In particular, we focus on T. curvipenis, a potential agricultural pest (see above), which is difficult to distinguish from T. putrescentiae and T. fanetzhangorum. Based on results of our analyses, we summarize important morphological differences between T. curvipenis and T. putrescentiae and provide new information on the distribution of the former species.
Materials and methods Mite samples and morphological identification Samples were collected from 13 countries and numerous habitats (Table 1). Mites were manually collected with a mounting needle under a dissecting microscope and stored in ethanol (99.5%). When needed, materials containing mites were sieved. Slides were prepared in Hoyer’s medium, and the specimens were identified using the most recent taxonomic keys (Fan and Zhang 2007, but see Klimov and OConnor (2009) with regard to T. putrescentiae). The specimens used to sort out the relevant morphological differences between T. putrescentiae and T. curvipenis were collected in Costa Rica from chayote plants (Sechium edule). Voucher specimens are deposited in the University of Michigan Museum of Zoology (UMMZ), Ann Arbor, MI, USA.
DNA extraction, amplification and sequencing The specimens used for DNA extraction were preserved in 99.5% ethanol and stored at − 80 °C. Genomic DNA was extracted from a single specimens using a QIAamp DNA Micro kit (Qiagen) following the manufacturer’s protocol for tissues, with some modifications (Klimov and OConnor 2008). A fragment of 1257 bp of the COI gene was amplified by a nested PCR using the following primers (5′-3′): COX1_16F (TGANTWTTTTCHACWAAYCAYAA), COX1_1324R (CDGWRTAHCGDCGDGGTAT) and COX1_25Fshort_T (TGTAAA ACGACGGCCAGTTCHACWAAYCAYAARRAYA), COX1_1282R_T (CAGGAAACA GCTATGACCCCWVYTARDCCTARRAARTGTTG) (Klimov et al. 2018). For uniform sequencing, M13FORW/REV tails (underlined in the sequences above) were added to the COX1_25Fshort_T forward and COX1_1282R_T reverse primers. Amplification reactions were performed in a 20-µl volume with Platinum Taq DNA Polymerase (Invitrogen) in a Mastercycler gradient, Eppendorf thermocycler. The master mix for initial PCR contained: 2.0 µl of PCR buffer (1X), 1.4 µl MgSO4 (50 mM), 1.4 µL of dNTP (10 mM each), 0.8 µl of each oligonucleotide primers COX1_16F and COX1_1324R (10 µM), 0.12 µl of Platinum Taq polymerase (1.5U) and 0.4–1 µl of genomic DNA template. The total volume was increased to 20 µl with distilled water. The thermocycler
13
13
National University of Singapore, Allergy and Molecular Immunology Laboratory Larry Arlian lab culture, Montgomery Co., Dayton. Wright State University Lab colony Biological Crop Protection Lab culture from grain store maintained by the Crop Research Institute, Prague Cricket rearing, University of Michigan On a dead scorpion (Tityus serrulatus) Lab sample, very likely a subsample of RA Norton collection Syracuse/NY. Received via Ina Schäfer as presumed vouchers for study of Domes et al. 2007 Lab cultures started from a CSL culture (UK) and maintained by the Crop Research Institute, Prague
Singapore
Czechia
Germany
Brazil
USA: MI
Czechia
UK
USA: OH
Lab culture from Greer Laboratories
USA: NC
Tyrophagus putrescentiae
Host/locality
Country
Mite species
BMOC 13-1115-056 KY986249 BMOC 08-0801-004 KY986250
BMOC 08-1010-005 KY986251
AD1693 AD1400
AD1337
BMOC 14-0318-002 KY986248
BMOC 08-1010-002 KY986247
AD1398 AD1695
BMOC 07-0223-006 KY986246
BMOC 08-0801-007 KY986245
AD1402 AD801
BMOC 08-0912-060 KY986244
AD1396
GenBank (GB) accession number
BMOC 08-0801-006 KY986243
Museum (BMOC) accession number
AD1401
Code
Table 1 Countries, hosts, localities and DNA codes used for the different species of Tyrophagus. Sequences KY986243- KY986280 were generated as part of this study
Exp Appl Acarol
Mite species
Table 1 (continued)
Belo Horizonte, Universidade Federal de Minas Gerais, Departamento de Zoologia, Laboratório de Sistemática e Evolução de Ácaros Acariformes Lab culture, Tokyo Women’s University of Medicine Dog food, Franklin Co., Columbus, OSU campus Minas Gerais, Dry fruits (with some fungus) of Terminalia catappa on ground Minas Gerais, Sabará Melipona quadrifasciata nest Sechium edule. Aged flowers attached to ripened fruit Ujarrás, Cartago. Polypore fungus. Parque Nacional Braulio Carrillo, Los Palmas trail Partamona orizabaensis nest, Universidad Nacional Zophobas morio, lab rearing, Museo de Insectos, Universidad de Costa Rica Palm seeds (Arecaceae) on the floor E.E.F.B.M. Universidad de Costa Rica
Brazil
Costa Rica
Costa Rica
Costa Rica
Costa Rica
Costa Rica
Brazil
Brazil
USA: OH
Japan
Host/locality
Country
Museum (BMOC) accession number
GenBank (GB) accession number
BMOC 15-0601-120 KY986263 BMOC 15-0601-181 KY986264
AD2015 AD1912
BMOC 15-0601-208 KY986261
AD2004
BMOC 15-0601-107 KY986262
BMOC 15-0601-164 KY986260
AD1999
AD2013
BMOC 15-0104-035 KY986259
BMOC 15-0104-002 KY986257
AD1974 AD1979
BMOC 14-0614-020 KY986256
BMOC 08-0801-001 KY986254
AD1751
AD1274
AD1692, AD1721, AD1722 BMOC 13-1115-053 KY986255, KY986252, KY986253
Code
Exp Appl Acarol
13
Mite species
Table 1 (continued)
Host/locality
The Netherlands Lab culture Koppert maintained by the Crop Research Institute, Prague Czechia Lab culture maintained by the Crop Research Institute, Prague Czechia Lab culture Phillips maintained by the Crop Research Institute, Prague Italy Lab culture Ham maintained by the Crop Research Institute, Prague Czechia Lab culture Nestlé maintained by the Crop Research Institute, Prague China GenBank sequence (no other data) China GenBank sequence (no other data) China GenBank sequence (no other data) China Lab culture, Nanchang, Jiangxi province China Central Science Laboratory (CSL), York (UK) China Lab culture, Shangai China Lab culture, Shangai China Lab culture, Shangai
Country
13 BMOC 15-0717-013 KY986258 BMOC 15-0717-014 KY986274 BMOC 15-0717-015 KY986275 BMOC 15-0717-016 KY986276
AD1925 AD1926 AD1927 AD1928
HQ287793 HQ287795 HQ287796
AY525572
NC_026079
EF527826
EU078969
EU078968
BMOC 15-0717-012 KY986273
AD1924
GenBank (GB) accession number
Museum (BMOC) accession number
Code
Exp Appl Acarol
USA: MI China Belgium
Tyrophagus longior
Tyrophagus sp. (close to T. longior)
USA: MI Belgium South Korea
Tyrophagus perniciosus Tyrophagus sp. (T. cf. similis)
Russia
Costa Rica
Costa Rica
Tyrophagus curvipenis
Rotting grass Lab culture ALK-ABELLÓ, Madrid Sechium edule, subcortical part of aged (discolored) stem Nest of a small bird in a cow shed Inside Prunus persica fruits (imported from Spain), Tyumenskaya Oblast’ Grain spill Rotting grass GenBank sequence from Spinacia Cheese GenBank sequence from flour Rotting grass
EST consensus
Singapore
Belgium Spain
Host/locality
Country
Tyrophagus fanetzhangorum
Mite species
Table 1 (continued) GenBank (GB) accession number
CN766680, CN766646, CN766809, CN767131, CN766804, CN767087 BMOC 06-0910-062 KY986265, KY986266 BMOC 08-0801-002 KY986267
Museum (BMOC) accession number
AD1685
AD1725
AD444 AD1686
AD1972
BMOC 14-0602-001 KY986279 NC_028725 BMOC 06-0910-062 KY986280
BMOC 00-1103-013 KY986277 BMOC 06-0910-062 KY986278 KM199641
BMOC 14-0730-046 KY986272
AD1911, AD2017, AD2018 BMOC 15-0601-167 KY986271, KY986268, KY986269 AD2025 BMOC 15-0601-204 KY986270
AD1691, AD1687 AD1275
Code
Exp Appl Acarol
13
Exp Appl Acarol
protocol was set as follows: 94 °C for 2 min, 10 cycles of 94 °C for 30 s, 40 °C for 1 min, 72 °C for 2 min, and 25 cycles of 94 °C for 30 s, 48 °C for 35 s and 72 °C for 2 min, with a final extension step of 72 °C for 7 min. For the second PCR, the master mix was modified with a reduced quantity of Taq Polymerase 0.08 µl (1.0 U), 0.6 µl of PCR products from the first PCR reaction and the primers COX1_25Fshort_T and COX1_1282R_T. The thermocycler protocol was set as follows: 94 °C for 2 min, 20 cycles of 94 °C for 30 s, 49 °C for 30 s, 72 °C for 2 min, and 18 cycles of 94 °C for 30 s, 52 °C for 35 s and 72 °C for 2 min, with a final extension step of 72 °C for 7 min. PCR products were visualized by electrophoresis on a 1.5% agarose gel, 1X TA buffer, 100 V for approximately 35 min. Bands were excised under UV light and purified with QIAquick® gel extraction kit (Qiagen). Sequencing was done in both directions using a 3730XL sequencer (Applied Biosystems) at the University of Michigan DNA sequencing Core.
Sequence editing, genetic distance and diversity indexes Chromatograms were resolved in Sequencher v.5.4.6 (Sequencher® 2016); primer and low-quality sequences were trimmed. The original length of the amplified COI sequences was 1257 bp. After trimming, the final COI alignment included 1227 sites for 39 sequences including the outgroup (AD513 Sancassania sp.). Sequences were imported to Mesquite (Maddison and Maddison 2011) and each codon was color-coded according to its amino acid translation. No indels or stop codons, which are indicative of pseudogenes, were detected. The sequences were deposited in GenBank under the accession numbers KY986243-80 (Table 1). An additional 11 COI sequences of Tyrophagus were retrieved from the nucleotide and EST GenBank databases (NCBI) (Table 1). The retrieved sequences were aligned and checked for quality. Primer sequences and low-quality regions were removed from the dataset. Uncorrected and K2P (Kimura’s two parameter) pairwise genetic distances were calculated in the software Sequence Matrix (Vaidya et al. 2011). The number of polymorphic sites and genetic diversity indexes (nucleotide diversity) were calculated for T. putrescentiae using the software DNAsp5.1 (Librado and Rozas 2009). The results obtained in DNAsp5.1 for the haplotype diversity were used for haplotype network analyses. We assessed the genetic structure through median-joining haplotype networks (Bandelt et al. 1999) using the software PopArt (Leigh and Bryant 2015). A barcoding gap analysis was performed to compare the genetic distances using the program ABGD (Puillandre et al. 2012). This program was run with the following arguments:/ abgd-a-p 0.001-P 0.17-d 0-X 1.5. Pairwise distances were calculated using K2P. Non-synonymous/Synonymous ratio (Ka/Ks) was calculated with the software HyPhy (Kosakovsky-Pond et al. 2005) using the server Datamonkey (Delport et al. 2010). A Mixed Effects Model of Evolution (MEME) was used to detect specific sites evolving under positive selection (Murrell et al. 2012). We also used the phylogenetic partition codon model BUSTED (Branch-Site Unrestricted Statistical Test for Episodic Diversification) to test for gene-wide selection in T. putrescentiae lineages (Murrell et al. 2015).
13
Exp Appl Acarol
Phylogenetic analysis A nucleotide substitution model and a codon-based model were tested. The best-fitting nucleotide substitution model (HKY + G + I) was selected based on the Akaike Information Criterion (AIC) as implemented in MEGA v.7 (Kumar et al. 2016). The phylogenetic analysis was done in RAxML (Stamatakis et al. 2008) using a Maximum Likelihood (ML) framework. Statistical support for bipartitions was estimated by a bootstrap analysis with 1000 replicates. The GY94 codon-based model (Goldman and Yang 1994) was implemented in HyPhy (Kosakovsky-Pond et al. 2005) and MrBayes (Huelsenbeck and Ronquist 2001).
Results Geographic distribution of Tyrophagus curvipenis Since its description in 1993 by Fain and Fauvel, T. curvipenis has been reported from several places in Europe, Australia and New Zealand. Our study records this species for the first time in the New World (Fig. 1). We morphologically identified T. curvipenis in UMMZ collected in 1977 from a Microtus pennsylvanicus (Rodentia: Cricetidae) nest in Maryland (USA) (BMOC 77-0510-004, no sequence data), and we found it on chayote fruits (Fig. 2) and stems from Costa Rica in 2015. Due to the commercial importance of this fruit (Barquero 2015), these collections will be described in more detail below. In addition to these, we found T. curvipenis in large numbers inside a nectarine fruit (Prunus persica) imported from Spain to Russia, and a small population from a bird nest from Costa Rica (Table 1). On chayote, we observed large numbers of mites (mixed population of T. putrescentiae and T. curvipenis) in the field. Mites initially increased their numbers on decaying fruits or leaves, and once the population increased, they migrated and colonized other chayote plants, principally those showing some level of damage or decomposition. As the leaves are very close to the fruits, it is very likely that some of the mites moved from the leaves
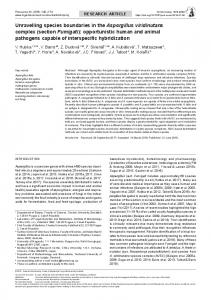
Fig. 1 Geographic distribution of Tyrophagus curvipenis. Light gray color indicates previous records and dark gray color indicates the new records for this species. (Color figure online)
13
Exp Appl Acarol
Fig. 2 Floral remains on the cavity of a chayote fruit and a close up of Tyrophagus sp. and fungal hyphae growing on the floral remains
to the fruits. Most of the mites were detected in the cavity between the flower and the fruit (where the flower is attached to the fruit) (Fig. 2). The majority of the mites was observed in association with fungi or algae that grew on the plants or fruits (Fig. 2). However, regardless of the large number of mites found in the field, there was no (or at least we did not notice) direct damage caused by the feeding of the mites on the plants or fruits.
Morphological differences between Tyrophagus putrescentiae and T. curvipenis Tyrophagus putrescentiae (TP) and T. curvipenis (TC) are morphologically similar, but each has distinguishing characters. We used the specimens found in chayote plants to verify the diagnostic characters that separated these two species. The major differences are: (1) proximal part of spermathecal duct in TC is slender (Fig. 3a), whereas in TP it is gradually widened (Fig. 3b); (2) coxal plate II in TC is broad and there is no distinct concavity in the posterior margin (Fig. 3c), whereas in TP, the coxal plate II is medium sized and a shallow but distinct concavity is noticeable in the posterior margin (Fig. 3d); (4) solenidia ω1 on tarsi I–II are slender in TC (Fig. 3e), whereas in TP they are wider (Fig. 3f); (4) the shaft of the supracoxal seta (scx) in TC is slender or moderately tapering from base to apex (Fig. 3g), whereas in TP it is prominently enlarged at the base of pectinations (Fig. 3h). For more details about the characters that these two species share, and differences with other species refer to Fan and Zhang (2007).
Genetic distances and barcoding gap analysis Genetic distances among the three species, T. putrescentiae (TP), T. curvipenis (TC) and T. fanetzhangorum (TF), were greater than within-species distances of any of these species (Table 2). Genetic distances within TC (TC vs. TC) and TF (TF vs. TF) were lower than those exhibited by TP (TP vs. TP). In TP, both K2P and the uncorrected distances indicated the presence of considerable within-species variation (Table 2) (range, mean ± SD): 0–4.33,
13
Exp Appl Acarol
Fig. 3 Main morphological characteristics differentiating Tyrophagus curvipenis and T. putrescentiae. a spermatheca T. curvipenis (♀), b spermatheca T. putrecentiae (♀), c coxal plate II T. curvipenis (♀), d coxal plate II T. putrescentiae (♀), e omega I (ω1) T. curvipenis (♀), f omega I (ω1) T. putrescentiae (♀), g supracoxal seta (scx) T. curvipenis (♀), h supracoxal seta (scx) T. putrescentiae (♀)
13
Exp Appl Acarol
Table 2 Uncorrected and K2P (Kimura’s two parameter) intra- and interspecific genetic distances (%) of Tyrophagus putrescentiae (TP), T. curvipenis (TC) and T. fanetzhangorum (TF) K2P Comparison
Uncorrected
Mean ± SD
Range
Mean ± SD
Range
TP versus TP
1.78 ± 1.44
0.00–4.33
1.54 ± 1.34
0.00–3.58
TC versus TC TF versus TF TP versus TC TP versus TF TC versus TF
0.83 ± 0.56 0.98 ± 0.15 15.17 ± 0.40 17.03 ± 0.43 18.44 ± 0.42
0.00–1.31 0.82–1.15 14.20–16.30 15.89–18.11 17.88–19.17
0.84 ± 0.57 0.97 ± 0.15 13.60 ± 0.27 15.12 ± 0.29 16.16 ± 0.32
0.00–1.30 0.81–1.14 12.92–14.18 14.32–15.97 15.72–16.70
1.78 ± 1.44 (K2P) and 0–3.58, 1.54 ± 1.34 (uncorrected). Genetic distances between TP versus TF and TP versus TC were lower than those exhibited by TC versus TF (Table 2). The highest between-species difference was observed between TC and TF (range, mean ± SD): 17.88–19.17, 18.44 ± 0.42 (K2P) and 15.72–16.70, 16.16 ± 0.32 (uncorrected). The barcoding gap analysis (Fig. 4) shows the distribution for the pairwise differences, where the left side of the histogram (low divergence) represents the intraspecific differences, and the right side of the histogram (higher divergence) represents the interspecific differences. The intraspecific distances fluctuate from 0.00 to 0.05, whereas the
nbr 225
282
188
157
135
112
98
67
45
22
8.21
8.20
8.19
8.18
8.17
8.16
8.15
8.14
8.12
8.11
8.10
8.09
8.08
8.07
8.06
8.05
8.03
8.02
8.01
8.00
Dist. value
Fig. 4 Barcoding gap analysis for the species of Tyrophagus. Pairwise distances for all sequences were calculated using K2P. Within- and between-species pairwise genetic distances are on left and right side of the graph, respectively
13
Exp Appl Acarol
interspecific distances can vary from 0.12 to 0.21. The intra-interspecies gap ranges from 0.05 to 0.12 (Fig. 4).
Amino acid mutations We looked for non-synonymous mutations that resulted in amino acid changes. In the circumstances where no amino acid changes occur, it is more likely that we are dealing with the same species as mutations at the DNA level do not result in phenotypical changes. In addition, departure from neutral evolution, which is the common assumption of many phylogenetics programs, can be detected by comparing synonymous versus non-synonymous mutations. Some amino acid changes were found in the sequences within the two T. putrescentiae (TP) groups. Independently of the group, several samples had amino acid changing mutations (Table 3) whereas others had only synonymous mutations (not causing amino acid substitutions) when comparing to a reference (AD1398, sequenced from the population used to designate the neotype of TP). We found a total of five non-synonymous mutations in nine of the samples; of these two mutations occurred in a single specimen belonging to group 2 (Table 3). It is interesting that all other sequences classified in group 2 shared the identical amino acid sequences with the reference. Several sequences from group 1 presented one amino acid change. The cluster that includes AD1912, AD1974, AD1999, AD2004, AD2013 and AD2015, showed one novel non-synonymous mutation, alanine A194 to serine S194. Other non-synonymous mutations occurred in AD1924 (leucine L187 to phenylalanine F187) and AD1928 (glycine G173 to serine S173). In comparison to TP, all sequences of T. curvipenis had four non-synonymous mutations (glutamic acid E331 to aspartic acid D331, serine S333 to glycine G333, threonine T402 to valine V402 and alanine A414 to valine V414) and T. fanetzhangorum had two non-synonymous mutations: isoleucine I361 to leucine L361 and valine V391 to isoleucine I 391 (Table 3). The ka/ks rate radio (according with MEME) for Tyrophagus was of 0.00384. This model found no evidence for positive/diversifying selection in all the sites. Also, BUSTED found no evidence (LRT, p = 0.46) of gene-wide episodic diversifying selection for the branches of TP. Therefore, there is no evidence that any sites have experienced diversifying selection.
Phylogenetic analysis Our phylogenetic analysis recovered two distinct groups of Tyrophagus that coincide with the presence or absence of eyespots (Fig. 5). The first clade corresponds to the group with eyespots, including T. putrescentiae, T. curvipenis and T. fanetzhangorum, and the second, to the group without eyespots including T. longior, T. perniciosus and T. cf. similis. Two different groups were identified among T. putrescentiae samples (Fig. 5). The first group includes the majority of the samples and was widely distributed, being present in several countries and substrates/hosts. No geographical or food preferences were apparent for the second group. Both the GenBank EST sequence data (Table 1) and the sequence AD1398 originated from the population used to designate the neotype by Klimov and OConnor (2009), fall within the group 1 of T. putrescentiae (Fig. 5). Some inconsistences were found in the sequences previously deposited in GenBank, and for this reason, these samples were not used in the final phylogenetic analyses
13
13 V81 ✓
✓ ✓ ✓ I ✓ ✓
T. putrescentiae Group 1: AD1398 (KY986247)
T. putrescentiae Group 1: AD1398, 1401, 1396, 1402, 801, 1695, 1693, 1400, 1751, 1979, 1926, 1927 Group 2: AD1337, 1692, 1721, 1722, 1274
T. putrescentiae Group 1: AD1912, 1974, 1999, 2004, 2013, 2015 T. putrescentiae Group 1: AD1924 T. putrescentiae Group 1: AD1928 T. putrescentiae Group 2: AD1925 T. curvipenis AD1911, 1972, 2017, 2018, 2025 T. fanetzhangorum AD1275, 1687, 1691 ✓ ✓ S ✓ ✓ ✓
✓
G173
✓ F ✓ ✓ ✓ ✓
✓
L187
S ✓ ✓ ✓ ✓ ✓
✓
A194
✓ ✓ ✓ ✓ D ✓
✓
E331
✓ ✓ ✓ ✓ G ✓
✓
S333
✓ ✓ ✓ ✓ ✓ L
✓
I361
✓ ✓ ✓ ✓ ✓ I
✓
V391
✓ ✓ ✓ I V ✓
✓
T402
✓ ✓ ✓ ✓ V ✓
✓
A414
Table 3 Non-synonymous mutations in the CO1 gene of Tyrophagus putrescentiae, T. curvipenis and T. fanetzhangorum (amino acid position coordinates are based on the CO1 GenBank sequence KY986247)
Exp Appl Acarol
Exp Appl Acarol
Fig. 5 Maximum likelihood tree for species of Tyrophagus inferred from COI sequences. Bootstrap support is indicated next to each branch
(Supplementary Fig. S1). The inconsistences include sample NC_028725.1 (T. longior from China), which did not cluster with the group of mites without eyespots, and sample NC_026079.1 (T. putrescentiae from China), which did not cluster with either of the two groups of T. putrescentiae, but instead formed a basal branch of T. putrescentiae (Supplementary Fig. S1).
Genetic diversity indexes and haplotype network analysis of Tyrophagus putrescentiae Genetic diversity indexes were calculated for T. putrescentiae (Table 2). A total of 1165 sites were monomorphic, out of 1227 nucleotides sequenced. From the 62 polymorphic sites, 57 included synonymous and five non-synonymous mutations. As it was mentioned above (phylogenetic analysis), two different groups were identified within T. putrescentiae. Our analyses here, showed 16 different haplotypes for the two groups of T. putrescentiae which are separated from each other by 25 mutational steps (Fig. 6). Haplotype diversity was 0.934 and the average number of nucleotide differences (K) was 16.667. The network (Fig. 6) shows closely related haplotypes connected by lines and indicates the number of mutations (in parenthesis) between the most similar ones. For example, sample AD1979 (group 1) had more variation with respect to the other haplotypes that belong to the same group. Furthermore, sample AD1925 is the most distinct from the rest of the haplotypes from the group 2 (Fig. 6). This sample has two unique nonsynonymous mutations (Table 3). According with this network, AD1979 and AD1925, are the most dissimilar haplotypes from each other.
13
Exp Appl Acarol
Fig. 6 Haplotypes network for Tyrophagus putrescentiae. Numbers in parenthesis correspond to the mutational steps. Green dots correspond to group 1 and pink dots to group 2. (Color figure online)
Discussion Tyrophagus curvipenis: species boundaries, distribution and pest status Even though T. curvipenis has been previously reported from several places around the world (Fig. 1), it is very likely that the actual distribution of this mite is much broader. The limited number of records of T. curvipenis could be due to difficulties is distinguishing T. curvipenis from other closely related species, in particular the widespread species T. putrescentiae. Tyrophagus curvipenis is usually found in field situations rather than in stored products. It prefers habitats or hosts with irregular surfaces, such as the natural openings of chayote fruits (Fig. 2) or crevices formed on other plants. The preference of T. curvipenis for these areas is probably due to the high humidity retained there and the proliferation of fungi and algae that are available as a source of food. Whereas T. longior, T. putrescentiae, T. similis and T. neiswanderi have been reported as agricultural pests causing direct damage to plants (Buxton 1989; Fisher 1993; Kasuga and Amano 2003, 2006; Zhang 2003; Kasuga and Honda 2006; de Oliveira et al. 2007), there are no reports correlating the presence of T. curvipenis with any particular direct damage to plants or fruits. However, the possibility that T. curvipenis can feed on young leaves, flowering buds or fruits should then not be ignored. On the other hand, one can expect fungal transmission into the wounds on the leaves surface caused by the feeding of mites. An analogous situation is documented for Rhizoglyphus robini feeding on onions (Hanuny et al. 2008). It is known that T. curvipenis, like other species of Tyrophagus, is an omnivorous generalist and can consume different food types with different nutrient contents. Ye and Zhang (2014) evaluated the effect caused by three different diets on the development of T. curvipenis and concluded that even when the food type affects the body length and width of the adults, this species survived and developed normally regardless of different food sources. Even though T. curvipenis has not been associated with any particular damage,
13
Exp Appl Acarol
it is regularly intercepted at international ports of entry by quarantine inspectors in natural cavities or crevices of fruits and leaves, causing substantial disruptions in international trade (Barquero 2015, Ronald Ochoa, pers. comm. 2017).
Phylogeny of the genus Tyrophagus Our topology (Fig. 5) fully agrees with the current morphology-based taxonomy where the different species cluster separately. The tree clusters the species of Tyrophagus into two main lineages coinciding with the presence or absence of eyespots. In the lineage with eyespots (T. putrescentiae, T. curvipenis and T. fanetzhangorum), the three species were clearly separated from each other (Fig. 5). Our tree agrees with other phylogenetic works, separating different species of Tyrophagus (Beroiz et al. 2014; Khaing et al. 2014; Erban et al. 2016). However, our topology also showed some differences with respect to some of these studies. For example, Beroiz et al. (2014) inferred a tree for several species of Tyrophagus where this genus formed a paraphyletic group, whereas our tree found a monophyletic group for all the species under study. This previous result, however, probably simply represents a rooting artifact (an in-group root was used) rather than true phylogenetic relationships. Our phylogenetic tree (Fig. 5) detected two distinct groups within the clade of T. putrescentiae. The first group is widely distributed and is found more commonly than the second. Even though COI sequences separate these two groups of T. putrescentiae, this locus did not show any differences among geographical populations nor indicate any correlation between the populations and their habitats. This implies that gene flow may be limited between the two groups. Given these results, it is necessary to conduct additional studies to elucidate the genetic composition and morphological differences between these groups. It is important to emphasize that a single-locus does not provide enough evidence to absolutely delimit species, and it is better to use an integrative approach combining this data source along with other information (Padial et al. 2010; Schlick-Steiner et al. 2010; Yeates et al. 2011; Carstens et al. 2013; Hamilton et al. 2014; Pante et al. 2015). In particular, analyzing multiple loci under the multispecies coalescent model is clearly more advantageous than single-locus estimates. A multispecies coalescent framework can provide more accurate assessments of the process of allele coalescence for a given species history (DeSalle et al. 2005; Felsenstein 2006; Heled and Drummond 2010; O’Meara 2010; Rannala and Yang 2013; Zhang et al. 2014).
COI genetic distances and aminoacid changes in three closely related species Among T. curvipenis, T. putrescentiae, and T. fanetzhangorum, the highest intraspecific variation was found within the species T. putrescentiae (Table 2). This species also showed one or two aminoacid changes for some of the populations sequenced here (Table 3). In the circumstances where amino acid changes occur, it is possible the protein structure could change in different species. In this case, these amino acid changes do not represent a different species but might be an indication of divergence of these populations from other T. putrescentiae populations. These results are not surprising given its worldwide distribution and the extraordinary capacity that this species has to live in diverse habitats and consume different kinds of food (Hughes 1976; Duek et al. 2001; Zhang 2003; Fan and Zhang 2007; Klimov and OConnor 2009; OConnor 2009; Khaing et al. 2014). Additionally, international trade (mainly
13
Exp Appl Acarol
agricultural products and processed food) has allowed this species to move from one geographical region to another with few constraints (Dhooria 2016). The results obtained here contrast with those of Yang et al. (2011) who did not find any intraspecific variation within T. putrescentiae using the COI, probably due to the small size of the amplified region (377 bp) and the relatively few sequenced populations. Khaing et al. (2014) reported a small genetic variation (0.1 and 0.2% K2P) in their T. putrescentiae sample (370 bp for COI) with respect to other samples deposited in the GenBank database. Other studies (Beroiz et al. 2014; Erban et al. 2016) suggest a much larger variation within T. putrescentiae, as indicated by the large distances between terminals on the tree, but these did not report exact values. The average interspecific K2P genetic distances were higher than 15% for T. curvipenis, T. putrescentiae and T. fanetzhangorum (Table 2), suggesting that they are likely independent evolutionary lineages with no gene flow among them. Our results agree with previous findings (Beroiz et al. 2014; Erban et al. 2016) suggesting that T. putrescentiae and T. fanetzhangorum are valid species, despite the small number of morphological differences between them. Similarly, our results agree with crossing experiments demonstrating complete reproductive isolation between T. curvipenis and T. putrescentiae (= T. communis) (Fan and Zhang 2007). Although the mites were able to copulate with each other, females did not lay eggs (Fan and Zhang 2007), indicating that these two populations are reproductively isolated and could represent two separate species under the Biological Species Concept. Thus, results obtained in those breading experiments do support the general utility of DNA barcoding approach for reliable species delimitation. However, special attention is needed when species with high genetic variability are under study, as is the case of T. putrescentiae. Our results (Table 2) showed a high intraspecific variability reaching 4.3% (K2P distances), whereas the difference for the other species did not exceed 1.3% (T. curvipenis, K2P distances). Considering these results, one might interpret the data for the populations with the highest genetic distances (4.3%) and place them as separate species; however, according with our barcode gap analysis (Fig. 4) the intraspecific variation for these mites can range from 0 to 5%. The within-species distance of T. putrescentiae (4.3 or 5.8%, full dataset vs. the Folmer fragment only), is relatively high and broadly overlaps with between-species distances reported in the literature, e.g., 4% (Dowton et al. 2014), 3.1% (Doña et al. 2015), 3% (Hebert et al. 2004b; Smith et al. 2005), 2% (Rossini et al. 2016; Smith et al. 2005), or lower (Hebert et al. 2004a). However, species having compatible or higher within-species genetic distances are known as well: 10.1% in the human follicle mite, Demodex folliculorum (Demodecidae) (conseravtively recalculated from Palopoli et al. 2015), 5.7–6.8% in the common blue butterfly, Polyommatus icarus (Lycaenidae) (Wiemers and Fiedler 2007), and about 6% in the sea snail, Echinolittorina vidua (Littorinidae) (Williams and Reid 2004). Our haplotype analysis separated T. putrescentiae into 16 haplotypes and 2 groups (Fig. 6); however there was no strong geographic or habitat structure in the networks. Other studies found a similar pattern, where populations geographically separated were genetically more similar than geographically close populations (Noge et al. 2005; Beroiz et al. 2014).
13
Exp Appl Acarol
Quality of GenBank data The standardization of DNA barcodes enables using data from many studies (Pentinsaari et al. 2016); however, it is known that many sequences in GenBank are misidentified or still have attached primer/vector sequences. This makes it difficult to use those sequences in other studies and forces the user to be very careful in the analysis of the data when using these (Meier et al. 2006). Misidentification and primer joined to the sequences were two of the principal problems encountered here. Misidentification was suspected for T. longior sequence NC-028725 (Yang and Li 2016) as it clusters with other sequences of T. putrescentiae (Supplementary Fig. S1). Furthermore, we detected primer sequence contamination (oligonucleotide primer sequences which were not removed from the finished sequence) in several T. putrescentiae sequences EU078968, EU078969, EF527826, AY525572, HQ287793, HQ287795, HQ287796 (Webster et al. 2004; Xia et al. 2007; Wu et al. 2007; Yang et al. 2011). On the other hand, the sequences of those studies have in general a length of 377 bp (trimmed to 334 bp) corresponding to the central part of the COI region. Comparing these sequences with our trimmed fragments (1227 bp), the difference in sizes created inconsistencies in the tree changing its final topology (Supplementary Fig. S1).
Conclusions In this work, our barcode analysis confirmed the species status of T. curvipenis and other closely related species of Tyrophagus, which are difficult to separate by morphological characters and revealed a high genetic variability and complexity within T. putrescentiae. The large genetic distances and amino acid changes found for some T. putrescentiae populations could be explained by the worldwide distribution and large effective population size. Future studies, including species delimitation analyses, are not only necessary to disentangle the status for all the species of Tyrophagus but also to better determine the genetic structure of the two groups of T. putrescentiae among various populations. Important morphological differences between T. curvipenis and T. putrescentiae are presented, and we recorded for the first time the occurrence of T. curvipenis in the New World. Acknowledgements We thank Dr. Hugo Aguilar and Ing. Humberto Lezama from the University of Costa Rica for helping us arrange the visit and join us to the field. Greg Schneider (University of Michigan) and Ing. Humberto Lezama (University of Costa Rica) provided advice and practical help with sending samples from Costa Rica. Dr. Raquel Marchan (University of Michigan) helped with the elaboration of the map, and Dr. Abdolazim Mortazavi (Tarbiat Modares University) helped with some of the sequences used here. Maribel Beltrán for help with the illustrations. Martin Markovic and two anonymous reviewers provided important comments and feedback on the manuscript. PM was supported by Block grants from the Department of Ecology and Evolutionary Biology and a Rackham Graduate Student Research Grant (University of Michigan), University of Costa Rica (OAICE-08-CAB-147-2013), Consejo Nacional para Investigaciones Científicas y Tecnológicas (CONICIT-Costa Rica, FI-0161-13). PBK was supported by the Russian Foundation for Basic Research (No 15-04-05185-a and 15-04-02706 A to Sergey G. Ermilov), Coordenação de Aperfeiçoamento de Pessoal de Nível Superior (CAPES) Ciência sem Fronteiras (Brazil; PVE 88881.064989/2014-01), the Russian Science Foundation (Project No. 16-14-10109 to A. A. Khaustov), and the Ministry of Education and Science of the Russian Federation (No 6.1933.2014/K project code 1933). JH was supported by the Ministry of Agriculture of the Czech Republic (Project Number RO0417). The molecular work for this study was conducted in the Genomic Diversity Laboratory (GDL) of the Museum of Zoology of the University of Michigan.
13
Exp Appl Acarol
References Badieritakis EG, Thanopoulos RC, Emmanouel NG (2012) Mite fauna in foliage and litter of Medicago species in Greece. Int J Acarol 38(8):681–691. https://doi.org/10.1080/01647954.2012.734332 Bandelt HJ, Forster P, Röhl A (1999) Median-joining networks for inferring intraspecific phylogenies. Mol Biol Evol 16(1):37–48. https://doi.org/10.1093/oxfordjournals.molbev.a026036 Barquero M (2015) Estados Unidos amenaza con limitar ingreso de piña y chayote. Nacion, 17 June 2015. http://www.nacion.com/economia/agro/Unidos-amenaza-limitar-ingreso-chayote_0_1494250583.html. Accessed 26 May 2017 Beroiz B, Couso-Ferrer F, Ortego F, Chamorro MJ, Arteaga C, Lombardero M et al (2014) Mite species identification in the production of allergenic extracts for clinical use and in environmental samples by ribosomal DNA amplification. Med Vet Entomol 28(3):287–296. https://doi.org/10.1111/mve.12052 Bochkov AV, Klimov PB, Hestvik G, Saveljev AP (2014) Integrated Bayesian species delimitation and morphological diagnostics of chorioptic mange mites (Acariformes: Psoroptidae: Chorioptes). Parasitol Res 113(7):2603–2627. https://doi.org/10.1007/s00436-014-3914-9 Buxton JH (1989) Tyrophagus longior (Gervais) (Acarina; Acaridae) as a pest of ornamentals grown under protection. Plant Pathol 38(3):447–448. https://doi.org/10.1111/j.1365-3059.1989.tb02167.x Carstens BC, Pelletier TA, Reid NM, Satler JD (2013) How to fail at species delimitation. Mol Ecol 22(17):4369–4383. https://doi.org/10.1111/mec.12413 de Oliveira CM, Martins C, Návia D, Frizzas MR (2007) First record of Tyrophagus putrescentiae (Schrank) (Acari: Acaridae) in soybean plants under no tillage in Minas Gerais, Brazil. Cienc Rural 37(3):876– 877. https://doi.org/10.1590/S0103-84782007000300043 Delport W, Poon AF, Frost- Simon DW, Kosakovsky-Pond SL (2010) Datamonkey: a suite of phylogenetic analysis tools for evolutionary biology. Bioinformatics 26(19):2455–2457. https://doi.org/10.1093/ bioinformatics/btq429 DeSalle R, Egan MG, Siddall M (2005) The unholy trinity: taxonomy, species delimitation and DNA barcoding. Philos Trans R Soc Lond B Biol Sci 360(1462):1905–1916. https://doi.org/10.1098/ rstb.2005.1722 Dhooria MS (2016) Quarantine acarology. In: Dhooria MS (ed) Fundamentals of applied acarology. Springer, Singapore, pp 207–217. https://doi.org/10.1007/978-981-10-1594-6 Doña J, Diaz-Real J, Mironov S, Bazaga P, Serrano D, Jovani R (2015) DNA barcoding and minibarcoding as a powerful tool for feather mite studies. Mol Ecol Resour 15(5):1216–1225. https://doi. org/10.1111/1755-0998.12384 Dowton M, Meiklejohn K, Cameron SL, Wallman J (2014) A preliminary framework for DNA barcoding, incorporating the multispecies coalescent. Syst Biol 63(4):639–644. https://doi.org/10.1093/sysbi o/syu028 Duek L, Kaufman G, Palevsky E, Berdicevsky I (2001) Mites in fungal cultures. Mycoses 44(9–10):390– 394. https://doi.org/10.1046/j.1439-0507.2001.00684.x Erban T, Klimov PB, Smrz J, Phillips TW, Nesvorna M, Kopecky J, Hubert J (2016) Populations of stored product mite Tyrophagus putrescentiae differ in their bacterial communities. Front Microbiol 7:1046. https://doi.org/10.3389/fmicb.2016.01046 Fain A, Fauvel G (1993) Tyrophagus curvipenis n.sp. from an orchid cultivation in a green-house in Portugal (Acari: Acaridae). Int J Acarol 19(1):95–100. https://doi.org/10.1080/01647959308683544 Fan Q-H, Zhang Z-Q (2007) Tyrophagus (Acari: Astigmata: Acaridae). Fauna of New Zealand 56. Manaaki Whenua Press, Lincoln Fan Q-H, Zhang Z-Q (2014) Comment on the proposed conservation of usage by designation of a replacement neotype for Acarus putrescentiae Schrank, 1781 (currently Tyrophagus putrescentiae; Acariformes, Acaridae). Bull Zool Nomencl 71(2):99–102 Felsenstein J (2006) Accuracy of coalescent likelihood estimates: do we need more sites, more sequences, or more loci? Mol Biol Evol 23(3):691–700. https://doi.org/10.1093/molbev/msj079 Fisher S (1993) Observation of a new pest of cucumber in western Switzerland, Tyrophagus neiswanderi Johnston and Bruce (Acari: Acaridae). Rev Suisse Vitic Arboric Hortic 25:103–104 Goldman N, Yang ZH (1994) A codon-based model of nucleotide substitution for protein coding DNA sequences. Mol Biol Evol 11:725–736 Hamilton CA, Hendrixson BE, Brewer MS, Bond JE (2014) An evaluation of sampling effects on multiple DNA barcoding methods leads to an integrative approach for delimiting species: a case study of the North American tarantula genus Aphonopelma (Araneae, Mygalomorphae, Theraphosidae). Mol Phylogenet Evol 71:79–93. https://doi.org/10.1016/j.ympev.2013.11.007 Hanuny T, Inbar M, Tsror L, Palevsky E (2008) Complex interactions between Rhizoglyphus robini and Fusarium oxysporum: implications on onion pest management. IOBC-WPRS Bull 32:71–74
13
Exp Appl Acarol Hebert PDN, Cywinska A, Ball SL, deWaard JR (2003) Biological identifications through DNA barcodes. Proc Biol Sci 270(1512):313–321. https://doi.org/10.1098/rspb.2002.2218 Hebert PDN, Penton EH, Burns JM, Janzen DH, Hallwachs W (2004a) Ten species in one: DNA barcoding reveals cryptic species in the neotropical skipper butterfly Astraptes fulgerator. Proc Natl Acad Sci USA 101(41):14812–14817. https://doi.org/10.1073/pnas.0406166101 Hebert PDN, Stoeckle MY, Zemlak TS, Francis CM (2004b) Identification of birds through DNA barcodes. PLoS Biol 2(10):e312. https://doi.org/10.1371/journal.pbio.0020312 Heled J, Drummond AJ (2010) Bayesian inference of species trees from multilocus data. Mol Biol Evol 27(3):570–580. https://doi.org/10.1093/molbev/msp274 Hubert J, Stejskal V, Münzbergová Z, Kubátová A, Váňová M, Žďárková E (2004) Mites and fungi in heavily infested stores in the Czech Republic. J Econ Entomol 97(6):2144–2153. https://doi. org/10.1603/0022-0493-97.6.2144 Huelsenbeck JP, Ronquist F (2001) MRBAYES: Bayesian inference of phylogeny. Bioinformatics 17:754–755 Hughes AM (1976) The mites of stored food and houses. 2nd edn. In: Technical bulletin No. 9 of the Ministry of Agriculture, Fisheries and Food. Her Majesty’s Stationary Office, London, UK Janzen DH, Hajibabaei M, Burns JM, Hallwachs W, Remigio E, Hebert PDN (2005) Wedding biodiversity inventory of a large and complex Lepidoptera fauna with DNA barcoding. Philos Trans R Soc Lond B Biol Sci 360(1462):1835–1845. https://doi.org/10.1098/rstb.2005.1715 Kasuga S, Amano H (2003) Seasonal prevalence and susceptibility to agrochemicals of Tyrophagus similis (Acari: Acaridae) in spinach buds and agricultural soil under greenhouse conditions. Exp Appl Acarol 30(4):279–288. https://doi.org/10.1023/B:APPA.0000006513.29814.3b Kasuga S, Amano H (2006) Infestation of Tyrophagus similis Volgin (Acari: Acaridae) on spinach during the seed germination period. J Acarol Soc Jpn 15(1):69–73. https://doi.org/10.2300/acari.15.69 Kasuga S, Honda K (2006) Suitability of organic matter, fungi and vegetables as food for Tyrophagus similis (Acari: Acaridae). Appl Entomol Zool 41(2):227–231. https://doi.org/10.1303/aez.2006.227 Khaing TM, Shim J-K, Lee K-Y (2014) Molecular identification and phylogenetic analysis of economically important acaroid mites (Acari: Astigmata: Acaroidea) in Korea. Entomol Res 44(6):331–337. https:// doi.org/10.1111/1748-5967.12085 Khaing TM, Shim J-K, Lee K-Y (2015) Molecular identification of four Panonychus species (Acari: Tetranychidae) in Korea, including new records of P. caglei and P. mori. Entomol Res 45(6):345–353. https ://doi.org/10.1111/1748-5967.12135 Klimov PB, OConnor BM (2008) Origin and higher-level relationships of psoroptidian mites (Acari: Astigmata: Psoroptidia): evidence from three nuclear genes. Mol Phylogenet Evol 47(3):1135–1156. https:// doi.org/10.1016/j.ympev.2007.12.025 Klimov PB, OConnor BM (2009) Conservation of the name Tyrophagus putrescentiae, a medically and economically important mite species (Acari: Acaridae). Int J Acarol 35(2):95–114. https://doi. org/10.1080/01647950902902587 Klimov PB, OConnor BM (2010) Acarus putrescentiae Schrank, 1781 (currently Tyrophagus putrescentiae; Acariformes, Acaridae): proposed conservation of usage by designation of a replacement neotype. Bull Zool Nomencl 67(1):24–27. https://doi.org/10.21805/bzn.v67i1.a2 Klimov PB, OConnor BM (2015) Comment on Acarus putrescentiae Schrank, 1781 (currently Tyrophagus putrescentiae; Acariformes, Acaridae): proposed conservation of usage by designation of a replacement neotype. Bull Zool Nomencl 72(1):50–56. https://doi.org/10.21805/bzn.v72i1.a12 Klimov PB, Mironov SV, OConnor BM (2017) Convergent and unidirectional evolution of extremely long aedeagi in the largest feather mite genus, Proctophyllodes (Acari: Proctophyllodidae): evidence from comparative molecular and morphological phylogenetics. Molec Phylog Evol. 114:212–224. https:// doi.org/10.1016/j.ympev.2017.06.008 Klimov PB, OConnor BM, Chetverikov PE, Bolton SJ, Pepato AR, Mortazavi AL, Tolstikov AV, Bauchan GR, Ochoa R (2018) Comprehensive phylogeny of acariform mites (Acariformes) provides insights on the origin of the four-legged mites (Eriophyoidea), a long branch. Molec Phylog Evol. 119:105–117. https://doi.org/10.1016/j.ympev.2017.10.017 Kosakovsky-Pond SL, Frost SDW, Muse SV (2005) HyPhy: hypothesis testing using phylogenies. Bioinformatics 21(5):676–679. https://doi.org/10.1093/bioinformatics/bti079 Kumar S, Stecher G, Tamura K (2016) MEGA7: molecular evolutionary genetics analysis v. 7.0 for bigger datasets. Molec Biol Evol. 33:1870–1874 Lange WH, Bacon OG (1958) Crown mite damage on spinach: investigations demonstrate value of early chemical treatment for control of relatively new mite affecting spinach leaves. Calif Agric 12(2):9–16 Leigh JW, Bryant D (2015) PopArt: full-feature software for haplotype network construction. Methods Ecol Evol 6(9):1110–1116. https://doi.org/10.1111/2041-210X.12410
13
Exp Appl Acarol
Li J-B, Li Y-X, Sun J-T, Xue X-F, Xu X-N, Hong X (2012) COI barcoding as a molecular assay for the identification of phytoseiid mites. Syst Appl Acarol 17(4):397–406. https://doi.org/10.11158/ saa.17.4.8 Librado P, Rozas J (2009) DnaSP v5: a software for comprehensive analysis of DNA polymorphism data. Bioinformatics 25(11):1451–1452. https://doi.org/10.1093/bioinformatics/btp187 Maddison WP, Maddison DR (2011) Mesquite: a modular system for evolutionary analysis, v.2.75. http://mesquiteproject.org. Accessed 26 May 2017 Meier R, Shiyang K, Vaidya G, Ng PK (2006) DNA barcoding and taxonomy in Diptera: a tale of high intraspecific variability and low identification success. Syst Biol 55(5):715–728. https://doi. org/10.1080/10635150600969864 Murrell B, Wertheim JO, Moola S, Weighill T, Scheffler K, Kosakovsky-Pond SL (2012) Detecting individual sites subject to episodic diversifying selection. PLoS Genet 8(7):e1002764. https://doi. org/10.1371/journal.pgen.1002764 Murrell B, Weaver S, Smith MD, Wertheim JO, Murrell S, Aylward A, Eren K, Pollner T, Martin DP, Smith DM, Scheffler K, Kosakovsky-Pond SL (2015) Gene-wide identification of episodic selection. Molec Biol Evol 32(5):1365–1371. https://doi.org/10.1093/molbev/msv035 Navajas M, Fournier D, Lagnel J, Gutierrez J, Boursot P (1996) Mitochondrial COI sequences in mites: evidence for variations in base composition. Insect Mol Biol 5(4):281–285. https://doi. org/10.1111/j.1365-2583.1996.tb00102.x Noge K, Mori N, Tanaka C, Nishida R, Tsuda M, Kuwahara Y (2005) Identification of astigmatid mites using the second internal transcribed spacer (ITS2) region and its application for phylogenetic study. Exp Appl Acarol 35(1–2):29–46. https://doi.org/10.1007/s10493-004-1953-0 O’Meara B (2010) New heuristic methods for joint species delimitation and species tree inference. Syst Biol 59(1):59–73. https://doi.org/10.1093/sysbio/syp077 OConnor BM (2009) Cohort Astigmatina. In: Krantz GW, Walter DE (eds) A manual of acarology, 3rd edn. Texas Tech University Press, Lubbock, pp 565–657 Padial JM, Miralles A, De la Riva I, Vences M (2010) The integrative future of taxonomy. Front Zool 7:16. https://doi.org/10.1186/1742-9994-7-16 Palopoli MF, Fergus DJ, Minot S, Pei DT, Simison WB, Fernandez-Silva I et al (2015) Global divergence of the human follicle mite Demodex folliculorum: persistent associations between host ancestry and mite lineages. PNAS 112:15958–15963 Pante E, Schoelinck C, Puillandre N (2015) From integrative taxonomy to species description: one step beyond. Syst Biol 64(1):152–160. https://doi.org/10.1093/sysbio/syu083 Pentinsaari M, Salmela H, Mutanen M, Roslin T (2016) Molecular evolution of a widely-adopted taxonomic marker (COI) across the animal tree of life. Sci Rep 6:35275. https://doi.org/10.1038/srep3 5275 Puillandre N, Lambert A, Brouillet S, Achaz G (2012) ABGD, automatic barcode gap discovery for primary species delimitation. Mol Ecol 21(8):1864–1877. https://doi.org/10.1111/j.1365-294X.2011.05239.x Que S, Zou Z, Xin T, Xia B (2016) Complete mitochondrial genome of the mold mite, Tyrophagus putrescentiae (Acari: Acaridae). Mitochondr DNA A 27(1):688–689. https://doi.org/10.3109/19401 736.2014.913144 Rannala B, Yang Z (2013) Improved reversible jump algorithms for Bayesian species delimitation. Genetics 194(1):245–253. https://doi.org/10.1534/genetics.112.149039 Robertson PL (1959) A revision of the genus Tyrophagus, with a discussion on its taxonomic position in the Acarina. Aust J Zool 7(2):146–182. https://doi.org/10.1071/zo9590146 Rossini BC, Oliveira CAM, de Melo FAG, Bertaco VD, de Astarloa JMD, Rosso JJ et al (2016) Highlighting Astyanax species diversity through DNA barcoding. PLoS ONE. https://doi.org/10.1371/ journal.pone.0167203 Schlick-Steiner BC, Steiner FM, Seifert B, Stauffer C, Erhard C, Crozier RH (2010) Integrative taxonomy: a multisource approach to exploring biodiversity. Annu Rev Entomol 55:421–438. https:// doi.org/10.1146/annurev-ento-112408-085432 Sequencher® (2016) DNA sequence analysis software, v.5.4.6. Gene Codes Corporation, Ann Arbor, MI, USA. http://www.genecodes.com. Accessed 26 May 2017 Skoracka A, Dabert M (2010) The cereal rust mite Abacarus hystrix (Acari: Eriophyoidea) is a complex of species: evidence from mitochondrial and nuclear DNA sequences. Bull Entomol Res 100(3):263–272. https://doi.org/10.1017/S0007485309990216 Smith MA, Fisher BL, Hebert PDN (2005) DNA barcoding for effective biodiversity assessment of a hyperdiverse arthropod group: the ants of Madagascar. Philos Trans R Soc Lond B Biol Sci 360:1825–1834 Stamatakis A, Hoover P, Rougemont J (2008) A rapid bootstrap algorithm for the RAxML web servers. Syst Biol 75(5):758–771. https://doi.org/10.1080/10635150802429642
13
Exp Appl Acarol Sun E-T, Li C-P, Nie L-W, Jiang Y-X (2014) The complete mitochondrial genome of the brown leg mite, Aleuroglyphus ovatus (Acari: Sarcoptiformes): evaluation of largest non-coding region and unique tRNAs. Exp Appl Acarol 64(2):141–157. https://doi.org/10.1007/s10493-014-9816-9 Vaidya G, Lohman DJ, Meier R (2011) SequenceMatrix: concatenation software for the fast assembly of multi-gene datasets with character set and codon information. Cladistics 27(2):171–180. https://doi.org /10.1111/j.1096-0031.2010.00329.x Webster LMI, Thomas RH, McCormack GP (2004) Molecular systematics of Acarus siro s. lat., a complex of stored food pests. Mol Phylogenet Evol 32(3):817–822. https://doi.org/10.1016/j.ympev .2004.04.005 Wiemers M, Fiedler K (2007) Does the DNA barcoding gap exist? - a case study in blue butterflies (Lepidoptera: Lycaenidae). Front Zool. https://doi.org/10.1186/1742-9994-4-8 Williams ST, Reid DG (2004) Speciation and diversity on tropical rocky shores: a global phylogeny of snails of the genus Echinolittorina. Evol 58:2227–2251 Wu TB, Xia B, Zou ZW, Zhu ZM (2007) Molecular phylogeny of the Acaroidea (Acari: Astigmata) based on mitochondrial COI gene. Department of Bioscience, Nanchang University, Honggu Street, Nanchang, Jiangxi 330031, China (GenBank record) Xia B, Wu TB, Zhu ZM, Zou ZW (2007) Analysis of mitochondrial DNA COI gene fragment of Tyrophagus putrescentiae. Department of Biology, Nanchang University, Honggu, Nanchang, Jiangxi 330031, China (GenBank record) Yang B, Li C (2016) Characterization of the complete mitochondrial genome of the storage mite pest Tyrophagus longior (Gervais) (Acari: Acaridae) and comparative mitogenomic analysis of four acarid mites. Gene 576(2):807–819. https://doi.org/10.1016/j.gene.2015.11.012 Yang B, Cai J, Cheng X (2011) Identification of astigmatid mites using ITS2 and COI regions. Parasitol Res 108:497–503. https://doi.org/10.1007/s00436-010-2153-y Ye S-S, Zhang Z-Q (2014) Age and size at maturity in Tyrophagus curvipenis (Acari: Acaridae) when fed on three different diets. Syst Appl Acarol 19(4):506–512. https://doi.org/10.11158/saa.19.4.14 Yeates DK, Seago A, Nelson L, Cameon SL, Joseph L, Trueman JWH (2011) Integrative taxonomy, or iterative taxonomy? Syst Entomol 36(2):209–217. https://doi.org/10.1111/j.1365-3113.2010.00558.x Zhang ZQ (2003) Mites of greenhouses: identification, biology and control. CABI Publishing, Wallingford Zhang C, Rannala B, Yang Z (2014) Bayesian species delimitation can be robust to guide-tree inference errors. Syst Biol 63(6):993–1004. https://doi.org/10.1093/sysbio/syu052
13