Abstract. The feasibility of using ultrasound to investigate the bubble size distribution in dough is addressed. A model for the propagation of ultrasound in a ...
Investigating the bubble size distribution in dough using ultrasound Valentin Leroy (1), Yuanzhong Fan(1), A.L. Strybulevych(1), G.G. Bellido(2), J.H. Page(1), M.G. Scanlon(2) (1) Department of Physics & Astronomy (2) Department of Food Science, University of Manitoba, Winnipeg, Canada
Abstract The feasibility of using ultrasound to investigate the bubble size distribution in dough is addressed. A model for the propagation of ultrasound in a bubbly viscoelastic medium is presented and its relevant parameters are discussed, with a particular emphasis on how changes in the shear modulus and the bubble size distribution affect the ultrasonic velocity and attenuation. The model, experimentally verified with two well-characterized bubbly gels, is used to estimate the mean radius and distribution of bubbles in a sample of dough. 1. Introduction Air bubbles incorporated in dough during mixing are fundamental to breadmaking. They are crucial for the final texture of the bread (Campbell et al., 1998) and might even substantially affect the rheology of the dough (Chin et al., 2005). Even though the total volume fraction of gas is easy to determine from density measurements, the precise size distribution of bubbles in the dough is much more difficult to obtain. A technique consisting of analysing thin slices of frozen dough was used by Campbell et al. (1991) to determine bubble size distributions, and one can also obtain a detailed picture of the bubbles in the dough by x-ray tomography (Babin et al., 2005; Bellido et al., 2006). However, both methods are time consuming and impossible to use in a process plant. A promising new approach for analyzing bubble size distributions is to use ultrasound (Elmehdi et al., 2005). The presence of bubbles in a liquid is known to dramatically modify the propagation of ultrasonic waves. In particular, the velocity and attenuation as a function of frequency exhibit peaks whose shape and position are related to the distribution of bubble radii (Commander and Prosperetti, 1989). For Newtonian liquids with a volume fraction of gas bubbles much lower than 1%, a reliable model exists, and it can therefore be used to extract the dispersion in bubble sizes from ultrasonic measurements (Duraiswami et al., 1998). Most bubbly materials of practical interest, however, are viscoelastic and have a concentration of bubbles significantly higher than 1%. The aim of this paper is to show that, by providing an improvement to the model, ultrasound can be used to probe the bubble characteristics in a concentrated bubbly viscoelastic medium: wheat flour dough. 2. Model The model used in this article to describe the propagation of ultrasonic waves in a bubbly viscoelastic medium is a synthesis of ideas from three previous publications. The pioneering formula of Foldy (1945) is modified by Prosperetti (1977) to attain a better description of thermodynamic changes of the gas in the bubbles, and viscoelastic effects are included according to the work of Alekseev and Rybak (1999).
1
2.1. Governing equations Let us consider a monochromatic pressure plane-wave, with angular frequency ! , travelling through a bubbly medium, along the z direction. The pressure field is then of the type exp[i (kz " !t )] with an effective wave vector k given by: k 2 & #! v 0 $ % b, (1) where v0 is the velocity of waves in the matrix, and b is a term accounting for the effect of bubbles: (2) b & 4' ( N (r )dr f (r , ! ), 2
with N (r )dr the number of bubbles whose radius is between r and r % dr per unit volume, and f (r , ! ) is the scattering function of a bubble with radius r at frequency ! 2' . In line with experimental results for the bubble size distribution in dough (Bellido et al., 2006; Campbell et al., 1991), we consider a log-normal distribution of bubble radii: . #ln #r r0 $$2 + N tot (3) N (r ) & exp ," ), 2/ 2 2' /r ,)* with a total number of bubbles per unit volume, N tot , a median radius, r0 , and a logarithmic standard deviation / . It is usually more convenient to use the total volume fraction of bubbles 0 rather than N tot : 30 N tot & . (4) 3 4' 1 r0 1 exp 9/ 2 2 When a bubble is excited by a pressure wave whose wavelength is much larger than its radius #!r / v0 22 1$ , it undergoes radial oscillations and behaves like a harmonic oscillator, with a scattering function given by r! 2 f (r , ! ) & 2 (5) , ! 0 " ! 2 " i! 3 where ! 0 and 3 are the resonance angular frequency and the damping rate of the harmonic oscillator, respectively. A good approximation for ! 0 is (Alekseev and Rybak, 1999):
#
$
1 36P0 % 4 5 7 , (6) r 4 where 6 is the ratio of the specific heat capacities of the gas in the bubble, P0 is the static pressure of the gas, 4 the mass density of the matrix, and 5 7 the real part of its shear modulus. When the matrix is not elastic ( 5 7 & 0 ), ! 0 is known as the Minnaert angular frequency and its order of magnitude is 30 kHz for a 100 5m bubble in water at atmospheric pressure (Minnaert, 1933). The damping rate of the bubble involves three different loss mechanisms ( 3 & 3rad % 3vis % 3th ): the bubble loses energy by radiating ultrasonic waves
!0 8
( 3rad & ! 2 r / v0 ); viscous losses occur at the interface of the bubble ( 3vis & 45 77 / 4!r 2 , where 5 77 is the imaginary part of the shear modulus); and finally, thermal dissipation contributes to the damping ( 3th ). In the aim of not obscuring the main physical mechanisms involved in the theory, the complete set of exact equations we used for our calculations is not given here. More precisely, equation (6) should include a fuller description of the thermodynamics of the gas, along with effects due to surface tension. Those corrections, and the complete expression for 3th , can be found in Leighton (1994), pages 172 to 188. 2
It should be noted that the model presented here has been experimentally checked only for dilute bubbly liquids (Commander and Prosperetti, 1989; Wilson et al., 2005), but its validity for 0 larger than 1% is still questionable (Commander and Prosperetti, 1989; Kargl, 2002). Furthermore, to the authors’ knowledge, no experimental results demonstrating the effects of bubbles in viscoelastic media on ultrasonic velocity and attenuation have been presented in the literature. 2.2. Description of the different regimes Equations (1) to (6) give a good general picture of the propagation of ultrasonic waves in a bubbly medium. In particular, they show why bubbles have such a dramatic influence on the propagation of ultrasound. Bubbles exhibit a resonance at low frequency, i.e., at a frequency for which the wavelength is much larger than the radius of the bubbles. As a consequence, the scattering function f can make the term b in equation (1) large even though
#! / v0 $2
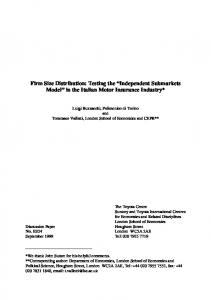
remains small. It follows that the propagation of ultrasound in a bubbly medium can usually be divided into three different frequency regimes (Figure 1), where the phase velocity ( v & ! / 9e(k ) ) and the attenuation ( ; & 2:m(k ) ) are plotted as a function of frequency for an inelastic medium.
Figure 1: Behaviour of the phase velocity (top) and attenuation (bottom) as a function of frequency illustrating the three different frequency regimes and the influence of 0. The bubble distribution is almost monodisperse (/ = 0.1) with a mean radius of 50 5m. Vertical bars correspond to f 0 and f1 at the lower and higher frequencies, respectively, for the 0 = 0.1% case.
At low frequencies, i.e., below the typical Minnaert frequency f 0 & !0 / 2' of the bubbles (see equation 6), the bubbly medium behaves like an effective medium in which ultrasound propagates with a low velocity, veff , that is determined by:
veff &
3P0 % 45 7 . 340
(7)
3
When the elasticity is null, equation 7 is equivalent to Wood’s approximation. Note that veff does not depend on the way the gas is divided up into bubbles within the medium, but solely on the total volume fraction of bubbles, 0 . Near and above f0, the attenuation and phase velocity of ultrasound in the medium undergo changes as a function of frequency that will be referred to as “peaks” in this article. The reason for these peaks is that bubbles respond in phase opposition to the incoming wave, yielding a large negative b term in equation 1, and consequently a negative k 2 . The upper frequency limit of the peak is given by v0 30 f1 8 (8) 2'r0 exp(2/ 2 ) As a rule of thumb, f1 corresponds to the frequency for which the wavelength is of the same order of magnitude as the typical distance between bubbles. At high frequencies, the phase velocity of ultrasound in the bubbly medium becomes close to the velocity of sound in the matrix v0 , and the attenuation attains much lower values than in the previous regime. 2.3. Relevant parameters The position and shape of phase velocity and attenuation peaks are strongly related to the size distribution of bubbles incorporated in the medium. One can thus consider using ultrasonic measurements to accurately determine r0 and / in an aerated sample. To do this, it is of course necessary to know the other parameters that affect the position and shape of the peaks. Among the complete list of the most relevant parameters ( 0, r0 , / , 5 7, 5 77, v0 , 4 , P0 ), three are usually well known ( 0, 4 , P0 ), two are more difficult to determine but have a second-order effect ( 5 77, v0 ), and three have a huge influence and are difficult to determine ( r0 , / , 5 7 ). We shall discuss in detail the influence of some of these parameters. Figure 1 emphasises the dramatic effect of the total volume fraction of bubbles on the acoustic parameters. At low frequency, increasing 0 decreases the phase velocity (in accordance with equation 7). Experimental verification of this result in dough mixed at different headspace pressures has been reported by Elmehdi et al. (2004). The peaks are also affected by 0 : they are broader with an increase in 0 because f1 increases and f 0 does not change (see equations 6 and 8), and the attenuation is larger and the phase velocity is lower with an increase in 0 . The higher attenuation is attributable to the larger number of scatterers. Figure 2 illustrates the influence of bubble polydispersity and the shear modulus of the matrix on the phase velocity and attenuation of the bubbly medium. Each line of the figure represents a distribution of bubble radii and the effect that this has on the phase velocity and attenuation for a matrix with three different values of the real part of its shear modulus. From the first row to the second, the influence of r0 is displayed. A decreasing median radius shifts f 0 to higher frequency (because it affects the Minnaert frequency, see equation 6). A smaller median radius also increases f1 as well as the maximum in the attenuation (because for a given volume fraction, smaller bubbles mean more bubbles). On going from row 2 to row 3 of Figure 2, the median size is maintained but the polydispersity of the distribution is significantly increased. As a result, f 0 is not changed
4
much, but both f1 and the maximum of attenuation are lowered (because –still for a given 0 - a more polydisperse distribution means fewer bubbles).
Figure 2: Influence of bubble polydispersity (volume fraction of 1%) and shear modulus of the matrix on the attenuation and phase velocity of ultrasound in a bubbly medium. First line, r0 = 50 5m and / = 0. ; second line, r0 = 25 5m and / = 0.1; third line, r0 = 25 5m and / = 0.6.
The influence of elasticity of the matrix is also shown in Figure 2. An increasing real part of the shear modulus makes f 0 larger (in accordance with equation 7). It should be noted that 5 7 has a significant influence only when its value is comparable with P0 . A point of particular interest in Figure 2 is that the high frequency parts of the peaks in both velocity and attenuation are not much affected by variation in values of the shear modulus. It means that even if 5 7 is unknown, r0 and / can be estimated from ultrasonic measurements in the high frequency region. However, a multiplicity of solutions involving r0 and / are possible (Equation 8), and as illustrated in Figure 2, the high frequency behaviour of row 1 is the same as that of row 3 because the term r0 exp(2/ 2 ) of Equation 8 is identical in both cases. 3. Material and method 3.1. Experimental setup and sample preparation The ultrasonic velocity and attenuation were measured with a pulsed transmission technique, using the equipment shown in Figure 3. A short Gaussian pulse, emitted by transducer 1, propagates through a three-layer system made of the sample sandwiched between two reference materials, and is recorded by transducer 2. Different pairs of transducers were used in order to cover a wide range of frequency (from 50 kHz to 5 MHz). Three different bubbly viscoelastic media were investigated. First, two types of transparent gels with known distributions of bubbles were used in order to validate the model. The first material was a commercial hair gel, with a negligible shear modulus, in which a fairly monodisperse distribution of air bubbles was injected with a 20 5m (i.d.) capillary connected to a syringe. The second transparent material was an agar gel (2% w/v) aerated by
5
bubbles entrained when the liquid sol is injected at high speed with a syringe, and the bubbles are then entrapped as the sol gels. For both transparent materials, the bubble size distributions were measured by image analysis. Ultrasonic measurements for these samples were performed in a tank of water ( 4 r & 1 g/cm3, v r & 1.5 mm/5s).
Figure 3: Sketch of the experimental device. An ultrasonic pulse is transmitted through a reference material (density 4 r , velocity vr ) and sample (density 4 , velocity v , attenuation ; , thickness d ).
The third material was unyeasted wheat flour dough (100g of CWRS flour, 61mL of distilled water and 2.4g of salt, mixed for 5.5 minutes). Since water can modify the properties of the dough, measurements were performed by sandwiching the sample between two acrylic plates ( 4 r & 1.19 g/cm3, v r & 2.74 mm/5s). Ultrasonic measurements were taken over a period of time for each transducer. 3.2. Signal processing The procedure used to measure v and ; relied on a comparison between the pulse s ref (t ) , transmitted through reference material only, and the pulse s sam (t ) , transmitted
through the reference materials plus sample. Let us denote R as the ratio of their Fourier transforms: FT ( s sam ) A ;d > A !d > (9) & T exp? " R& < exp? i