entropy Article
Investigating the Relationship between Classification Quality and SMT Performance in Discriminative Reordering Models Arefeh Kazemi 1, *, Antonio Toral 2 , Andy Way 3 , Amirhassan Monadjemi 1, * and Mohammadali Nematbakhsh 1 1 2 3
*
Department of Computer Engineering, University of Isfahan, Isfahan 81746-73441, Iran;
[email protected] Center for Language and Cognition, University of Groningen, Groningen 9712 EK, The Netherlands;
[email protected] ADAPT Centre, School of Computing, Dublin City University, Dublin 9, Ireland;
[email protected] Correspondence:
[email protected] (A.K.);
[email protected] (A.M.)
Received: 2 June 2017; Accepted: 23 June 2017; Published: 24 August 2017
Abstract: Reordering is one of the most important factors affecting the quality of the output in statistical machine translation (SMT). A considerable number of approaches that proposed addressing the reordering problem are discriminative reordering models (DRM). The core component of the DRMs is a classifier which tries to predict the correct word order of the sentence. Unfortunately, the relationship between classification quality and ultimate SMT performance has not been investigated to date. Understanding this relationship will allow researchers to select the classifier that results in the best possible MT quality. It might be assumed that there is a monotonic relationship between classification quality and SMT performance, i.e., any improvement in classification performance will be monotonically reflected in overall SMT quality. In this paper, we experimentally show that this assumption does not always hold, i.e., an improvement in classification performance might actually degrade the quality of an SMT system, from the point of view of MT automatic evaluation metrics. However, we show that if the improvement in the classification performance is high enough, we can expect the SMT quality to improve as well. In addition to this, we show that there is a negative relationship between classification accuracy and SMT performance in imbalanced parallel corpora. For these types of corpora, we provide evidence that, for the evaluation of the classifier, macro-averaged metrics such as macro-averaged F-measure are better suited than accuracy, the metric commonly used to date. Keywords: statistical machine translation; reordering model; classification; performance; correlation; intrinsic evaluation
1. Introduction Statistical Machine Translation (SMT) systems automatically translate from one natural language into another. Clearly, natural languages vary in their vocabularies and also in their grammatical structure, i.e., the manner in which they arrange words to make up sentences. Accordingly, in order to translate a sentence from the source language into the target language, SMT has to handle two problems: (i) finding the appropriate translation of the words in the source sentence (“lexical choice”), and (ii) predicting their correct order in the target sentence (“reordering”). Reordering is one of the most important factors affecting the quality of the final translation [1]. A large amount of research has been conducted to address the reordering problem, much of which follows the discriminative reordering model (DRM), i.e., they consider word reordering as an structured prediction problem and
Entropy 2017, 19, 340; doi:10.3390/e19090340
www.mdpi.com/journal/entropy
Entropy 2017, 19, 340
2 of 17
apply a discriminatively trained model to predict the appropriate word order. In order to predict the word order, most DRMs use a classifier which employs some features extracted from the words and computes the word order of the target sentence by predicting the orientation between the word pairs in the source sentence or the most probable jump length after each source word. In fact, the performance of the classification algorithm has a significant impact on the quality of the translation. To the best of our knowledge the relationship between classification quality and SMT performance has not been studied to date. It might be assumed that improvements in classifier quality will be monotonically reflected in overall SMT performance. This is the assumption that justifies previous work which tries to find the best classifier for an SMT system, based solely on the classifier quality metrics [2–4]. In this paper, we study the relationship between the performance of the reordering classifier and SMT quality in three parallel corpora from different language pairs, and experimentally show that this assumption does not always hold. The remainder of this paper is organized as follows. Section 2 reviews the related work and places our work in its proper context. Section 3 presents in detail the DRMs implemented for our experiment, including their conceptualization, the classifiers and the features used, and their integration into hierarchical phrase based SMT (HPB-SMT). Sections 4 and 5 contain the experiments carried out to investigate the relationship between classification performance and SMT quality. This is followed by in-depth analysis in Section 6. Finally, we outline conclusions in Section 7, together with some avenues for further research. 2. Related Work 2.1. Discriminative Reordering Models Many different approaches have been proposed to address the problem of reordering by incorporating a DRM into SMT. The core component of these DRMs is a classifier that tries to predict the appropriate word order for two words in the source sentence. Zens and Ney [2], Xiong et al. [5] and He et al. [6] used a maximum-entropy (henceforth maxEnt) classifier, while Li et al. [7] used a neural classifier to predict the orientation between neighbouring phrases. Bisazza and Federico [3] and Green et al. [8] employed a maxEnt classifier to predict the orientation of a source word in a given position with respect to another. Gao et al. [9] used a maxEnt classifier to predict the orientation between head and dependent words in the dependency tree of the source sentence. Kazemi et al. [10,11] used Naive-Bayes classifiers to predict the orientation between the dependants in the dependency tree of the source sentence. Xiong et al. [12] proposed a DRM that uses a maxEnt classifier to predict the order of the predicates and their associated arguments. Wang et al. [13] proposed a topic-based RM that uses a maxEnt classifier to predict the order of neighbouring phrases. Alrajeh et al. [14] used a multiclass SVM classifier to model phrase movements. Despite the huge amount of work on DRMs that use a classifier to predict reordering, to the best of our knowledge the relationship between classification quality and SMT performance has not been studied to date. In order to find the best classification algorithm or the best features to be used in the classifier in DRMs, it is important to study this relationship and evaluate the classifier in a way that ensures that the best classifier based on this evaluation, when used in the DRM of an SMT system, leads to the best SMT performance. 2.2. Intrinsic vs. Extrinsic Evaluation In general, there are two different ways to assess the quality of a component in a system: (i) intrinsic evaluation and (ii) extrinsic evaluation [15]. Intrinsic evaluation considers the isolated component and measures its performance on its particular sub-task. Extrinsic evaluation employs the component in the final system and measures the performance of the component in terms of its contribution to the overall performance of the system. For example, for the classifier in the DRM of an SMT system, intrinsic evaluation takes the classifier independently and evaluates it based on
Entropy 2017, 19, 340
3 of 17
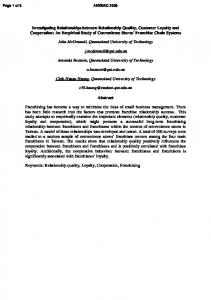
classification quality metrics such as accuracy and F-measure. Extrinsic evaluation employs the classifier in the DRM of the final SMT system and evaluates it by measuring the translation quality achieved by the SMT system. Since extrinsic evaluation is difficult and time-consuming, researchers generally tend to pursue intrinsic evaluation. In order to perform intrinsic evaluation, it is essential to investigate the relationship between intrinsic and extrinsic metrics and find an intrinsic metric which has a good correlation with the extrinsic one. In this paper, we investigate the relationship between classification performance and SMT quality, and provide some guidelines for intrinsic evaluation of the classification performance in SMT. It is worth noting that in the SMT area, most research conducted to date on intrinsic evaluation of SMT components has focused on word alignment. Fraser and Marcu [16,17] study the correlation between metrics used to measure word alignment quality and the BLEU [18] score. They show that previously used intrinsic metrics such as alignment error rate (AER) have a low correlation with the BLEU score, and hence are not suitable for predicting translation quality. For intrinsic evaluation of word alignment, they propose to use a variation of the F-measure which uses the coefficient α to modify the balance between precision and recall (with the optimal value for α depending on the corpus and the SMT task at hand). Ayan and Dorr [19] and Davis et al. [20] show that AER is a poor indicator of SMT performance and propose the “Consistent Phrase Error Rate” [19] and “Word Alignment Agreement F1” [20] metrics for intrinsic evaluation of the word alignment. Vilar et al. [21] argue against the assumption that better alignment increases translation quality, and show that improvement in alignment quality does not always imply an improvement in translation quality. They show that neither AER nor the proposed F-measure in [16,17] are essentially suitable metrics for intrinsic evaluation of word alignment in SMT, with the main flaw in both of these metrics being that they do not take the structure of the translation into account. Guzman et al. [22] study the relationship between word alignment and phrase extraction, and Tian et al. [23] study the relationship between word alignment, phrase table, and translation quality in SMT systems. 3. Discriminative Reordering Models 3.1. Method In order to investigate the relationship between classification quality and SMT performance in DRMs, we implement the two DRMs described in [9,10]. Both of these DRMs have been designed for hierarchical phrase-based SMT (HPB-SMT) [24] and are based on the dependency tree of the source sentence, which shows the grammatical relations between the words in that sentence. As an example, Figure 1 shows the dependency tree of an English sentence. In this figure, the arrow with label “adj” from “brown” to “fox” indicates that the dependent word “brown” is the adjective related to the head word “fox”. Two constituents in the dependency tree of the source sentence can be translated with monotone or swap orientation [25]. If the order of two constituents in the source sentence is the same as the order of their translations in the target sentence, the orientation is monotone and otherwise it is swap. We try to find the optimal word order of a sentence by predicting the orientation of its constituent pairs. To be more precise, we try to find the orientation of each dependent word with respect to its head (head-dep) [9] or with respect to its siblings (dep-dep) [10]. For example, for the sentence in Figure 1, our DRMs try to predict the orientations (ori) between the (head-dep) or (dep-dep) pairs that are shown in Table 1.
Entropy 2017, 19, 340
4 of 17
Figure 1. An example dependency tree for an English source sentence, its translation in Farsi and the word alignments. Table 1. head-dep and dep-dep pairs for the sentence in Figure 1 and their corresponding orientations when translating into Farsi. Head
Dependant
Ori
fox fox fox jumped jumped dog dog
the brown quick fox dog lazy the
M S S S S S M
Dep1
Dep2
Ori
the the brown the dog
brown quick quick lazy fox
M M M M M
3.2. Classifiers The core component of a DRM is a classifier, whose goal is to predict the correct orientation class (monotone or swap) for each (head-dep) and (dep-dep) pair. We use the maxEnt classifier for this task. Instead of using maxEnt to perform a hard classification, we use it to estimate the probability distribution over two orientation classes. The maxEnt classifier estimates the probability of the orientation type ori given the constituent pair pair as shown in Equation (1), where hn are binary features extracted from the constituent pair pair and λn are the weights of these features: N
exp ∑ λn hn (ori, pair ) n =0
P(ori | pair ) =
N
.
(1)
∑orii ∈{ Monotone,Swap} exp ∑ λn hn (orii , pair ) n =0
Table 2 shows the features that we used to characterize the constituent pairs in the maxEnt model. syn(w) shows the synonym set of the word w as found in Wordnet [26]. As an example, Table 3 shows the features that we use for the (dep-dep) pair “fox” and “dog” in our example in Figure 1. Synsets are represented by their unique identifiers in WordNet. Table 2. Features used in the maxEnt model. Feature
Description
lex (w) depRel (d) syn(w)
surface form of word w dependency relation between dependent word d and its head synset of word w
Entropy 2017, 19, 340
5 of 17
Table 3. Features for the (dep-dep) pair (“fox”,“dog”) in Figure 1. Feature
Values
lex (head), lex (dep1), lex (dep2) syn(head), syn(dep1), syn(dep2) depRel (dep1), depRel (dep2)
jumped, fox, dog SID-01945853-V, SID-02097711-N, SID-02064081-N nsubj, prep-over
In order to generate training instances for the maxEnt model, we use the dependency parse tree of the source sentence and the word alignments between the source and target words in the parallel corpus used for training the MT system. We extract all possible (head-dep) and (dep-dep) pairs for each sentence and determine the orientation type for each pair. Once we have obtained the orientation type for each constituent pair in the training part of our parallel corpus, we train the maxEnt classifier to estimate the probability of a source dependent word having monotone or swap order with respect to its head and its siblings. 3.3. Integration into HPB-SMT During translation, the HPB-SMT decoder [24] estimates the probability of translating the source sentence S into the translation hypothesis H, through a log-linear combination of several feature functions, as shown in Equation (2), where a is the latent word alignment between H and S, Fi is the i-th feature function (out of N total features) and wi is the weight of this feature. The translation hypothesis with the highest probability is then selected as the final translation: N
logP( H |S) =
∑ log(wi Fi ( H, S, a)).
(2)
i =1
The DRMs are implemented as four feature functions [10,27]: •
FdependencyCoherence ,
• • •
Fmonotone , Fswap , FunalignedPairs .
The feature functions are computed for hypothesis H, which has been applied to source sentence S with constituent pairs Pairs(S). FdependencyCoherence encourages concurrent translation of constituents, based on the assumption that constituents move together in the translation process [28]. It computes the number of covered constituent pairs by hypothesis H, as in Equation (3). In Equation (3), Covered( H, Pairs(S)) shows the constituent pairs of the source sentence S that have been covered by hypothesis H. A constituent pair is covered by H if H covers both words in the pair: FdependencyCoherence ( H, S) = |Covered( H, Pairs(S))|.
(3)
Fmonotone and Fswap compute the sum of the orientation probabilities of those constituent pairs which are translated in monotone or swap order, respectively. We determine the probability of the orientation type for the constituent pairs based on Equation (1). Based on the orientation class for a pair, we consider its score for calculating monotone or swap feature functions and compute Fmonotone and Fswap as shown in Equation (4), where a is the word alignment between S and H, and Aligned( H, Pairs(S), a) shows the aligned covered pairs based on the word alignment a. A constituent pair is aligned if both words in the pair are aligned to at least one target word: Fmonotone ( H, S, a) =
∑
P(ori | pair ),
pair ∈ Aligned( H,Pairs(S),a),ori ( pair )=monotone
Fswap ( H, S, a) =
∑
pair ∈ Aligned( H,Pairs(S),a),ori ( pair )=swap
P(ori | pair ).
(4)
Entropy 2017, 19, 340
6 of 17
It might happen that a word in a constituent pair is not aligned to any target word, so we obviously cannot determine the orientation and compute swap or monotone features in such a case. As this may lead to a search error [9], a penalty is applied by means of an unaligned-pairs feature FunalignedPairs , computed as the number of covered constituent pairs with at least one unaligned word, as shown in Equation (5): FunalignedPairs ( H, S, a) = |Covered( H, Pairs(S))| − | Aligned( H, Pairs(S), a)|.
(5)
After computing the four feature functions for the translation hypothesis at hand, we combine them with the other feature functions in the HPB-SMT model, as shown in Equation (2).
4. Generating Classifiers with Varying Quality In order to build an SMT system with a DRM, we require a parallel corpus, a word alignment of that corpus, a language model (LM) built from target-language sentences, as well as a DRM (with an embedded classifier). In this paper, we intend to study the impact of reordering classification quality on SMT performance. Accordingly, in all of our experiments, we keep the parallel corpus, the word alignment, and the LM constant and only vary the classifier. We create classifiers of varying quality by using different feature sets in the classifiers and training them on different amounts of data. We select the features for (head-dep) and (dep-dep) pairs from Table 2 [11], and then use them in the maxEnt classifier of our DRMs. We split the training part of the corpus into separate pieces corresponding to 1/2 and 1/4 of the original data. Then, we trained each of the classifiers on three data sets: the original data set and the two generated subsets. In this way, we have 18 reordering classifiers with different qualities. The feature sets and training data used in each classifier are shown in Table 4. Table 4. Training data and feature sets used in the classifiers. No.
Classifier
Training Data
Features
1 2 3
hd-lex hd-lex-half hd-lex-quarter
whole original data 1/2 of the original data 1/4 of the original data
lex (head), lex (dep), depRel (dep)
4 5 6
hd-syn hd-syn-half hd-syn-quarter
whole original data 1/2 of the original data 1/4 of the original data
syn(head), syn(dep), depRel (dep)
7 8 9
hd-both hd-both-half hd-both-quarter
whole original data 1/2 of the original data 1/4 of the original data
lex (head), lex (dep), depRel (dep), syn(head), syn(dep)
10 11 12
dd-lex dd-lex-half dd-lex-quarter
whole original data 1/2 of the original data 1/4 of the original data
lex (head), lex (dep1), lex (dep2), depRel (dep1), depRel (dep2)
13 14 15
dd-syn dd-syn-half dd-syn-quarter
whole original data 1/2 of the original data 1/4 of the original data
syn(head), syn(dep1), syn(dep2), depRel (dep1), depRel (dep2)
16 17 18
dd-both dd-both-half dd-both-quarter
whole original data 1/2 of the original data 1/4 of the original data
lex (head), lex (dep1), lex (dep2), depRel (dep1), depRel (dep2), syn(head), syn(dep1), syn(dep2)
5. Experiments We experiment with three parallel corpora for different language pairs: English–Farsi, English–Arabic and English–Turkish. The English–Farsi corpus (Tep++) [29] is extracted from film subtitles. The English–Turkish corpus is extracted from documents in the international relations and legal sphere [30]. Finally, the English–Arabic corpus is the News commentary corpus (v11) [31]. For all the
Entropy 2017, 19, 340
7 of 17
experiments, tuning and test sets were selected randomly from the main corpus with the remaining part of the corpus used for training. Table 5 shows the statistics of training, tuning and test sets for the three parallel corpora. In order to obtain the dependency trees of the source sentences, we used the Stanford dependency parser [32]. To generate word alignments, we used GIZA++ [33]. Having obtained both the dependency structure and the word alignment, we extracted (head-dep) and (dep-dep) pairs from the training sets and determined the orientation for each pair. Table 6 shows the reordering type distribution over the training sets of each language pair. To perform the classification task in the DRM, we used the Stanford maxEnt classifier [34] with default settings. Table 5. Parallel corpora statistics. Corpus
Train Sentences Words
Tune Sentences Words
Test Sentences Words
En–Fa
English Farsi
575,208 575,208
4,652,389 4,421,994
2000 2000
16,152 15,388
1000 1000
8136 7850
En–Ar
English Arabic
222,975 222,975
5,865,994 5,807,679
2000 2000
53,552 52,708
1000 1000
26,322 26,256
En–Tr
English Turkish
100,957 100,957
1,213,275 1,151,795
647 647
13,302 13,969
644 644
12,371 13,048
Table 6. Reordering type distribution over the training data for the parallel corpora. Corpus
En–Fa
En–Tr
En–Ar
Constituent
Head-Dep
Dep-Dep
Head-Dep
Dep-Dep
Head-Dep
Dep-Dep
Monotone Swap
63.04% 36.96%
71.92% 28.08%
55.70% 44.30%
60.93% 39.07%
70.89% 29.11%
87.62% 12.38%
Our baseline SMT system is the Moses implementation [35] of the HPB-SMT model, with standard settings. We integrated our DRMs as four additional features as described in Section 3.3. In all experiments, the weights of our reordering feature functions and the other built-in feature functions were tuned by MIRA [36]. We used a 5-gram LM trained on the target side of our training corpora. In order to evaluate the performance of the classifiers, we trained them on the training parts of the parallel corpora and evaluate them on the test part. We built 18 SMT systems, each using a DRM with a classifier built using a setting from Table 4. The machine-translated text is evaluated in the target language against its translation reference based on two popular automatic metrics: BLEU [18] and TER [37]. BLEU is the de facto standard automatic evaluation metric in the MT field, with a higher score indicating better translation quality. We also use TER as it is an error-rate metric whose score is based on the number of operations (insertions, deletions and edits) that are required to bring the MT output to match the reference, and thus provides an indication of the effort required to post-edit the MT output (the lower the TER value, the better the MT performance). In order to overcome the BLEU and TER variations created by the random processes in the tuning step, we tune each system three times and report the average scores obtained with multeval [38] on the MT outputs. 6. Results and Analysis 6.1. Relationship between Classification Performance and Translation Quality Reordering classifiers are generally evaluated intrinsically by measuring their accuracy. The accuracy of the classifier is the proportion of correctly classified examples. It might be assumed that
Entropy 2017, 19, 340
8 of 17
there is a strong monotonic relationship between the accuracy of the classifier in the DRM and SMT performance. To be more precise, it might be assumed that there is a strong positive correlation between the accuracy of the classifier and the BLEU score, and correspondingly that there is a strong negative correlation between the accuracy of the classifier and the TER score. In order to examine the validity of this assumption, we calculate Spearman’s rank correlation coefficient (rs ) between the classifier’s accuracy and the BLEU score and also between the classifier’s accuracy and TER. ρs shows how well the relationship between two variables can be described by a monotonic function. If ρs ( Accuracy, BLEU ) = 1, there is a perfect positive relationship between the accuracy and the BLEU score, i.e., the BLEU score increases when the accuracy of the classifier increases, and vice versa. Similarly, if ρs ( Accuracy, TER) = −1, there is a perfect negative relationship between the accuracy and the TER score, i.e., the TER score decreases when the accuracy of the classifier increases, and vice versa. The Spearman correlation between two variables (ρ) is equal to the Pearson correlation coefficient (r) between their rank values, as shown in Equation (6). In Equation (6), cov( Rank ( X ), Rank (Y )) is the covariance of the rank variables, and σ ( Rank ( X )) and σ ( Rank (Y )) are the standard deviations of the rank variables: ρs ( X, Y ) = r ( Rank ( X ), Rank(Y )) =
cov( Rank ( X ), Rank(Y )) . σ ( Rank ( X )) × σ ( Rank (Y ))
(6)
Figures 2–7 are scatter plots. Figures 2–4 show Spearman’s correlation of the classifier’s accuracy and the BLEU score while Figures 5–7 show Spearman’s correlation of the accuracy and TER, for each of our three parallel corpora. Data labels show the corresponding number of each classifier (No.) as shown in Table 4. The figures include the correlation coefficient ρs and its p-value as well as a regression line and its 95% confidence region. The p-value shows the statistical significance of the correlation (ρs ). We consider a value of α = 0.05 to be statistically significant. These figures have been generated with R’s library ggplot. An ideal metric for measuring the performance of the built-in classifier in the SMT system should have a perfect positive Spearman’s correlation with the BLEU score and a perfect negative Spearman’s correlation with the TER score. In this way, increasing classifier quality will increase the SMT performance. As Figures 2– 7 show, the correlation coefficient is statistically significant in all cases (p < 0.05). For the En–Fa and En–Tr corpora, there is a strong positive correlation between the accuracy and the BLEU score. Furthermore, there is a strong negative correlation between the accuracy and the TER. However, the absolute values of the correlation coefficients are not equal to one. This means that there is a mismatch between classification accuracy and the SMT performance, such that higher classification accuracy does not always lead to better MT performance. Accordingly, one cannot rely solely on classification accuracy in order to select the best classifier for the DRM in the SMT system. Strangely enough, for the En–Ar corpus, there is a strong negative correlation between the accuracy and the BLEU score and there is a strong positive correlation between the accuracy and TER. This shows that, for the En–Ar corpus, the classifier with the best accuracy will probably lead to the worst SMT performance. We hypothesize that this is because, as Table 6 shows, the percentage of monotone instances is much larger than swap instances in the En–Ar corpus (71% versus 21% for head-dep and 88% vs 12% for dep-dep), i.e., the En–Ar corpus is imbalanced. In imbalanced data, micro-averaged scores such as accuracy may become biased in favour of the majority class (here, the monotone class). Our experiments confirm this trend. We observed that for the classifiers on the En–Ar corpus, the precision of the classifier on the monotone class is about 93%, while its precision on the swap class is only around 35%. This means that the classifier considers the majority class (here, the monotone class) for most of the pairs and only a limited number of reorderings can be performed by the DRM, which is why the performance of the SMT system decreases when the classifier accuracy increases. Accuracy is a micro-averaged score and hence it is a measure of effectiveness of the classifier on the larger class. In order to measure the effectiveness of the classifier on the smaller class in imbalanced
Entropy 2017, 19, 340
9 of 17
data, macro-averaged results should be computed [39]. We investigate the relationship between macro-averaged F1 and the translation performance for imbalanced En–Ar corpus. 20
● 13
● 15
15
● 11
BLEU rank
● 14
●4
5
●3
●8 ●9
● 17 ● 18
●1
●2
●5
●6
0
● 16
● 12
●7
10
● 10
5
10
15
Accuracy rank
Figure 2. BLEU Rank vs. Accuracy Rank for English–Farsi, ρ = 0.85, p-value < 0.01. 20
●6 ●5
BLEU rank
15
●4
●9
●8 ●3
●7 ●2
10
●1
● 18
● 16
● 17
● 14
5
● 12
● 10
● 11
0 5
● 13
● 15
10
15
Accuracy rank
Figure 3. BLEU Rank vs. Accuracy Rank for English–Arabic, ρ = −0.75, p-value < 0.01. 20
●7
●8
15
●4
BLEU rank
●5 ● 14
10
● 17
5
● 12 0
● 18
● 16 ●2
●6
● 13
●1
● 10
●9 ●3
● 11 ● 15 5
10
15
Accuracy rank
Figure 4. BLEU Rank vs. Accuracy Rank for English–Turkish, ρ = 0.8, p-value < 0.01.
Entropy 2017, 19, 340
10 of 17
20
●3
TER rank
15
●2 ●9
●6
●5
●1
●8
●4 ●7
10
● 18 ● 12
● 17 ● 13
5
● 16
● 11 ● 15 ● 14 ● 10
0 5
10
15
Accuracy rank
Figure 5. TER Rank vs. Accuracy Rank for English–Farsi, ρ = −0.90, p-value < 0.01.
● 15 ● 17
● 14
● 10
15
TER rank
● 18 12
● 11
● 13
● 16
10
●3 ●2
●1 ●5 6
5
●4
●9
●8
●7
0 5
10
15
Accuracy rank
Figure 6. TER Rank vs. Accuracy Rank for English–Arabic, r = 0.75, p-value < 0.01. 20
● 12 ● 18
TER rank
15
● 17 ● 11 ● 15 ● 14 ● 6
10
●7 ●3 9 ●4 ●5
5
●1
●2 ● 10 ● 13 ● 16
●8
0 5
10
15
Accuracy rank
Figure 7. TER Rank vs. Accuracy Rank for English–Turkish, r = −0.85, p-value < 0.01.
We measure macro-averaged F1 as shown in Equation (7), where Fm and Fs are the F1 scores on monotone and swap classes, respectively, which are computed based on Equation (8). While micro-averaged metrics such as accuracy give equal weights to per-instance classification decisions, macro-averaged F-measure as in Equation (7) gives equal weights to each class [39].
Entropy 2017, 19, 340
11 of 17
Hence, macro-averaged metrics are more suitable for imbalanced data: Macro − averaged − F1 = F1 = 2 ×
Fm + Fs , 2
(7)
Precision × Recall . Precision + Recall
(8)
Figures 8 and 9 show the correlation between the macro-averaged F-score and the BLEU and TER scores for the En–Ar corpus. The correlation coefficient is statistically significant in all cases (p < 0.05). As expected, for the imbalanced En–Ar corpus, there is a strong positive correlation between the macro-averaged F-score and BLEU, and there is a strong negative correlation between the macro-averaged F-score and TER.
20
●6 ●5
BLEU rank
●4
●9
15
●8 ●3
●7 ●2
10
● 18
● 16
● 17
● 14
5
● 12
●1
● 13
● 15
● 10
● 11
0
5
10
15
Macro−averaged F1 rank
Figure 8. BLEU Rank vs. Macro-averaged F1 Rank for English–Arabic, r = 0.77, p-value < 0.01. 20
● 15
● 17
● 14
● 10
TER rank
15
● 12
● 18
● 11
● 13
● 16
10
●3 ●2
●1 ●5 6
5
●4
●9
●8
●7
0 5
10
15
Macro−averaged F1 rank
Figure 9. TER Rank vs. Macro-averaged F1 Rank for English–Arabic, r = −0.8, p-value < 0.01.
6.2. The Impact of Classification Improvement on Translation Quality In Section 6.1, we showed that improving the performance of the classifier in the DRM does not automatically improve SMT quality. However, we observed that when the relative improvement in classification performance is high enough, the quality of the SMT system improves too. In order to confirm this observation, we investigate the impact of classification improvement on translation
Entropy 2017, 19, 340
12 of 17
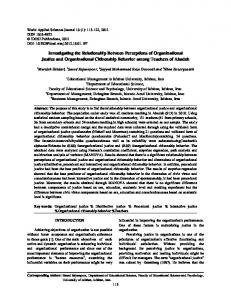
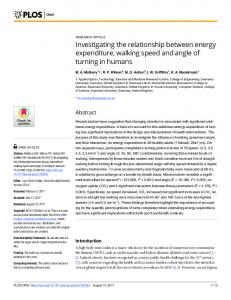
quality. To this end, for each pair of the 18 SMT systems described in Section 5, we calculate the amount of relative improvement in classification performance and SMT quality as shown in Algorithm 1. In Algorithm 1, ClPer f ormance(System A ) shows the performance of the classifier in the DRM of SMT system A in terms of accuracy or macro-averaged F-score. MtQuality(System A ) shows the quality of SMT system A in terms of BLEU. Cl Imp and MtImp show, respectively, the relative improvement in the classification performance and SMT quality for system A compared to system B. For each parallel corpus, we calculate the improvement in the classification performance and SMT quality for each pair of SMT systems based on Algorithm 1. As discussed in Section 6.1, for the imbalanced En–Ar corpus, the macro-averaged F-score shows higher correlation with BLEU in comparison to accuracy. Accordingly, for the En–Ar corpus we calculate ClPer f ormance(System A ) in terms of macro-averaged F-score while for the En–Fa and En–Tr corpora we calculate it in terms of accuracy. For all SMT systems, we calculate MtQuality(System A ) in terms of BLEU. Figures 10–12 show the relationship between the improvement in classification performance (Cl Imp) with the improvement in SMT quality (MtImp) for En–Fa, En–Ar and En–Tr corpora, respectively. We derive the following observations from the results: •
•
•
When the improvement in classification performance exceeds a certain threshold, SMT quality will improve too. For En–Fa, En–Ar and En–Tr corpora, the threshold values are 6.4%, 3% and 6.2%, respectively. This shows that, for each parallel corpus, if the amount of improvement in classification performance exceeds the corresponding threshold value, we can expect the SMT quality to improve as well. The magnitude of the improvement in classification performance is not necessarily proportional to the magnitude of the improvement in SMT quality. That is, a higher improvement in classification performance does not always lead to a higher improvement in SMT quality. An improvement of about 0–20% in classification performance leads to an improvement of about 0–3.5% in the BLEU score. It is worth noting that although the improvement in BLEU score is much smaller than the improvement in classification performance, it is still comparable with the BLEU improvement gained by some recent reordering models (cf. Table 7).
Algorithm 1 Calculating the amount of improvement in classification performance and SMT quality. CalculateImprovements(System0 , System1 , ..., System18 ) index = 0; for (i = 0; i < 18; i + +) do for ( j = i + 1; j < 18; j + +) do if (ClPer f ormance(Systemi ) > ClPer f ormance(System j )) then A ← i; B ← j else A ← j; B ← i end if Cl Imp[index ] ←
ClPer f ormance(System A )−ClPer f ormance(System B ) ClPer f ormance(System A ) MtQuality(System )− MtQuality(System B )
A MtImp[index ] ← MtQuality(System A ) index + +; end for end for return (Cl Imp[0...index], MtImp[0...index]);
∗ 100 ;
∗ 100 ;
Entropy 2017, 19, 340
13 of 17
Figure 10. The mprovement in classification performance vs. the improvement in SMT quality for English-Farsi.
Figure 11. The mprovement in classification performance vs. the improvement in SMT quality for English-Arabic.
Figure 12. The improvement in classification performance vs. the improvement in SMT quality for English-Turkish.
Entropy 2017, 19, 340
14 of 17
Table 7. A number of recent reordering models, their translation task and their relative improvement over the baselineb or state-of-the-art* SMT system. Reordering Model
Translation Task
Zhang et al. [40] Zhang et al. [40] Wenniger and Sima’an [41] Wenniger and Sima’an [41] Li et al. [42] Nguyen and vogel [43] Nguyen and vogel [43] Kazemi et al. [27] Gao et al. [9]
Chinese-to-English Japanese-to-English Chinese-to-English German-to-English Chinese-to-English Arabic-to-English German-to-English English-to-Farsi Chinese-to-English
Relative BLEU Improvement (%) 3.5* 2.8* 3.1b 0.3b 1.9* 2.4b 3.4b 3.6* 3.6b
7. Conclusions In this paper, we conducted an empirical study of the relationship between the quality of the classifier used in the reordering model with the ultimate performance of an SMT system. We measured Spearman’s rank correlation coefficient between the classification evaluation metric (accuracy) and MT automatic evaluation metrics (BLEU and TER). For one of the examined corpora, Spearman’s correlation between accuracy and BLEU is negative. That is, for this corpus, the classifier with the highest accuracy leads to the worst SMT performance. We hypothesized that this is because this corpus is imbalanced, so accuracy is not a suitable metric with which to evaluate the classifier. For this corpus, we obtained a good positive correlation by using the macro-averaged F-score. Hence, we provided evidence that for imbalanced corpora, macro-averaged F-score is a better metric than accuracy for evaluating the classifier in the reordering model of an SMT system. Further investigation on more imbalanced corpora is necessary to confirm this hypothesis. In addition, we showed that the absolute value of Spearman’s correlation coefficient is lower than 1 for all three corpora examined. This means that better classification performance does not always lead to better SMT quality. We therefore investigated the impact of classification improvement in translation quality. We showed that if the improvement in classification performance is high enough, the SMT quality improves too. This shows that, although better classification performance does not always lead to the better SMT quality, when the improvement in classification performance exceeds a certain threshold value, we can expect the SMT quality to improve as well. For the En–Fa, En–Ar and En–Tr corpora that we used in this paper, these threshold values were found to be 6.4%, 3% and 6.2%, respectively. In this paper, we have investigated the relationship between the performance of the classifier in the DRM and SMT quality for HPB-SMT systems. Similar work should be done to investigate this relationship for other types of SMT systems (e.g., phrase-based SMT). Researchers who work on the same HPB-SMT model and use corpora with similar distributions of monotone and swap reordering as those reported here could use the threshold values we obtained in this paper. Acknowledgments: The authors wish to thank the anonymous reviewers for their helpful comments. This research is supported by University of Isfahan and by Science Foundation Ireland through the CNGL Programme (Grant 12/CE/I2267) in the ADAPT Centre (www.adaptcentre.ie) at Dublin City University, the European Union Seventh Framework Programme FP7/2007-2013 under grant agreement PIAP-GA-2012-324414 (Abu-MaTran). The ADAPT Centre for Digital Content Technology at Dublin City University is funded under the Science Foundation Ireland Research Centres Programme (Grant 13/RC/2106) and is co-funded under the European Regional Development Fund. Author Contributions: Arefeh Kazemi, Mohammadali Nematbakhsh and Amirhassan Monadjemi developed the original ideas, which were considerably refined by Antonio Toral and Andy Way following a period spent by Arefeh Kazemi in the latter’s MT lab. Arefeh Kazemi, Antonio Toral and Andy Way designed the experiments jointly. Arefeh Kazemi processed data and performed most of the experiments. Antonio Toral performed the experiments in Section 6.1 (correlations and their graphic representation). Arefeh Kazemi wrote the original draft
Entropy 2017, 19, 340
15 of 17
paper, on which Antonio Toral and Andy Way provided extensive feedback, as well as on the final version of the manuscript. All authors have read and approved the final manuscript. Conflicts of Interest: The authors declare no conflict of interest.
References 1.
2. 3. 4.
5.
6.
7.
8.
9.
10.
11.
12.
13.
14. 15. 16. 17.
Birch, A.; Osborne, M.; Philipp, K. Predicting success in machine translation. In Proceedings of the 8th Conference on Empirical Methods in Natural Language Processing, Honolulu, HI, USA, 25–27 October 2008; pp. 745–754. Zens, R.; Ney, H. Discriminative reordering models for statistical machine translation. In Proceedings of the 2006 Workshop on Statistical Machine Translation, New York, NY, USA, 8–9 June 2006; pp. 55–63. Bisazza, A.; Federico, M. Dynamically shaping the reordering search space of phrase-based statistical machine translation. Trans. Assoc. Comput. Linguist. 2013, 1, 327–340. Chang, P.C.; Tseng, H.; Jurafsky, D.; Manning, C.D. Discriminative Reordering with Chinese Grammatical Relations Features. In Proceedings of the Third Workshop on Syntax and Structure in Statistical Translation, Boulder, CO, USA, 5 June 2009; pp. 51–59. Xiong, D.; Liu, Q.; Lin, S. Maximum Entropy Based Phrase Reordering Model for Statistical Machine Translation. In Proceedings of the 21st International Conference on Computational Linguistics and the 44th Annual Meeting of the Association for Computational Linguistics, Sydney, Australia, 17–21 July 2006; pp. 521–528. He, Z.; Meng, Y.; Yu, H. Extending the hierachical phrase based model with maximum entropy based btg. In Proceedings of the Conference of the Association for Machine Translation in the Americas (AMTA), Denver, CO, USA, 31 October–4 November 2010. Li, J.; Marton, Y.; Resnik, P.; Daumé, H., III. A Unified Model for Soft Linguistic Reordering Constraints in Statistical Machine Translation. In Proceedings of the 52nd Annual Meeting of the Association for Computational Linguistics, Baltimore, MD, USA , 22–27 June 2014; Association for Computational Linguistics: Baltimore, MD, USA, 2014; Volume 1; pp. 1123–1133. Green, S.; Galley, M.; Manning, C.D. Improved models of distortion cost for statistical machine translation. In Proceedings of the 2010 Annual Conference of the North American Chapter of the Association for Computational Linguistics (NAACL), Los Angeles, CA, USA, 2–4 June 2010; pp. 867–875. Gao, Y.; Koehn, P.; Birch, A. Soft Dependency Constraints for Reordering in Hierarchical Phrase-based Translation. In Proceedings of the Conference on Empirical Methods in Natural Language Processing, Edinburgh, UK, 27–31 July 2011; pp. 857–868. Kazemi, A.; Toral, A.; Way, A.; Monadjemi, A.; Nematbakhsh, M. Dependency-based Reordering Model for Constituent Pairs in Hierarchical SMT. In Proceedings of the 18th Annual Conference of the European Association for Machine Translation, Antalya, Turkey, 11–13 May 2015; pp. 43–50. Kazemi, A.; Toral, A.; Way, A. Using Wordnet to Improve Reordering in Hierarchical Phrase-Based Statistical Machine Translation. In Proceedings of the Eighth Meeting of the Global WordNet Conference, Bucharest, Romania, 8–12 January 2016. Xiong, D.; Zhang, M.; Li, H. Modeling the Translation of Predicate-argument Structure for SMT. In Proceedings of the 50th Annual Meeting of the Association for Computational Linguistics, Jeju Island, Korea, 8–14 July 2012; Volume 1, pp. 902–911. Wang, X.; Xiong, D.; Zhang, M.; Hong, Y.; Yao, J. A Topic-Based Reordering Model for Statistical Machine Translation. In Proceedings of the Third CCF Conference—NLPCC 2014, Shenzhen, China, 5–9 December 2014; pp. 414–421. Alrajeh, A.; Niranjan, M. Scalable Reordering Models for SMT based on Multiclass SVM. Prague Bull. Math. Linguist. 2015, 103, 65–84. Kumar, E. Natural Language Processing; I.K. International Pvt. Ltd.: New Delhi, India, 2011. Fraser, A.; Marcu, D. Measuring Word Alignment Quality for Statistical Machine Translation; Technical Report; ISI University of Southern California: Los Angeles, CA, USA, 2006. Fraser, A.; Marcu, D. Measuring Word Alignment Quality for Statistical Machine Translation. Comput. Linguist. 2007, 16, 293–303.
Entropy 2017, 19, 340
18.
19.
20. 21.
22. 23. 24.
25. 26. 27. 28.
29.
30. 31. 32. 33. 34.
35.
36.
37.
38.
16 of 17
Papineni, K.; Roukos, S.; Ward, T.; Zhu, W.J. BLEU: A Method for Automatic Evaluation of Machine Translation. In Proceedings of the 40th Annual Meeting on Association for Computational Linguistics, Philadelphia, PA, USA, 6–13 July 2002; pp. 311–318. Ayan, N.F.; Dorr, B.J. Going Beyond AER: An Extensive Analysis of Word Alignments and Their Impact on MT. In Proceedings of the 21st International Conference on Computational Linguistics and 44th Annual Meeting of the ACL, Sydney, Australia, 17–21 July 2006; pp. 9–16. Davis, P.C.; Xie, Z.; Small, K. All Links are not the Same: Evaluating Word Alignments for Statistical Machine Translation. In Proceedings of the MT Summit XI, Copenhagen , Denmark, 10–14 September 2007; pp. 119–126. Vilar, D.; Popovic, M.; Ney, H. AER: Do we need to “ improve” our alignments? In Proceedings of the International Workshop on Spoken Language Translation (IWSLT), Kyoto, Japan 27–28 November 2006; pp. 205–212. Guzman, F.; Gao, Q.; Vogel, S. Reassessment of the Role of Phrase Extraction in PBSMT. In Proceedinds of the Machine Translation Summit XII, Ottawa, ON, Canada, 26–30 August 2009. Tian, L.; Wong, D.F.; Chao, L.S.; Oliveira, F. A Relationship: Word Alignment, Phrase Table, and Translation Quality. Sci. World J. 2014, 2014, doi:10.1155/2014/438106. Chiang, D. A Hierarchical Phrase-based Model for Statistical Machine Translation. In Proceedings of the 43rd Annual Meeting on Association for Computational Linguistics, Ann Arbor, MI, USA, 25–30 June 2005; pp. 263–270. Koehn, P. Statistical Machine Translation; Cambridge University Press: Cambridge, UK, 2012. Fellbaum, C. WordNet: An Electronic Lexical Database; MIT Press: Cambridge, MA, USA, 1998. Kazemi, A.; Toral, A.; Way, A.; Monadjemi, A.; Nematbakhsh, M. Syntax- and semantic-based reordering in hierarchical phrase-based statistical machine translation. Expert Syst. Appl. 2017, 84, 186–199. Quirk, C.; Menezes, A.; Cherry, C. Dependency treelet translation: Syntactically informed phrasal SMT. In Proceedings of the 43rd Annual Meeting on Association for Computational Linguistics, Ann Arbor, MI, USA, 25–30 June 2005; pp. 271–279. Passban, P.; Way, A.; Liu, Q. Benchmarking SMT Performance for Farsi Using the TEP++ Corpus. In Proceedings of the 18th Annual Conference of the European Association for Machine Translation, Antalya, Turkey, 11–13 May 2015. Oflazer, K. Statistical Machine Translation into a Morphologically Complex Language. In Proceedings of the Conference on Intelligent Text Processing and Computational Linguistics, Haifa, Israel, 17–23 February 2008. News Commentary English–Arabic parallel corpus. Available online: http://www.casmacat.eu/corpus/ news-commentary.html (accessed on 29 June 2017). Chen, D.; Manning, C.D. A Fast and Accurate Dependency Parser using Neural Networks. In Proceedings of the Empirical Methods in Natural Language Processing (EMNLP), Doha, Qatar, 25–29 October 2014. Och, F.J.; Ney, H. A Systematic Comparison of Various Statistical Alignment Models. Comput. Linguist. 2003, 29, 19–51. Manning, C.; Klein, D. Optimization, Maxent Models, and Conditional Estimation without Magic. In Proceedings of the 2003 Conference of the North American Chapter of the Association for Computational Linguistics on Human Language Technology, Edmonton, AB, Canada, 27 May–1 June 2003; p. 8. Hoang, H.; Koehn, P.; Lopez, A. A unified framework for phrase-based, hierarchical, and syntax-based statistical machine translation. In Proceedings of the International Workshop on Spoken Language Translation, IWSLT, Tokyo, Japan, 1–2 December 2009; pp. 152–159. Cherry, C.; Foster, G. Batch Tuning Strategies for Statistical Machine Translation. In Proceedings of the 2012 Conference of the North American Chapter of the Association for Computational Linguistics, Los Angeles, CA, USA, 2–4 June 2012; pp. 427–436. Snover, M.; Dorr, B.; Schwartz, R.; Micciulla, L.; Weischedel, R. A Study of Translation Error Rate with Targeted Human Annotation. In Proceedings of the Association for Machine Translation in the Americas, Cambridge, MA, USA, 8–12 August 2006. Clark, J.H.; Dyer, C.; Lavie, A.; Smith, N.A. Better Hypothesis Testing for Statistical Machine Translation: Controlling for Optimizer Instability. In Proceedings of the 49th Annual Meeting of the Association for Computational Linguistics: Human Language Technologies, Portland, OR, USA 19–24 June 2011; Association for Computational Linguistics: Stroudsburg, PA, USA, 2011; Volume 2, pp. 176–181.
Entropy 2017, 19, 340
39. 40. 41.
42.
43.
17 of 17
Manning, C.D.; Raghavan, P.; Schütze, H. Introduction to Information Retrieval; Cambridge University Press: Cambridge, UK, 2008. Zhang, J.; Utiyama1, M.; Sumita, E.; Zhao, H.; Neub, G. Learning local word reorderings for hierarchical phrase-based statistical machine translation. Mach. Transl. J. 2016, 30, 1–18. Wenniger, G.M.D.B.; Sima’an, K. Bilingual markov reordering labels for hierarchical smt. In Proceedings of the Eighth Workshop on Syntax, Semantics and Structure in Statistical Translation (SSST-8), Doha, Qatar, 25 October 2014; pp. 11–21. Li, P.; Liu, Y.; Sun, M.; Izuha, T.; Zhang, D. A Neural Reordering Model for Phrase-based Translation. In Proceedings of the COLING 2014, the 25th International Conference on Computational Linguistics, Dublin, Ireland, 23–29 August 2014; pp. 1897–1907. Nguyen, T.; Vogel, S. Integrating phrase-based reordering features into a chart-based decoder for machine translation. In Proceedings of the 51st Annual Meeting of the Association for Computational Linguistics, Sofia, Bulgaria, 4–9 August 2013; pp. 1587–1596. c 2017 by the authors. Licensee MDPI, Basel, Switzerland. This article is an open access
article distributed under the terms and conditions of the Creative Commons Attribution (CC BY) license (http://creativecommons.org/licenses/by/4.0/).