that the sensing technology and interaction type (swipe or touch) were moderately ..... Security (CERIAS), and a bachelor's degree in Computer. Science from ...
Investigating The Relationship Between Fingerprint Image Quality and Skin Characteristics Christine R. Blomeke Graduate Research Assistant Biometrics Standards, Performance & Assurance Laboratory Purdue University 401 N. Grant Street West Lafayette, IN 47906 USA
Shimon K. Modi, Ph.D. Director of Research Biometrics Standards, Performance & Assurance Laboratory Purdue University 401 N. Grant Street West Lafayette, IN 47909 USA
Stephen J. Elliott, Ph.D. IEEE Member Associate Professor, Director of Biometrics Standards, Performance & Assurance Laboratory Purdue University 401 N. Grant Street West Lafayette, IN 47906
USA
Abstract – This paper reports the correlations between skin characteristics, such as moisture, oiliness, elasticity, and temperature of the skin, and fingerprint image quality across three sensing technologies. Fingerprint images from the index finger of the dominant hand of 190 individuals, were collected on nine different fingerprint sensors. The sensors included four capacitance sensors, four optical sensors and one thermal fingerprint sensor. Skin characteristics included temperature, moisture, oiliness and elasticity, were measured prior to the initial interaction with each of the individual sensors. The analysis of the full dataset indicated that the sensing technology and interaction type (swipe or touch) were moderately and weakly correlated respectively with image quality scores. Correlation analysis between image quality scores and the skin characteristics were also made on subsets of data, divided by the sensing technology. The results did not identify any significant correlations. This indicates that further work is necessary to determine the type of relationship between the variables, and how they impact image quality and matching performance. Index terms – biometrics, fingerprint image quality, skin characteristics, and ANOVA I.
INTRODUCTION
Biometric technology is defined as the automatic recognition of an individual based on their behavioral and physiological traits [1]. According to the Biometric Industry Report for 2007-2012, [2], fingerprint recognition and AFIS/Live-Scan accounted for a combined 58.9 percent of the biometric market in 2007, and is being deployed into retail, healthcare, and law enforcement environments. Fingerprint image quality has been shown to have an impact on matching performance evaluation, and dry fingers have often been cited as a skin characteristic resulting in low fingerprint image quality. In addition image quality has been shown to vary across sensing technologies. A.
Motivations
This work has been motivated by the area of research
called the Human-Biometric Sensor Interaction (HBSI). The work seeks to understand how a user interacts with a device and how this interaction affects the performance of a biometric system. At the most basic level, the condition of the skin is a factor that affects the collectability of biometric traits regardless of the type of interaction, swipe or touch placement of the fingers, with the fingerprint sensor and therefore is important to have a clear understanding of the parameters that limit the ability of some users to successfully use a device. Limited work has been done to investigate individual skin characteristics’ impact on the collectability and fingerprint image quality. B.
Previous Literature
Image quality is an important aspect of fingerprint recognition to examine while evaluating the performance of the system. As fingerprint recognition continues to increase deployments into a wider range of applications, such as protecting laptops, and cell phones, industry access control, replacement of passwords for websites and it is important to understand the challenges individuals have in enrolling and verifying in a particular system. On a basic level, it is important to understand the components of dry skin that influence the quality of captured images and subsequent matching performance of the biometric system. In [3], the fingerprints of individuals aged 62 and over were compared to a population of individuals aged 18 – 25. The results showed a difference in image quality between the two groups and that removing the lowest ten percent quality images from the 62+ population had the greatest impact on the matching performance. It is common that as a person ages, that the skin becomes dry, due to moisture loss, the reduction of oil production, and loses elasticity, which may contribute to a lower image quality score. Poor quality prints are typically associated with skin that is dry and has cracks and scars, and may be associated with environmental conditions, such as low humidity, occupational conditions, and washing hands with harsh soaps which strip the natural oils from the skin’s surface. Kukula et. al [5] described the relationship between varying levels of applied force during image collection and
the resulting image quality scores; which differed based on the sensing technology. Low levels of force prevent consistent contact with the sensor, and likewise the condition of the fingertips can influence the contact and deformability of the ridges with the sensor. These characteristics do not have a clearly defined relationship, and so this study investigates the relationship between moisture content, oiliness, elasticity, temperature and image quality. II.
types. In Figure 1 the range of image quality scores by sensor type (1- capacitance, 2 - optical and 3 – thermal) is shown, and indicates that optical and capacitance sensors has higher image quality scores than the thermal sensor.
METHODOLOGY
The dataset was formed by collecting fingerprint images from 190 individuals over the age of 18. Six images were collected from each individual’s index finger of their dominant hand. The image dataset used in this analysis (N=1693) includes a random sampling from each person over each of the nine fingerprint sensors. The order of sensors was randomized for each individual to eliminate potential order effects. The participants’ skin characteristics, moisture content, oiliness, and elasticity were collected using the Triplesense® device from Moritex USA. The device consists of three sensors, that can simultaneously collect and display the moisture, oiliness, and elasticity levels of the skin on a scale of 0-99. Measurements were taken from the index finger of the dominant hand, and were recorded prior the first interaction with each of the nine commercially available fingerprint sensors. Four capacitance sensors, four optical sensors, and one thermal sensor comprised the set of fingerprint devices. Image quality scores were determined by using Aware Quality, a commercially available image quality score package. The statistical analysis included Analysis of Variance (ANOVA) and correlation analysis with Pearson’s r value were performed using Minitab® 15 (2007). The Pearson’s r value were categorized according to J.P. Guildford’s suggested interpretations as shown in Sprinthall [6] and reproduced below. Due to the large sample size, the distribution of scores was approximately normal, and ANOVA techniques were deemed appropriate.
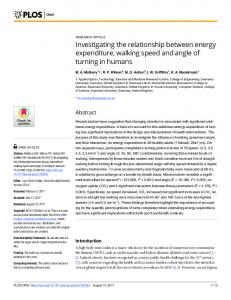
The dataset is further described by the presentation of the scatterplots in Figure 2. The skin characteristics of moisture, oiliness, elasticity and temperature are plotted against the image quality scores by each sensor type. The plots indicate a normal distribution of quality scores over the range of levels of the skin characteristics. There is one outlier visualized in the plot of temperature against quality. The outlier is most likely due to a typographical error, but was not removed from the dataset. The scatterplots indicate that the ranges of moisture, oiliness, and elasticity, and temperature were consistent throughout the experiment.
Table 1 Guildford’s suggested interpretations for values of r. r- Value Less than 0.20 0.2 – 0.4 0.4 – 0.7 0.70 – 0.90 0.9 – 1.00
Interpretation Slight; almost negligible relationship Low correlation; definite but small relationship Moderate correlation; substantial relationship High correlation; marked relationship Very high correlation; very dependable relationship III.
RESULTS
This section will detail the results of comparing the image quality scores across sensing technologies and correlation analysis between skin characteristics and image quality scores and amongst each other across all sensor
Figure 2: Scatter plots of skin characteristics by quality for each type of sensing technology The scatterplot shown in Figure 3, graphically shows that there is no defined relationship between elasticity and moisture, elasticity and oiliness, or oiliness and moisture by the sensing technology. This is an expected result as the individuals provided their skin characteristics prior to interacting with each sensor. The order of interaction with the sensors was randomized, alleviating any order effects.
Table 4, seen below, contains a summary of the weak correlations between variables, and shown based on the sensing technology. The weak correlation values indicate that the relationship between the two variables is non-linear, and other methods should be used to determine the relationship. The full dataset as well as the partitioned datasets indicated a weak to almost negligible relationship between moisture and oiliness. Slight correlations between moisture and elasticity occur for both the capacitance and optical sensors. Table 4 Correlation summary by sensor type (Pearson’s r/p-value) Figure 3: Scatter plots of Elasticity by Moisture, Elasticity by Oiliness, and Oiliness by Moisture for each type of sensing technology The dataset was investigated further by conducting correlation analysis to identify any linear relationships among the variables that could not be visually detected. Table 2 contains the correlation matrix for the full dataset. The variables sensor type and interaction type were found to have a moderate and low positive correlations respectively, and were significant at an alpha = 0.05 level. The remaining variables had a negligible relationship amongst each other.
Quality Capacitance Oiliness Elasticity Interaction
Moisture Temp
0.006 -0008.
Oil
0.024
Elastic
-0.020
Type Interact
-0.560