J. Dairy Sci. 96:1928–1952 http://dx.doi.org/10.3168/jds.2012-6107 © American Dairy Science Association®, 2013.
Invited review: Sensors to support health management on dairy farms C. J. Rutten,*1 A. G. J. Velthuis,† W. Steeneveld,† and H. Hogeveen*†
*Department of Farm Animal Health, Faculty of Veterinary Medicine, Utrecht University, 3584 CL, Utrecht, the Netherlands †Business Economics Group, Wageningen University, 6706 KN, Wageningen, the Netherlands
ABSTRACT
Since the 1980s, efforts have been made to develop sensors that measure a parameter from an individual cow. The development started with individual cow recognition and was followed by sensors that measure the electrical conductivity of milk and pedometers that measure activity. The aim of this review is to provide a structured overview of the published sensor systems for dairy health management. The development of sensor systems can be described by the following 4 levels: (I) techniques that measure something about the cow (e.g., activity); (II) interpretations that summarize changes in the sensor data (e.g., increase in activity) to produce information about the cow’s status (e.g., estrus); (III) integration of information where sensor information is supplemented with other information (e.g., economic information) to produce advice (e.g., whether to inseminate a cow or not); and (IV) the farmer makes a decision or the sensor system makes the decision autonomously (e.g., the inseminator is called). This review has structured a total of 126 publications describing 139 sensor systems and compared them based on the 4 levels. The publications were published in the Thomson Reuters (formerly ISI) Web of Science database from January 2002 until June 2012 or in the proceedings of 3 conferences on precision (dairy) farming in 2009, 2010, and 2011. Most studies concerned the detection of mastitis (25%), fertility (33%), and locomotion problems (30%), with fewer studies (16%) related to the detection of metabolic problems. Many studies presented sensor systems at levels I and II, but none did so at levels III and IV. Most of the work for mastitis (92%) and fertility (75%) is done at level II. For locomotion (53%) and metabolism (69%), more than half of the work is done at level I. The performance of sensor systems varies based on the choice of gold standards, algorithms, and test sizes (number of farms and cows). Studies on sensor systems for mastitis and estrus have shown that sensor systems are brought to a higher level; however, the need to improve detecReceived August 31, 2012. Accepted December 20, 2012. 1 Corresponding author:
[email protected]
tion performance still exists. Studies on sensor systems for locomotion problems have shown that the search continues for the most appropriate indicators, sensor techniques, and gold standards. Studies on metabolic problems show that it is still unclear which indicator reflects best the metabolic problems that should be detected. No systems with integrated decision support models have been found. Key words: automated detection, sensor, dairy, health management INTRODUCTION
A trend exists in dairy farming toward the automation of processes to reduce (physical) labor and labor costs (Svennersten-Sjaunja and Pettersson, 2008; de Koning, 2010). This development is partly driven by the economic reality of increasing labor costs relative to capital costs. Automated systems enable dairy farmers to manage larger herds with lower labor requirements (de Koning, 2010), which means that the application of automated systems fits with the trend of increasing herd sizes. Another important trend in western Europe is the use of automated milking systems (AMS). The first studies on the feasibility of an AMS were done in the mid-1980s, such as the initial preliminary study by Rossing et al. (1985). The first commercial farms introduced an AMS in the Netherlands in 1992, and by 2009 the number of farms using an AMS had increased to more than 8,000 worldwide (90% of which were located in western Europe; de Koning, 2010). When using an AMS, no milker is present who could visually judge the cows’ foremilk for the presence of clots to detect mastitis. Therefore, farmers must rely on alternative methods to detect mastitis. Since the 1980s, work has been done on devices that measure a health indicator in, up, on, or from an individual cow (Hogeveen et al., 2010). Examples of sensors include milk electrical conductivity, milk color sensors (Espada and Vijverberg, 2002), acceleration sensors (attached to the cows leg; Pastell et al., 2009; Chapinal et al., 2011; Saint-Dizier and Chastant-Maillard, 2011), and pH sensors (AlZahal et al., 2007b). A sensor system consists of the device itself plus the software that processes the data to produce information or advice.
1928
INVITED REVIEW: SENSORS FOR DAIRY HEALTH MANAGEMENT
In this review, 4 levels are defined that describe the degree to which a sensor system informs the farmer. The sensor itself is only the first step in a sensor system. The second step is to use the sensor data in an algorithm that provides information about the health of the individual cows. In this step, it is possible to combine sensor data with nonsensor data about cow history (Steeneveld et al., 2010). The algorithm produces information about the cow’s health by determining changes in the sensor data. Examples include electrical conductivity and color to measure changes in the milk to help the farmer detect clinical mastitis (Hovinen and Pyörälä, 2011), acceleration to measure differences in walking behavior to detect lameness (Pastell et al., 2009; Chapinal et al., 2011) or to measure differences in activity to detect estrus (Saint-Dizier and Chastant-Maillard, 2011), and rumen pH to measure acidity of rumen fluid to detect metabolic problems (AlZahal et al., 2007b). The third step uses this information in a decision support model that uses economic information and possibly other information from the farmer or an advisor. The decision support model produces advice about how to act upon the detected events that have happened with the cow. One example is the breeding management tool of Giordano et al. (2011), which advises farmers about what breeding management strategy will maximize the net present value per cow. The fourth and final step is the decision regarding the change in the health status of the cow, as detected by the sensor (e.g., mastitis detected by increased milk electrical conductivity or estrus detected by increased cow activity). In most cases, the farmer makes the decision; in some specific and advanced sensor systems, the system makes an autonomous decision. For example, the system of Andre et al. (2011) automatically adjusts the amount of concentrates fed to the cow based on her milk production and milking interval. In general, sensor systems could support farmer decisions regarding treatment, insemination, and culling. Although some reviews on sensor systems have been published, their scope has been limited to a specific application or type of sensor (Firk et al., 2002; Norberg, 2005; Hogeveen et al., 2010; Gordon, 2011; Saint-Dizier and Chastant-Maillard, 2011). As more sensors become available and are tested more extensively, a need has risen for a clear overview of what sensors have been tested, how advanced the systems are, and the quality of the produced data, information, and devices. Such a structured overview is currently lacking within the scientific literature. As the idea of sensor research is to provide farmers with tools to improve their cow health management, the central question in research regarding sensors should concern what value (meaning the economic value, but also the usefulness for risk manage-
1929
ment and making labor easier) the sensor system adds to the farmer’s decision making. The objective of this review is to provide a structured literature review of the sensors, sensor data, data algorithms that provide information, and the corresponding decision support systems to be used in precision dairy farming. This paper describes 4 key points: (I) what sensor systems are developed for the detection of locomotion problems, mastitis, estrus, and metabolic problems; (II) the performance of these sensor systems; (III) the tools for decision support coupled to these sensors; and (IV) the economic effect of using these sensor systems for farm management. FRAMEWORK
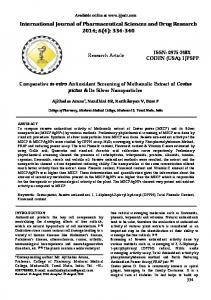
This study considers a sensor to be a device that measures a physiological or behavioral parameter (related to the health or estrus) of an individual cow and enables automated, on-farm detection of changes in this condition that is related to a health event (such as disease) and requires action on the part of the farmer (such as treatment). Sensors fall in to 2 categories: attached and nonattached. Attached sensors may be on-cow sensors that are fitted on the outside of the cow’s body, or in-cow sensors that are inside the body (e.g., rumen bolus or implant). Nonattached sensors are off-cow sensors that cows pass by, over, or through for measurement. Two specific forms of nonattached sensors are in-line and on-line sensors. In-line sensors take measurements in a continuous flow of a product from the cow. The only available option for in-line measurement is in the milk line. On-line sensors automatically take a sample (milk, for example) that is analyzed by the sensor. This review has used the scheme shown in Figure 1 to categorize sensor systems. The scheme shows a framework that describes the steps from a sensor to a decision. Sensors are categorized in the levels of this scheme according to their description in the literature. Sensors are only described if they reach at least level I, known as technique, which means that they measure an aspect of the cows’ condition or status. The 2 categories identified within this level are solely measuring a parameter and an assumed relation. In some sensors, the produced data are processed by a data algorithm (e.g., a pedometer records clicks of a mercury switch, the data algorithm produces a step count per time unit from these clicks). The next step (level II) is called data interpretation and measures changes in the sensor data to produce information about the cows’ status (e.g., estrus). The 2 categories identified within this level are a statistically tested relation and a validated algorithm. From a statistically tested relation, it is posJournal of Dairy Science Vol. 96 No. 4, 2013
1930
RUTTEN ET AL.
Figure 1. Framework of the use of sensor information in dairy farm management.
sible to build a predictive model (detection algorithm) that classifies the cows’ status (e.g., in estrus or not in estrus). For validation, a data set (not the one used to build the detection algorithm) is used to assess the performance by comparing the classification of the algorithm with the gold standard. A further feature is to update or reset the detection algorithm with gold standard measurements during operation in practice; this would mean the algorithm adapts to an individual farm or changing circumstances. Level III integrates the sensor information with other information (such as economic information), to produce advice for the farmer. Furthermore, information of individual cows can be aggregated by a monitoring algorithm at the herd level. The output of this algorithm can be seen as either general information on the herd health for the farmer or additional data input for the detection algorithm. The decision is eventually made either by Journal of Dairy Science Vol. 96 No. 4, 2013
the farmer or autonomously by the sensor system (level IV, known as decision making). Each sensor system is described using 13 categories referring to the used technique, collected data, used algorithms, and performance. The first 3 categories provide a brief summary of the technical aspects of the device: type of sensor (1), sensor location (with respect to the cow; 2), and type of measurements (3). Alerts given by the sensor are compared with a gold standard (4), which describes the occurrence of an event in reality (Hogeveen et al., 2010). The relation between the gold standard, sensor data, and possible data additional to the sensors’ data that does not originate from the sensor under study (non-sensor data; 5) is described by an algorithm (6). A level III sensor system will have a decision support model (7). In the economic information (8) category, the costs and benefits associated with possible decisions are described, whereas other
INVITED REVIEW: SENSORS FOR DAIRY HEALTH MANAGEMENT
information (9) describes additional information, such as treatment success rate. For the sensor algorithm, the percentage of detected true events (sensitivity; 10) and the percentage of truly healthy animals classified as healthy (specificity; 11) are presented, along with the test size (12) upon which these are based. Note that only sensitivity and specificity are summarized here, other indicators of detection performance that were sometimes described in literature, such as the false alert rate, are not included here. The final category—system output (13)—is what the sensor system presents to the farmer. Having gained a clear overview of the available sensor systems, the data and information produced by these sensor systems was compared. The quality of the data and information (i.e., whether the data or information was fit for use by farmers) was assessed. The criteria for this assessment were whether the sensor system detects a clearly defined change in the cows’ health (such as disease or estrus) and presents this change clearly to the farmer (e.g., in the form of an alert rather than as a graph of sensor data). Also, detection sensitivity and specificity were discussed in respect to the used gold standard and the test scale. Furthermore, the added value of the sensor system for the farmer’s decision making was discussed. This comparison led to a discussion of what further research would be needed to improve performance of available sensor systems, develop new sensors and make sensor systems that can be used in practice on farms and are of more practical value on-farm. LITERATURE SELECTION
The relevant literature was searched based on keywords including sensors, dairy farming, and automated detection, in combination with words such as mastitis, locomotion, lameness, metabolic, estrus, and fertility. Literature was also identified by a forward search using the citations and a backward search using the references of the papers found through the keyword search. Journals from the ISI database [Thomson Reuters (Formerly ISI) Web of Science database, New York, NY] were used for the period from January 2002 until June 2012, and the proceedings of relevant scientific conferences held between 2007 and 2012 were searched. The conferences included the First North American Conference on Precision Dairy Farming (Toronto, 2010) and the European Conference on Precision Livestock Farming (Wageningen, 2009, and Prague, 2011). SENSORS
All publications describing sensor systems are summarized in Tables A1, A2, A3, and A4 in the Appendix
1931
of this review. These tables present general information about the sensor systems; more detailed information about the sensor systems can be found in the online data supplements (http://www.journalofdairyscience. org/) of the review. Mastitis
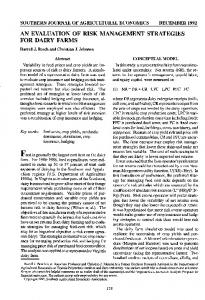
Level I: Sensor Technique. For automated detection of mastitis, 31 publications were found with 37 described sensor systems (some publications described multiple sensors, algorithms, or diseases). Four (11%) of these publications were proceedings papers. Electrical conductivity (EC) was the main sensor system studied (in 15 studies, 48%), followed by a combination of EC sensors and milk color sensors (7 studies, 23%). Some other studies used a biosensor to detect certain enzymes, including haptoglobin, l-lactate dehydrogenase, or N-acetyl-β-d-glucosaminidase (NAGase; 5 studies, 16%), an SCC sensor (2 studies, 6%), or a reticular bolus that measured temperature (1 study, 3%). The EC and milk color sensors were in-line sensors, meaning that they measure in a continuous milk flow. The biosensors and SCC sensors took measurements from automatically collected milk samples, meaning that they were on-line sensors. The bolus was inserted in the cow’s reticulum, which made it an in-cow sensor. Level II: Data Interpretation. Figure 2 shows that 34 (92%) published sensor systems for automated detection of mastitis included data interpretation, which means that the (statistical) relation between gold standard (e.g., the California Mastitis Test; CMT) and sensor measurements (e.g., milk EC) as studied. For 27 (73%) studies the algorithm was validated (i.e., they used a data set to calculate predicted mastitis classification per cow and compare these with the gold standard); for 15 (41%) sensor systems, the sensitivity and specificity of the detection algorithm were determined and reported, which is discussed further below. Level III: Integration of Information. Figure 2 shows that none of the sensor systems integrated the sensor information with other information. Level IV: Decision Making. Sixteen (43%) sensor systems provided the farmer with a mastitis alert, whereas 12 (32%) also provided a probability added to this mastitis alert to describe the certainty, and 2 (5%) provided a degree or classification of mastitis. Eight (22%) sensor systems provided the farmer with raw sensor data (such as milk NAGase concentration) or were unclear in describing what they provided to the farmer. System Quality. Detection performance, which is described by sensitivity and specificity, varied considerably. The reported sensitivities ranged from 55 to Journal of Dairy Science Vol. 96 No. 4, 2013
1932
RUTTEN ET AL.
Figure 2. Number of studied sensor systems for mastitis, fertility, locomotion, and metabolism per development level: Level I = technique, Level II = data interpretation, Level III = integration of information, and Level IV = decision making. Levels I and II are subdivided into solely measuring a parameter (Level I, X), an assumed relation between gold standard and sensor data (Level I, A), a statistically tested relation between gold standard and sensor data (Level II, T), or a validated algorithm for detection (Level II, V).
89%, whereas reported specificities ranged from 56 to 99%. For the sensor systems studied, a trade-off exists between sensitivity and specificity as high sensitivity (>80%) is combined with low specificity and vice versa. None of the studies reported a combination of high sensitivity and high specificity. Moreover, none of the studies met the ISO/FDIS 20966 limit of 80% sensitivity with 99% specificity (ISO, 2007). Although one sensor system reported a sensitivity of 100% and a specificity of 99% for a combination of SCC and EC measurements, these values were based on 9 positive gold standard cases. Some variation in test scale was reported: 10 publications reported that their sensor system was tested on more than one farm, where the others tested their sensor system on only one farm. Electrical conductivity was the most studied sensor technique for mastitis detection and, in some cases, was combined with milk color sensors. Algorithms have been built for most of these sensors, many of which have been validated. Although the biosensors and SCC sensor have been tested, it is unclear whether these sensors show better performance than EC sensors. Infrared cameras have been tested, but only assumed relations with mastitis are available. Therefore, it is unclear how these could perform as a mastitis sensor. Even if systems do not meet the ISO limit, the value that an automated mastitis detection system provides to a farmer is obvious, as the alternative is having no Journal of Dairy Science Vol. 96 No. 4, 2013
automated detection at all. Especially for those farmers using an AMS or managing a large herd, the need for a sensor system is present. However, the perfect mastitis alert does not seem to have been found. Because of the large variation in reported performance, gold standards, test scales, and algorithms used, it is difficult to compare the performance of various sensor types. For example, sensitivities in the range of 83 to 92% with specificities between 75 and 94% were reported for a fuzzy logic algorithm with SCC as a gold standard (Cavero et al., 2006). Other studies using a fuzzy logic algorithm (Kamphuis et al., 2008b; Liberati and Zappavigna, 2009) do not report a comparable performance. When visual judgment of milk is used as a gold standard, naive Bayesian networks (70% sensitivity and 97.8% specificity; Steeneveld et al., 2010) and artificial neural networks (91% sensitivity and 87% specificity; Sun et al., 2010) show the best detection performance. The detection performances under 2 different gold standards for different algorithms are hardly comparable. Of the gold standards used, visual judgment of milk and CMT had the advantage that they could be performed easily and on-farm, whereas SCC requires laboratory analysis. It is difficult to say which of these gold standards is the most appropriate; SCC might be more accurate, whereas visual judgment and CMT might be used more frequently. For EC in combination with milk color sensors, good performance
INVITED REVIEW: SENSORS FOR DAIRY HEALTH MANAGEMENT
has been reported (84.6% sensitivity and 99.4% specificity; Song and van der Tol, 2010) with treated clinical mastitis cases as a gold standard. Because it is not known how many of the occurred cases of clinical mastitis have been treated, this gold standard’s reliability is questionable at best. As a result, we can only be sure that treated cases were clinical mastitis cases; how many untreated cases of clinical mastitis are detected or remain undetected by the sensor system is unknown. Therefore, the reported performance of such a sensor system should be treated with caution. The Herd Navigator (DeLaval, Tumba, Sweden), which automatically collects and analyzes milk samples, seems to perform well (80–82% sensitivity and 98% specificity; Mazeris, 2010; Vreeburg, 2010), although this is only based on 2 non-peer-reviewed studies, published in conference proceedings, for which the used gold standard is unclear. When EC alone is compared with EC plus milk color sensors, sensitivity and specificity seem to be lower for the combination of the 2 sensor types. Accordingly, EC sensors are tested on a smaller scale (number of cows or number of farms) than the combination of EC and milk color sensors. An explanation for this observation could be that variation between farms (and between cows) influences the detection performance of the sensor systems. However, it is not clear whether this difference should be attributed to the sensor system or to the difference in test scale. Fertility
Level I: Sensor Technique. For automated detection of estrus, 41 publications were found with 48 described sensor systems; 6 (15%) of these publications were proceedings papers. Most of these studied the activity of the cow (25 studies, 61%), but some publications studied the progesterone level in milk (6 studies, 15%), (mounting) behavior (6 studies, 15%), vocalization (1 study, 2%), and body temperature (2 studies, 5%). The sensors used to measure activity were pedometers, activity meters (sometimes called activometers), and 3-dimensional (3D)-accelerometers. These sensors were all attached to the cow (pedometers and 3D-accelerometers usually to the cow’s left hind leg and activity meters to a neck collar), and are therefore classified as on-cow sensors. The sensors used to measure progesterone were biosensors and immunostrips. As progesterone was determined in automatically collected milk samples, these sensors are classified as on-line sensors. The sensors for mounting behavior were the HeatWatch (DDX Inc., Denver, CO) sensor and a video camera. The HeatWatch sensor is a device that measures the pressure caused when another cow mounts the cow with the HeatWatch sensor. This sen-
1933
sor was attached to the cow’s back, for which classified it as an on-cow sensor. The video camera is classified as an off-cow sensor. The sensor for vocalization was a microphone attached to the cow’s neck (i.e., an on-cow sensor). The sensors used for body temperature were a temperature transducer implanted in the cow’s body and a bolus inserted in the cow’s reticulum (i.e., an in-cow sensor). Level II: Data Interpretation. Figure 2 shows that 36 (75%) sensor systems included data interpretation, which means that algorithms were built in these publications; algorithms were validated in 22 (46%). The sensitivity and specificity were reported for 14 (29%) of the published algorithms. Level III: Integration of Information. Figure 2 shows that none of the sensor systems integrated the sensor information with other information. However, a simulation study that focuses on integration of information is available and could be related to the Herd Navigator; this will be covered in more detail in the Discussion section. Level IV: Decision Making. With regard to fertility, 29 (60%) sensor systems provided the farmer with an estrus alert, 7 (15%) sensor systems also provided a probability with the estrus alert to describe the certainty, and 3 (6%) reported the reproduction status (e.g., postpartum anestrus, estrus cycling, potentially pregnant) to the farmer. Seven sensor systems provided the farmer with raw sensor data (e.g., the milk progesterone level) or were unclear in describing what they provided to the farmer. System Quality. Most sensor systems require the farmer to rely on herdsmanship. Sixteen (35%) of the published sensor systems reported sensitivity >80%, 8 (17%) reported specificity >98%, and 6 (13%) reported specificity somewhere between 90 and 98%. Two studies (4%) reported sensitivity >80% in combination with specificity of 99 to 100%; however, these studies used confirmed pregnancy as the gold standard. The largest test scale was 3 farms reported in 5 studies (10%), whereas 6 studies (13%) reported a test scale of 2 farms, and 25 studies (52%) reported a scale of 1 farm. None of the studies reported tests done on a few cows. The pedometer was the most studied sensor system used to detect estrus, whereas 3D-accelerometers have also been studied. For fertility, performance varies largely in terms of sensitivity and specificity, and varies in terms of the algorithm used and the gold standard. For the reported detection performance, no recommendations exist [such as the International Organization for Standardization (ISO) limit for mastitis] for estrus detection. The good performances mentioned in this paper should not be seen as target values, because determination of strict target values requires in-depth Journal of Dairy Science Vol. 96 No. 4, 2013
1934
RUTTEN ET AL.
discussion and experiments. Good performance has been reported for both pedometers and leg-attached 3D-accelerometers (sensitivity ~80–90% and specificity >90%). However, successful insemination was used as gold standard; successful inseminations are always preceded by true estrus cases but not all true estrus cases result in successful inseminations. Therefore, the reported performances for such sensor systems should be considered with caution. Progesterone measurements can be considered to be the gold standard for estrus sensors (Cavalieri et al., 2003a; Friggens et al., 2008), so progesterone sensors seem to be promising sensor systems, although not much has been published on the performance of such systems. Furthermore, progesterone measurements in laboratories are expensive, so an on-farm progesterone sensor system will be costly; whether or not such a system is profitable remains unknown. Activity meters showed combinations of high sensitivity (~80–90%) and specificity (>90%) with milk progesterone measurements as a gold standard. However, this performance was reported in a single study, which suggests using some caution when valuing this performance. HeatWatch, microphone, and temperature implant did not show better performance than pedometers or activity meters. A video camera system with automated image analysis has been tested (sensitivity 85% and specificity 99%; Alawneh et al., 2006) with successful inseminations as a gold standard. Automated video analysis requires cows to be within range of the video camera and exhibit behavior that the sensor system can recognize. Because of this, and the used gold standard, the value of this sensor system in practice would seem questionable. In some studies, the cycles are synchronized before the start of an evaluation experiment, for pedometers a sensitivity of 81% (Cavalieri et al., 2003a,b) and for HeatWatch a sensitivity of 88% (Cavalieri et al., 2003a,b,c) were reported in these studies. Sensor systems that detect estrus have added value, as farmers are known to miss cases of true estrus by visual observation (Firk et al., 2002). However, important information about whether or when to inseminate a cow could be integrated in these sensor systems to improve the quality of the information provided to the farmer. Locomotion
Level I: Sensor Technique. Thirty-eight publications describing a sensor system were found for automated detection of locomotion problems; 5 (13%) of these publications were proceedings papers. Mostly, weight distribution between the cow’s legs (17 studies, 45%) and walking behavior (16 studies, 42%) were Journal of Dairy Science Vol. 96 No. 4, 2013
studied. Some other publications studied (walking) activity (5 studies, 13%). The sensors used to measure activity were pedometers and activity meters, attached to the cows’ legs or to a neck collar and therefore classified as on-cow sensors. The sensors used for walking behavior were 3D-accelerometers and video cameras, which were classified as on-cow and off-cow sensors, respectively. The sensors for the weight distribution between the cows’ legs were 4 balance-weighing floors, weighing platforms, 2 parallel force plates, and force distribution plates. Because these sensors require the cow to stand on them or walk over them, they are classified as off-cow sensors. Level II: Data Interpretation. Figure 2 shows that 18 (47%) sensor systems included data interpretation, 8 (21%) of which had validated their algorithm. Sensitivity and specificity were reported for 6 (16%) of the algorithms. Level III: Integration of Information. None of the sensor systems integrated the sensor information with economic information (Figure 2). Level IV: Decision Making. Seven (18%) of the published sensor systems provided the farmer with an alert for abnormal locomotive behavior, whereas 4 (11%) also provided a probability with this alert and 14 (37%) provided graphs of processed sensor data (such as weight or walking activity over time). Nine (24%) of the published sensor systems provided farmers with raw sensor data (such as weight distribution over cows’ legs) or were unclear in describing what they provided to the farmer. System Quality. A combination of high (>80%) sensitivity and specificity was reported for 4 (11%) of the published sensor systems. The other studies reported performance of detection in the range of 22 to 80% for sensitivity, specificity, or both. Four (11%) of the published sensor systems were tested on 2 or more farms, whereas other studies reported a test scale of 1 farm. In this last group of studies, 14 (37%) of the published sensor systems were tested on 15 or fewer cows. For detection of locomotion problems, pedometers and 3D-accelerometers have been studied most frequently. However, video camera systems with automated image analysis have also been tested. For locomotion, the performance seems to be high in an experimental setting; however, cows needed to be guided to walk in an appropriate manner in front of the camera (correct walking speed, proper distance to the camera, and one cow at a time). Consequently, application in practice seems to be difficult because it requires important adjustments in barn layout and operational management. The studies on sensor systems for locomotion problems showed an association between sensor data and lameness (either statistical or in data patterns). It
INVITED REVIEW: SENSORS FOR DAIRY HEALTH MANAGEMENT
seems as though sensor systems could potentially discriminate between clinically lame and nonlame cows. Therefore, the studies seem to focus mostly on finding a good lameness indicator and a good way to assess it. Similarly, the demands for a lameness alert are not clear and subsequent actions by the farmer have not been studied, thus whether the sensor systems provided added value compared with farmers’ visual observation of the cows’ gait is unknown. Furthermore, it remains unclear whether the sensor is only able to detect severe locomotion problems that are also easily detectable by visual observation. Metabolism
Level I: Sensor Technique. For automated detection of metabolism parameters, 16 publications describing a sensor system were found; 6 (38%) of these publications were proceedings papers. Mostly, the pH of rumen fluid (6 studies, 38%) or rumen temperature (3 studies, 19%) were studied with a sensor. Some other publications studied sensors that measured the percentage of milk fat (1 study, 6%), the level of ketone bodies in the milk (3 studies, 19%), the cows’ rumination or walking activity (2 studies, 13%), or the cows’ body temperature (1 study, 6%). Both the pH and temperature sensors were radiotelemetric rumen boluses; that is, in-cow sensors. Furthermore, the percentage of milk fat was measured with an in-line spectrophotometer. Walking activity was measured in these studies using a pedometer (measuring walking activity) that was attached to the cows’ hind legs (i.e., an on-cow sensor). Body temperature was measured with a thermal camera (i.e., an off-cow sensor) with automated image analysis to produce BCS. Finally, the level of ketone bodies in the milk was measured with an on-line spectroscopy sensor or the HerdNavigator (i.e., an on-line sensor). Level II: Data Interpretation. Figure 2 shows that 5 (31%) of the published sensor systems include data interpretation, of which 3 (19%) had validated their algorithm. Sensitivity and specificity were reported for one (6%) of the published sensor systems. Level III: Integration of Information. Figure 2 shows that none of the sensor systems integrated the sensor information with economic information. Level IV: Decision Making. One sensor system provided the farmer with a ketosis alert. Other sensor systems provided the farmer with milk fat percentage or raw sensor data. These forms of sensor system output require farmers to interpret results from sensor measurements and their meaning for the cows’ health themselves. System Quality. Many sensor systems regarding metabolism provided the farmer with either raw sensor
1935
data (e.g., rumen pH) or indicators (e.g., milk fat percentage) that are not related to clearly defined problems or actions. One sensor system gave alerts for ketosis with a sensitivity of 70%, which is not considered high. This means that other factors, such as DIM, are needed to accurately calculate the risk of a cow suffering from subclinical ketosis (de Roos et al., 2007). So, although specificity is 95% and the test scale was large, with 217 farms included in the study, this sensor system had limitations. All reviewed articles involved testing on a single farm and often included a small number of cows, except for one study that was conducted on multiple farms (Edwards and Tozer, 2004). One study has been found describing a rumination sensor attached to a neck collar that records the sounds of the rumination process with a microphone (Bar and Solomon, 2010). Although changes in rumination behavior were suggested to have a relation to cow health, the relation between rumination behavior and cow health was not studied. For pH and temperature boluses, it is unclear what the added value is to the farmer, as no interpretation of the data was provided, whereas the added value of information seems obvious for detection of early lactation diseases and ketosis. However, these sensor systems need refinement, enhanced detection, and better data presentation. It was not clear whether the chosen devices measure the most appropriate parameters for detecting early lactation diseases and ketosis. Whether the detection of metabolic problems by sensors has added value is unclear, given the weak link between sensor information about the cow’s metabolic status and a specific problem (hence a treatment or action). In effect, the studies seem to focus mainly on whether it is feasible to measure a parameter from the cow correctly with a sensor. DISCUSSION Main Findings
This review summarized 126 published studies describing 139 sensor systems for animal health management. The number of publications for mastitis (25%), fertility (33%), or locomotion (30%) was 2 to 3 times higher than the number of publications on sensor systems to detect metabolic diseases (13%). Three possible explanations exist for this difference. The first is that sensors for fertility and mastitis have been studied for a longer time. Second, the literature has shown that mastitis, locomotion problems, and fertility problems are currently the main health issues on dairy farms (Groenendaal et al., 2004; Halasa et al., 2007; Bruijnis et al., 2010). Finally, metabolic problems are complex Journal of Dairy Science Vol. 96 No. 4, 2013
1936
RUTTEN ET AL.
disorders, with a loss of milk production as the main clinical characteristic. This decrease in milk production, however, is seen in many diseases (e.g., mastitis) and therefore is not specific enough to indicate metabolic disorders. As a result, it might be more difficult to find an appropriate indicator for metabolic problems that could be measured with a (on-farm) sensor. Much work has been done at levels I and II (Figure 1) and no studies were found for levels III and IV. For mastitis (92% of the publications on mastitis sensors) and fertility (75% of the publications on estrus detection), most work is done on level II. For locomotion (53% of the publications on detection of locomotion problems) and metabolism (69% of the publications on detection of metabolic problems), more than half of the work is done on level I. Most studies on mastitis (73% of the publications on mastitis sensors) and fertility (46% of the publications on estrus detection) described a validated algorithm, whereas fewer validated algorithms were available for locomotion (21% of the publications on detection of locomotion problems) and metabolism (19% of the publications on detection of metabolic problems). For locomotion and metabolism, approximately half of the studies described a sensor with nothing more than an assumed relation to a disease; for mastitis and fertility, this was 8 and 25%, respectively. Test scales of the studies varied considerably. For mastitis and fertility, test scales were generally larger than for locomotion and metabolism. For example, 10 cows or fewer were used in 4 locomotion studies and in 6 metabolism studies, whereas studies on sensors for mastitis and fertility all included more than 10 cows. Three locomotion studies and 4 metabolism studies included more than one farm. Eleven mastitis studies and 11 fertility studies included more than one farm. The effect of test size on detection performance is unclear, as publications with different test sizes also vary in one or more other aspects (such as sensor type, algorithm, or gold standard). It is unclear whether sensors that measure locomotion or standing behavior can detect leg or claw problems at an early stage. As leg and claw disorders are painful for a cow, she tries to cope with this pain by changing her walking and standing behavior (Juarez et al., 2003). Therefore, cows that already have pain will be detected by the sensor. From a welfare perspective, earlier detection would be more sensible. Whether or not the published sensor systems for locomotion problems could be useful tools on dairy farms to improve animal welfare is questionable. Accordingly, specificity was higher for severely lame cows (higher gait score; Bicalho et al., 2007). Furthermore, leg to weight ratio was a more accurate lameness predictor when a gait score of 3.5 was used as a lameness threshold instead of a gait Journal of Dairy Science Vol. 96 No. 4, 2013
score of 3 (Pastell et al., 2010). These 2 findings and the low detection performance that was observed for locomotion sensor systems in general suggest that mostly severe lameness could be detected with these sensor systems. Severely lame cows have a strongly abnormal gait or remain lying down more, and a farmer could identify these animals easily with a quick observation. Furthermore, economic studies indicate that subclinical cases, as well as clinical cases, of leg or claw disorders cause economic losses (Bruijnis et al., 2010). Studies that used a scoring system (such as locomotion or gait scoring) defined a cow with a score of 3 or higher as lame. Cows with a score of 2 do have a nonnormal gait and might be subclinically lame. Hoof trimming of cows with lameness score 2 might prevent (severe) clinical lameness and prevent (more) painful lesions in the cows’ claws. However, the sensor systems ignore these cows completely, which means that the sensor system produces no information that can be used for early treatment of locomotion problems. A variety of mathematical models have been used to build algorithms for automated detection and these algorithms also vary greatly in reported sensitivity and specificity. No sensor systems have been found to match the ISO standard for sensitivity and specificity, which has been formulated as appropriate for automated detection of mastitis. Because of the large variation in performance, the algorithms used, and the study design, it is not possible to make general statements on the appropriateness of the algorithms. The output (together with detection performance) of a sensor system determines the value for the farmer. Raw sensor data requires farmers to interpret the data themselves to determine whether something has changed in the cow’s health status. When the sensor system contains an algorithm that produces an alert, the interpretation for the farmer is easier as it gives a clear statement about the cow’s health status (the reliability of this statement is a different issue). Within the alerts, estrus and mastitis are more informative for the farmer, as these alerts do regard a specific condition. Alerts for locomotion problems and metabolic problems are less informative because these alerts regard abnormal values for a locomotion or metabolism indicator but not the specific disease or disorder causing the abnormality. Consequently, the farmer is required to examine the cow or other data on the cow (such as milk production records) to determine the cow’s health status. By contrast, alerts for mastitis and estrus indicate a specific disease or event and the farmer needs only to decide what to do. No publications have been found that mention decision support for dairy farms based on sensor data. Therefore, all sensor systems require the farmer to rely
INVITED REVIEW: SENSORS FOR DAIRY HEALTH MANAGEMENT
on his or her herdsmanship (i.e., the combination of the farmer’s intuition, experience, and knowledge as a herdsman) in interpreting the available information to make a decision. Sensor systems that provide a probability can make it easier for the farmer to interpret the available information, for instance, to distinguish between more and less important alerts. History
The first publications on automated detection to assist animal health management can be found in the period between 1970 and 1990. The development of the responder that enables the automatic identification and data collection of individual cows can be seen as the start of this research field. Research institutes in Germany (1976), the United Kingdom (1973), the Netherlands (1976), and the United States (1976) started by developing these transponders and tested them in practice (Rossing, 1999). Among the first applications was the automated individual feeding of dairy cows (Ipema and Rossing, 1987). Experiments were done with electrical conductivity to detect mastitis and pedometers to detect estrus. In the mid-1970s, it was recognized that visual observation of estrus was becoming more difficult in increased herd sizes; therefore, advice was given for improving visual observation, such as detection aids and reserving 20 to 30 min for observation, twice a day (Foote, 1975). As an alternative to visual observation, pedometers were tested in the early 1980s. For example, a comparison of detection methods concluded that pedometers could observe slightly fewer estrus cases than could be done with visual observation; the pedometers were not fit for remote data recording at this time (Williams et al., 1981). Pedometers are often used in Israel for fertility management in large dairy herds, whereas cycle synchronization is widely used in the United States (Galon, 2010). The pregnancy rate of inseminated cows has been shown to be equal for estrus synchronization and estrus detection with pedometers (Galon, 2010). This result implies that automated estrus detection might be an alternative for estrus synchronization in the fertility management of larger dairy herds. The first studies focusing on electrical conductivity as a measure for mastitis were performed in the late 1960s; relations between EC and mastitis indicators were found, but interpretation of EC measurement caused difficulties due to large variation in EC values (Greatrix et al., 1968; Little et al., 1968). The first suggestions for in-line EC measurement can be found in the literature around the mid-1970s (Wolfe et al., 1972; Linzell and Peaker, 1975). Although research was done in those years, a breakthrough only occurred when the number of farms using an AMS increased around 2000.
1937
Subsequently, much research was done on refining detection models for mastitis and on alternative sensors to detect mastitis. New sensor systems were developed because of increasing herd sizes, increasing labor cost, as well as the increased use and familiarity with information technology in general and sensor systems specifically (due to experience with AMS, for example). Next to these trends in dairy farming, trends in public opinion in Western countries should also be considered when developing new sensor systems. It follows that it is important for dairy farmers to improve or maintain the welfare of their cows and to show that this is done to society. From this perspective, sensor systems could be seen as a statement of how the dairy sector is taking animal welfare and is its responsibility in safeguarding animal welfare seriously. As discussed, techniques such as EC and use of pedometers are somewhat older than other sensors techniques mentioned in this review. Studies were published on these techniques in the 1980s and 1990s, which excludes them from the current review, as it covers only publications since 2002. Previous reviews have discussed older literature on EC and pedometers (Firk et al., 2002; Norberg, 2005; Brandt et al., 2010; Hogeveen et al., 2010; Hovinen and Pyörälä, 2011). Locomotion and fertility seem to be relatively new topics in sensor research, which means that the present review was likely to include most of the publications on these topics. Gold Standard
The choice of a gold standard is important for the detection performance of a sensor system. How well a gold standard reflects reality determines the number of true cases used for algorithm development and validation. If true cases of disease or estrus are missing, or false cases are included in the gold standard data (visual observation and scoring system are sensitive for this problem), then the processes of algorithm building and validation will be affected. As cases will be missing or false cases will be included in the data set, the algorithm will be misspecified and in the validation some alert will be wrongly classified as false positive or false negative. In a more practical sense, the intended purpose of a sensor system is important when choosing a gold standard. For the substitution of labor by capital—which means that the sensor system will do a farmer’s job—a gold standard that reflects a farmer’s detection capabilities could be appropriate. However, for an early warning system, the gold standard should be able to correctly pick up disease or estrus at an early stage. Another example of the relation between gold standard and intended purpose is detection of clinical Journal of Dairy Science Vol. 96 No. 4, 2013
1938
RUTTEN ET AL.
mastitis, for which visual judgment of milk for clots is appropriate. In contrast, using SCC and CMT as a gold standard would include detection of subclinical cases. It is also important to consider the frequency at which the gold standard is determined in the studies. Overly long intervals between gold standard assessments will result in missed true cases, whereas short intervals increase the workload involved, and consequently the cost of the experiments. An example of an overly long interval could be using monthly SCC estimates from milk quality controls as a gold standard. This would result in missed (sub)clinical mastitis cases or late detection of (sub)clinical mastitis cases in the reference data used to build and validate a detection algorithm. An example of a short interval would be daily progesterone measurements, which would require collecting milk samples per cow each day for analysis in a laboratory, which means high costs and workload. Time Resolution
Time resolution (also referred to as the time window of detection) can be split into 2 slightly different concepts. The first is the time resolution of the sensor, including measurements, interpretation, and detection. The second is the time resolution of validation, which means matching of alerts to gold standard measurements over a defined time period. The frequency used to record measurements of the sensor has an influence on the minimal time of detection. Furthermore, an increased number of measurements decreases the influence that erroneous measurements have on predictions of the detection algorithm. For the detection algorithm, the frequency with which it produces information about a cow’s health based on sensor data partly determines the time between changes in the cow’s physiology and the farmer being informed of the change. Obviously, the time between detection and informing the farmer also depends on the farmer. Technical innovations (such as smartphones) might be able to help inform the farmer with sensor information more quickly. The time between the change in the cow’s health and informing the farmer is also important in relation to various diseases. For instance, a locomotion problem, although painful, does not require the farmer’s immediate attention, whereas estrus only has a limited period during which successful insemination is possible. As both the gold standard and sensor system information are point estimates that are measured or determined with their respective frequencies, validation studies must match these point estimates to each other. For mastitis, an in-depth analysis has been conducted of the influence that time resolution of validaJournal of Dairy Science Vol. 96 No. 4, 2013
tion has on sensor system performance and its use in practice (Hogeveen et al., 2010). A longer period for matching gold standard and alerts generally results in higher sensitivity and specificity. Early detection can be accomplished by producing information regarding the cow’s health before clinical signs of disease occur (Hogeveen et al., 2010). However, information provided by the detection algorithm after the onset of disease postpones treatment, whereas the farmer may perceive information before onset as a false alert, they consider a maximum 24 h before onset of the disease as desirable (Mollenhorst et al., 2012). For estrus detection, there cannot be much debate about the fact that a timeframe of about 24 h is needed to enable insemination after an estrus alert. For locomotion and metabolic problems, the time component is less clear, as the detected conditions (diseases) of the cow remain unclear. Therefore, it is unknown what action (e.g., treatment) a farmer should consider based on the sensor information. It follows that the timeframe, and preferences of farmers for timeframes, for the information cannot be studied. In the literature used for this review, it was not always clear whether the term “time window” of detection referred to the time resolution of the sensor or the time resolution of validation. In addition, for the time resolution of the sensor, often only 1 or 2 single aspects, such as the frequency the sensor used to take measurements, were mentioned. Moreover, the literature only discusses aspects of the time resolution briefly, if at all. So, considering the publications in the review, the time resolution of the sensor systems remains a greatly neglected aspect in published papers. Sensor Systems Excluded from this Review
Devices Not Described in (Recent) Scientific Literature. This overview might not include all sensor systems that have been developed or patented or are available on the market. This is because the present review has only summarized the sensor systems published in the scientific literature in recent years. A few examples of sensors that are on the market but not documented in the scientific literature are the SensOor (Agis Automatisering, Harmelen, the Netherlands), which is a temperature, motion, and sound sensor that is attached to a cow’s ear tags, and the Vel Phone (Amelis Medria, Carpiquet, France), a vaginal thermometer that predicts the moment of calving. In contrast, the scientific literature has reported on certain sensors for which it is not clear if they are available on the market. For sensors such as the HerdNavigator (DeLaval, Tumba, Sweden), IceTag (IceRobotics, South Queensferry, UK), and the sensors of AMS of Lely (Lely Industries, Maassluis, the
INVITED REVIEW: SENSORS FOR DAIRY HEALTH MANAGEMENT
Netherlands) and DeLaval, however, clear connections between scientific publications and commercially available sensor systems can be made. Devices That Are Not (Yet) Sensors. Some relevant publications do not fit the used definition of a sensor for the support of animal health management, either because the sensor systems are not (yet) automated devices or because they are applied for optimization of production rather than health management. Thermal cameras have been used for the detection of mastitis; however, these devices were hand-held (Berry et al., 2003; Colak et al., 2008; Hovinen et al., 2008; Polat et al., 2010). Whereas these papers have described an association between mastitis and udder skin temperature, no validated algorithms have been described. These cameras could be developed into a sensor system by, for example, installing them in an AMS to take measurements during milking. It is necessary to mention certain publications that have used laboratory tests and simulation studies as they describe the principles upon which other sensor systems, such as the Herd Navigator, are based. The Herd Navigator itself has been scarcely described in the literature. The relation between the chosen indicator and a reference test has been studied for mastitis (Chagunda et al., 2006a). The models calculate a risk of disease and when a cow should be tested by the sensor system (Friggens and Chagunda, 2005; Chagunda et al., 2006b; Friggens et al., 2007). The model for estrus detection has been tested with real cow data (Friggens et al., 2008), and the economic effect of such a sensor system on the farm has been studied (Østergaard et al., 2005). Furthermore, for estrus information of the sensor, the estrus alert is integrated with economic and other information. The information used included prices for milk, livestock, feed, veterinary services, and insemination using a budgeting approach (Østergaard et al., 2005). Therefore, although the complete system has been only described in proceedings papers, the underlining principles have been studied in greater depth. An example of a sensor system that is not included in this review because it is not related to animal health management is the dynamic concentrate feeding system for dairy cows that includes all levels of Figure 1 (André et al., 2010a,b, 2011). In short, this system monitors the cows’ response in milk yield to an increase in concentrates. It then optimizes the concentrate supply by calculating the net merit of the increase in milk yield from extra concentrate supply by considering milk price (including milk fat and protein) and concentrate price. This work can be seen as a very specific application of sensor techniques, as the system is capable of making an automated decision for the farmer. In animal health management, this might not be feasible for many appli-
1939
cations, as an automated treatment of the cow appears to be technically infeasible at this moment. Decision Support for Animal Health Management
Studies on decision support and economic considerations of management decisions are available for both mastitis and fertility, but they are not integrated in a sensor system. For mastitis, decision support systems provide advice for clinical cases (Seegers et al., 2003; Halasa et al., 2007; Pinzón-Sánchez et al., 2011; Steeneveld et al., 2011). However, subclinical mastitis may be detected by a sensor system and could be relevant, as a subclinical case could develop into clinical mastitis or chronic subclinical mastitis. Literature is currently available that describes the treatment effectiveness and economic implications of treating subclinical mastitis (Swinkels et al., 2005a,b; Steeneveld et al., 2007; van den Borne et al., 2010). Treatment of persistent subclinical mastitis is economically profitable for many cows when indirect effects of cure are considered (i.e., prevention of clinical flare-ups and transmission to other cows; Swinkels et al., 2005b). However, most studies on sensor systems for mastitis still focus on detecting clinical mastitis and do not determine subclinical cases for which treatment would be profitable. Another limitation is that many decision support systems were developed to support cow health management when milking in a milking parlor. However, the current trend in western Europe is the use of AMS, which have changed the operational management on dairy farms dramatically. A few studies have focused on pathogen-specific treatment of mastitis, although the economic merit and practical feasibility of pathogenspecific treatment seems to be absent (Kamphuis et al, 2011; Steeneveld et al., 2011). Decision support systems are available for fertility management (Groenendaal et al., 2004; Olynk and Wolf, 2009; Inchaisri et al., 2010, 2011) and could be used to develop sensor systems with integrated decision support. Some refinement could be useful, such as translating sensor measurement into an optimal insemination moment that corresponds with the decision support system. Furthermore, the certainty associated with an alert (i.e., the degree to which the sensor system is certain that this alert is true) could be a nice addition to a decision support system. Little research is available on the effectiveness of treatments for locomotion and metabolism, or the economic effect of such treatments. For locomotion, the economic effect of lameness (Ettema and Østergaard, 2006; Bruijnis et al., 2010) and the effect of preventive measures (Ettema and Østergaard, 2006) have been studied. For metabolism, a lot of research has been conducted on animal nutrition to find the optimal feeding strategy Journal of Dairy Science Vol. 96 No. 4, 2013
1940
RUTTEN ET AL.
to prevent metabolic problems; for example, fatty liver and negative energy balance (Bobe et al., 2004; van Knegsel et al., 2007). Economic Implications
For farmers, the decision to invest in sensor technology to support cow health management will depend largely on the profitability of such a sensor system. In addition, a farm’s economic prospects and financial position (e.g., farm solvency), the presence of a potential successor, and farm size are general factors that underlie investment decisions (Oude Lansink et al., 2001; Aramyan et al., 2007). The economic benefits of an automated estrus detection system have been studied, such as the simulation study based on the average characteristics of a Dutch dairy herd (e.g., 7,500 kg of milk, estrus detection rate of 50%, and conception rate of 40%; van Asseldonk et al., 1999b). Under the assumption that estrus detection was improved from 50 to 90%, gross margin would increase by 1.25 Dutch guilders (€0.57) per 100 kg of fat- and protein-corrected milk (van Asseldonk et al., 1999b). Accordingly, this increase in the gross margin of a sensor system determines the financial room (or investment potential for a sensor system) for the annual costs of a sensor system (including investment and operational costs). Investment in sensor systems can be analyzed by calculating the net present value for investment profitability (e.g., milk or slaughter) and expenses (such as feed or disease), combined with a stochastic Monte Carlo simulation to assess the uncertainty inherent to dairy farming (Bewley et al., 2010b). For example, the profitability of investment in an automated BCS system depends largely on the current BCS distribution of a herd, the effect of nonoptimal BCS, and the ability to make changes to achieve optimal BCS (Bewley et al., 2010a). However, these studies ignore the effect of a sensor system on labor requirement of the dairy farm, which also has economic importance. For the economic implications of sensor systems in dairy health management only the studies of Bewley et al. (2010a,b) and van Asseldonk et al. (1999a,b) have been found. Toward Application in Practice
Farmers should consider various factors in their operational management, such as the cows’ condition, expected development of the cows’ condition, the expected effect of an action, and the costs of (not) taking action. For most farmers, these considerations are a guestimate, at best, and mostly based on their herdsmanship (Groenendaal et al., 2004). It is difficult to make an optimal treatment decision based on all available inJournal of Dairy Science Vol. 96 No. 4, 2013
formation, treatment options, and cure-influencing cow factors (Steeneveld et al., 2011). Therefore, decision support systems can help farmers make these decisions based less on farmers’ herdsmanship and more on the economic value of an individual cow (Groenendaal et al., 2004). Based on the findings of this literature review, a few suggestions, both general and specific, can be made for future research. In sensor studies, separate data sets should be used for algorithm building and validation to show appropriate and interstudy comparable performance. Furthermore, the time resolution of a sensor system should be described more clearly. For mastitis, a need for better detection models in practice was noted. Whether the focus needs to be on new algorithms or new sensors is open for debate. Decision support systems have been developed for mastitis, but these were not developed for detection based on sensor data and did not consider the uncertainties (such as false alerts or missed cases) associated with this detection. Various types of sensors have been studied for estrus detection and, although performance varies, promising systems have been described. Various studies have also been published on decision support. An interesting avenue for new research could be the use of an integrated fertility system in practice. Another possibility could be to compare the economic (and technical) performance of farms using sensor technology for fertility management and farms that do not use these sensors. For locomotion, sensors have been suggested and tested, but the performance of detection models needs further research. Definition of the gold standard for locomotion calls for further study, especially with regard to the appropriate frequency for inspection. It would be helpful to know what lameness cases (in terms of severity, number of cows, infectious or noninfectious, and so on) a sensor system should find. Only a few studies have described decision support models; new research could be conducted on the effect that lameness treatment has on cow health and farm income. For metabolic problems, more research is needed to identify the indicators for developing metabolic problems; for example, the relation between rumen pH and rumen health. This knowledge would be needed to develop detection models that clearly indicate to the farmer whether something is wrong with the cow and, if so, what. CONCLUSIONS
Most studies were concerned with the detection of mastitis (25%), fertility (33%), and locomotion problems (30%), with fewer studies (16%) related to the de-
INVITED REVIEW: SENSORS FOR DAIRY HEALTH MANAGEMENT
tection of metabolic problems. Many studies presented sensor systems at levels I and II, but none did so at levels III and IV. Most of the work for mastitis (92%) and fertility (75%) is done at level II. For locomotion (53%) and metabolism (69%), more than half of the work is done at level I. Sensor systems have been developed to higher levels for mastitis and fertility (Figure 1) than for leg and claw problems and metabolic problems. Most published studies for mastitis and fertility clearly describe what disease they are aiming to detect, and most of these studies focus on the performance of the sensor system. For locomotion, the studies focus on finding a good method of measuring a parameter and detecting locomotion problems. For metabolic problems, the studies focus on finding good methods to measure a parameter, although the relation with cow health remains unclear for these measurements. For sensors systems, no clear difference in the performance of various algorithms was noted. Detection performance of the sensor systems varies based on the choice of gold standards, algorithms, and test sizes (number of farms and cows). The most important remark for further sensor research is to have a clear aim of what information about the cow’s health should be produced by the sensor system under study. In respect to the aimed information an appropriate gold standard, algorithm, test size, and time resolution should be chosen. Published analyses of investment in sensor systems are rare. Similarly, the economic and management value of sensor information on farms remains unclear. No published sensor systems have an integrated decision support system. ACKNOWLEDGMENTS
We gratefully acknowledge H. Knijn (CRV, Arnhem, the Netherlands), A. G. J. M. Oude Lansink (Business Economics Group, Wageningen University, the Netherlands), and C. Lokhorst (Livestock Research, part of Wageningen UR, Lelystad, the Netherlands) for their inspiring discussion of this review and their critical comments on the manuscript. This research was supported by the Dutch research program Smart Dairy Farming, which is financed by Friesland Campina (Amersfoort, the Netherlands), CRV (Arnhem, the Netherlands), Agrifirm (Apeldoorn, the Netherlands), Dairy Valley (Leeuwarden, the Netherlands), Investment and Development Agency for the Northern Netherlands (Groningen, the Netherlands), the Dutch Dairy Board (Zoetermeer, the Netherlands) and the ministry of Economic Affairs, Agriculture and Innovation, Pieken in de Delta (Den Haag, the Netherlands).
1941
REFERENCES Akerstedt, M., L. Bjorck, K. P. Waller, and A. Sternesjo. 2006. Biosensor assay for determination of haptoglobin in bovine milk. J. Dairy Res. 73:299–305. Alawneh, J. I., N. B. Williamson, and D. Bailey. 2006. Comparison of a camera-software system and typical farm management for detecting oestrus in dairy cattle at pasture. N. Z. Vet. J. 54:73–77. Alzahal, O., H. AlZahal, M. A. Steele, M. Van Schaik, I. Kyriazakis, T. F. Duffield, and B. W. McBride. 2011. The use of a radiotelemetric ruminal bolus to detect body temperature changes in lactating dairy cattle. J. Dairy Sci. 94:3568–3574. AlZahal, O., E. Kebreab, J. France, and B. W. McBride. 2007a. A mathematical approach to predicting biological values from ruminal pH measurements. J. Dairy Sci. 90:3777–3785. AlZahal, O., B. Rustomo, N. E. Odongo, T. F. Duffield, and B. W. McBride. 2007b. Technical note: A system for continuous recording of ruminal pH in cattle. J. Anim. Sci. 85:213–217. AlZahal, O., M. A. Steele, E. V. Valdes, and B. W. McBride. 2009. The use of a telemetric system to continuously monitor ruminal temperature and to predict ruminal pH in cattle. J. Dairy Sci. 92:5697–5701. André, G., P. B. M. Berentsen, B. Engel, C. J. A. M. de Koning, and A. G. J. M. Oude Lansink. 2010a. Increasing the revenues from automatic milking by using individual variation in milking characteristics. J. Dairy Sci. 93:942–953. Andre, G., P. B. M. Berentsen, G. Van Duinkerken, B. Engel, and A. G. J. M. Oude Lansink. 2010b. Economic potential of individual variation in milk yield response to concentrate intake of dairy cows. J. Agric. Sci. 148:263–276. Andre, G., B. Engel, P. B. M. Berentsen, G. Van Duinkerken, and A. G. J. M. Oude Lansink. 2011. Adaptive models for online estimation of individual milk yield response to concentrate intake and milking interval length of dairy cows. J. Agric. Sci. 149:769–781. Aramyan, L. H., A. G. J. M. Oude Lansink, and J. Verstegen. 2007. Factors underlying the investment decision in energy-saving systems in Dutch horticulture. Agric. Syst. 94:520–527. Balzer, H. U., K. Kultus, and S. Kohler. 2009. A new generation of fertility monitoring in cattle herds. Pages 225–234 in Proc. Fourth Eur. Conf. Precision Livestock Farming, Wageningen, the Netherlands. Wageningen Academic Publishers, Wageningen, the Netherlands. Bar, D., and R. Solomon. 2010. Rumination collars: What can they tell us. Pages 214–215 in Proc. First North Am. Conf. Precision Dairy Management, Toronto, Canada. Berry, R. J., A. D. Kennedy, S. L. Scott, B. L. Kyle, and A. L. Schaefer. 2003. Daily variation in the udder surface temperature of dairy cows measured by infrared thermography: Potential for mastitis detection. Can. J. Anim. Sci. 83:687–693. Bewley, J. M., M. D. Boehlje, A. W. Gray, H. Hogeveen, S. J. Kenyon, S. D. Eicher, and M. M. Schutz. 2010a. Assessing the potential value for an automated dairy cattle body condition scoring system through stochastic simulation. Agric. Finance Rev. 70:24. Bewley, J. M., M. D. Boehlje, A. W. Gray, H. Hogeveen, S. J. Kenyon, S. D. Eicher, and M. M. Schutz. 2010b. Stochastic simulation using @Risk for dairy business investment decisions. Agric. Finance Rev. 70:28. Bewley, J. M., and M. M. Schutz. 2010. Recent studies using a reticular bolus system for monitoring dairy cattle core body temperature. Pages 218–219 in Proc. First North Am. Conf. Precision Dairy Management, Toronto, Canada. Bicalho, R. C., S. H. Cheong, G. Cramer, and C. L. Guard. 2007. Association between a visual and an automated locomotion score in lactating Holstein cows. J. Dairy Sci. 90:3294–3300. Bobe, G., J. W. Young, and D. C. Beitz. 2004. Invited review: Pathology, etiology, prevention, and treatment of fatty liver in dairy cows. J. Dairy Sci. 87:3105–3124.
Journal of Dairy Science Vol. 96 No. 4, 2013
1942
RUTTEN ET AL.
Brandt, M., A. Haeussermann, and E. Hartung. 2010. Invited review: Technical solutions for analysis of milk constituents and abnormal milk. J. Dairy Sci. 93:427–436. Brehme, U., U. Stollberg, R. Holz, and T. Schleusener. 2008. ALT pedometer—New sensor-aided measurement system for improvement in oestrus detection. Comput. Electron. Agric. 62:73–80. Bruijnis, M. R. N., H. Hogeveen, and E. N. Stassen. 2010. Assessing economic consequences of foot disorders in dairy cattle using a dynamic stochastic simulation model. J. Dairy Sci. 93:2419–2432. Brunassi, L. D., D. J. de Moura, I. D. Naas, M. M. do Vale, S. R. L. de Souza, K. A. O. de Lima, T. M. R. de Carvalho, and L. G. D. Bueno. 2010. Improving detection of dairy cow estrus using fuzzy logic. Sci. Agric. 67:503–509. Cavalieri, J., V. E. Eagles, M. Ryan, and K. L. MacMillan. 2003a. Comparison of four methods for detection of oestrus in dairy cows with resynchronised oestrous cycles. Aust. Vet. J. 81:422–425. Cavalieri, J., V. E. Eagles, M. Ryan, and K. L. MacMillan. 2003b. Role of the sensitivity of detection of oestrus in the submission rate of cows treated to resynchronise oestrus. Aust. Vet. J. 81:416–421. Cavalieri, J., L. R. Flinker, G. A. Anderson, and K. L. Macmillan. 2003c. Characteristics of oestrus measured using visual observation and radiotelemetry. Anim. Reprod. Sci. 76:1–12. Cavero, D., K. H. Tolle, C. Buxade, and J. Krieter. 2006. Mastitis detection in dairy cows by application of fuzzy logic. Livest. Sci. 105:207–213. Cavero, D., K. H. Tolle, C. Henze, C. Buxade, and J. Krieter. 2008. Mastitis detection in dairy cows by application of neural networks. Livest. Sci. 114:280–286. Cavero, D., K. H. Tolle, G. Rave, C. Buxade, and J. Krieter. 2007. Analysing serial data for mastitis detection by means of local regression. Livest. Sci. 110:101–110. Chagunda, M. G., T. Larsen, M. Bjerring, and K. L. Ingvartsen. 2006a. L-lactate dehydrogenase and N-acetyl-β-d-glucosaminidase activities in bovine milk as indicators of non-specific mastitis. J. Dairy Res. 73:431–440. Chagunda, M. G. G., N. C. Friggens, M. D. Rasmussen, and T. Larsen. 2006b. A model for detection of individual cow mastitis based on an indicator measured in milk. J. Dairy Sci. 89:2980–2998. Chapinal, N., A. M. de Passille, M. Pastell, L. Hanninen, L. Munksgaard, and J. Rushen. 2011. Measurement of acceleration while walking as an automated method for gait assessment in dairy cattle. J. Dairy Sci. 94:2895–2901. Chapinal, N., A. M. de Passille, and J. Rushen. 2009. Weight distribution and gait in dairy cattle are affected by milking and late pregnancy. J. Dairy Sci. 92:581–588. Chapinal, N., A. M. de Passille, J. Rushen, and S. Wagner. 2010. Automated methods for detecting lameness and measuring analgesia in dairy cattle. J. Dairy Sci. 93:2007–2013. Claycomb, R. W., P. T. Johnstone, G. A. Mein, and R. A. Sherlock. 2009. An automated in-line clinical mastitis detection system using measurement of conductivity from foremilk of individual udder quarters. N. Z. Vet. J. 57:208–214. Colak, A., B. Polat, Z. Okumus, M. Kaya, L. E. Yanmaz, and A. Hayirli. 2008. Early detection of mastitis using infrared thermography in dairy cows. J. Dairy Sci. 91:4244–4248. Darr, M., and W. Epperson. 2009. Embedded sensor technology for real time determination of animal lying time. Comput. Electron. Agric. 66:106–111. de Koning, C. J. A. M. 2010. Automatic milking—Common practice on dairy farms. Page 52–67 in Proc. First North Am. Conf. Precision Dairy Management, Toronto, Canada. de Mol, R. M., E. J. B. Bleumer, P. H. Hogewerf, and A. H. Ipema. 2009a. Recording of dairy cow behaviour with wireless accelerometers. Pages 349–356 in Proc. Fourth Eur. Conf. Precision Livestock Farming. Wageningen Academic Publishers, Wageningen, the Netherlands. de Mol, R. M., R. J. H. Lammers, J. C. A. M. Pompe, A. H. Ipema, and P. H. Hogewerf. 2009b. Recording and analysis of locomotion in dairy cows with 3D accelerometers. Pages 333–341 in Proc. Fourth Eur. Conf. Precision Livestock Farming, Wageningen, the
Journal of Dairy Science Vol. 96 No. 4, 2013
Netherlands. Wageningen Academic Publishers, Wageningen, the Netherlands. de Mol, R. M., P. H. F. M. Verhoeven, P. H. Hogewerf, and A. H. Ipema. 2011. Automated behaviour monitoring in dairy cows. Pages 70–80 in Proc. Fifth Eur. Conf. Precision Livestock Farming, Prague, Czech Republic. Czech Centre for Science and Society, Prague. de Roos, A. P. W., H. van den Bijgaart, J. Horlyk, and G. de Jong. 2007. Screening for subclinical ketosis in dairy cattle by Fourier transform infrared spectrometry. J. Dairy Sci. 90:1761–1766. Edwards, J. L., and P. R. Tozer. 2004. Using activity and milk yield as predictors of fresh cow disorders. J. Dairy Sci. 87:524–531. Espada, E., and H. Vijverberg. 2002. Milk colour analysis as a tool for the detection of abnormal milk. Pages IV-28–38 in Proc. First North Am. Conf. Robotic Milking, Toronto. Wageningen Pers, Wageningen, the Netherlands. Ettema, J. F., and S. Østergaard. 2006. Economic decision making on prevention and control of clinical lameness in Danish dairy herds. Livest. Sci. 102:92–106. Firk, R., E. Stamer, W. Junge, and J. Krieter. 2002. Automation of oestrus detection in dairy cows: A review. Livest. Prod. Sci. 75:219–232. Firk, R., E. Stamer, W. Junge, and J. Krieter. 2003a. Improving oestrus detection by combination of activity measurements with information about previous oestrus cases. Livest. Prod. Sci. 82:97–103. Firk, R., E. Stamer, W. Junge, and J. Krieter. 2003b. Oestrus detection in dairy cows based on serial measurements using univariate and multivariate analysis. Arch. Tierzucht. 46:127–142. Foote, R. H. 1975. Estrus detection and estrus detection aids. J. Dairy Sci. 58:248–256. Friggens, N. C., M. Bjerring, C. Ridder, S. Højsgaard, and T. Larsen. 2008. Improved detection of reproductive status in dairy cows using milk progesterone measurements. Reprod. Domest. Anim. 43:113–121. Friggens, N. C., and M. G. G. Chagunda. 2005. Prediction of the reproductive status of cattle on the basis of milk progesterone measures: Model description. Theriogenology 64:155–190. Friggens, N. C., M. G. G. Chagunda, M. Bjerring, C. Ridder, S. Højsgaard, and T. Larsen. 2007. Estimating degree of mastitis from time-series measurements in milk: A test of a model based on lactate dehydrogenase measurements. J. Dairy Sci. 90:5415–5427. Galon, N. 2010. The use of pedometry for estrus detection in dairy cows in Israel. J. Reprod. Dev. 56:S48–S52. Gasteiner, J., M. Fallast, S. Rosenkranz, J. Hausler, K. Schmeider, and T. Gugenberge. 2009. Measuring rumen pH and temperature by an indwelling and wireless data transmitting unit and application under different feeding conditions. Pages 127–133 in Proc. Fourth Eur. Conf. Prec. Livestock Farming, Wageningen, the Netherlands. Wageningen Academic Publishers, Wageningen, the Netherlands. Gillis, E. H., J. P. Gosling, J. M. Sreenan, and M. Kane. 2002. Development and validation of a biosensor-based immunoassay for progesterone in bovine milk. J. Immunol. Methods 267:131–138. Giordano, J. O., P. M. Fricke, M. C. Wiltbank, and V. E. Cabrera. 2011. An economic decision-making support system for selection of reproductive management programs on dairy farms. J. Dairy Sci. 94:6216–6232. Goense, D., H. W. J. Houwers, H. C. Muller, D. Unsenos, and W. Wehren. 2009. A Wireless network for measuring rumen pH in dairy cows. Pages 117–125 in Proc. Fourth Eur. Conf. Precision Livestock Farming, Wageningen, the Netherlands. Wageningen Academic Publishers, Wageningen, the Netherlands. Gordon, P. 2011. Oestrus detection in dairy cattle. In Pract. 33:542– 546. Greatrix, G. R., J. C. Quayle, and R. A. Coombe. 1968. Detection of abnormal milk by electrical means. J. Dairy Res. 35:213. Groenendaal, H., D. T. Galligan, and H. A. Mulder. 2004. An economic spreadsheet model to determine optimal breeding and replacement decisions for dairy cattle. J. Dairy Sci. 87:2146–2157. Halachmi, I., P. Polak, D. J. Roberts, M. Klopcic, and J. M. Bewley. 2009. Thermally sensed, automatic cow body condition scoring. Pages 193–200 in Proc. Fourth Eur. Conf. Precision Livestock
INVITED REVIEW: SENSORS FOR DAIRY HEALTH MANAGEMENT
Farming, Wageningen, the Netherlands. Wageningen Academic Publishers, Wageningen, the Netherlands. Halasa, T., K. Huijps, O. Osteras, and H. Hogeveen. 2007. Economic effects of bovine mastitis and mastitis management: A review. Vet. Q. 29:18–31. Hassan, K. J., S. Samarasinghe, and M. G. Lopez-Benavides. 2009. Use of neural networks to detect minor and major pathogens that cause bovine mastitis. J. Dairy Sci. 92:1493–1499. Higginson, J. H., S. T. Millman, K. E. Leslie, and D. F. Kelton. 2010. Validation of a new pedometry system for use in behavioural research and lameness detection in dairy cattle. Pages 132–133 in Proc. First North Am. Conf. Prec. Dairy Management, Toronto, Canada. Hockey, C., J. M. Morton, S. T. Norman, and M. R. McGowan. 2010a. Evaluation of a neck mounted 2-hourly activity meter system for detecting cows about to ovulate in two paddock-based Australian dairy herds. Reprod. Domest. Anim. 45:e107–e117. Hockey, C. D., J. M. Morton, S. T. Norman, and M. R. McGowan. 2010b. Improved prediction of ovulation time may increase pregnancy rates to artificial insemination in lactating dairy cattle. Reprod. Domest. Anim. 45:e239–e248. Hogeveen, H., C. Kamphuis, W. Steeneveld, and H. Mollenhorst. 2010. Sensors and clinical mastitis—The quest for the perfect alert. Sensors (Basel Switzerland) 10:7991–8009. Højsgaard, S., and N. C. Friggens. 2010. Quantifying degree of mastitis from common trends in a panel of indicators for mastitis in dairy cows. J. Dairy Sci. 93:582–592. Holman, A., J. Thompson, J. E. Routly, J. Cameron, D. N. Jones, D. Grove-White, R. F. Smith, and H. Dobson. 2011. Comparison of oestrus detection methods in dairy cattle. Vet. Rec. 169:47. Hovinen, M., A. M. Aisla, and S. Pyörälä. 2006. Accuracy and reliability of mastitis detection with electrical conductivity and milk colour measurement in automatic milking. Acta Agric. Scand. A Anim. Sci. 56:121–127. Hovinen, M., and S. Pyörälä. 2011. Invited review: Udder health of dairy cows in automatic milking. J. Dairy Sci. 94:547–562. Hovinen, M., J. Siivonen, S. Taponen, L. Hanninen, M. Pastell, A. M. Aisla, and S. Pyörälä. 2008. Detection of clinical mastitis with the help of a thermal camera. J. Dairy Sci. 91:4592–4598. Inchaisri, C., R. Jorritsma, P. Vos, G. C. van der Weijden, and H. Hogeveen. 2010. Economic consequences of reproductive performance in dairy cattle. Theriogenology 74:835–846. Inchaisri, C., R. Jorritsma, P. Vos, G. C. van der Weijden, and H. Hogeveen. 2011. Analysis of the economically optimal voluntary waiting period for first insemination. J. Dairy Sci. 94:3811–3823. Ipema, A. H., D. Goense, P. H. Hogewerf, H. W. J. Houwers, and H. van Roest. 2008. Pilot study to monitor body temperature of dairy cows with a rumen bolus. Comput. Electron. Agric. 64:49–52. Ipema, A. H., and W. Rossing. 1987. Automatic individual feeding of dairy cattle. Pages 41–51 in Proc. Third Symp. Automation in Dairy, Wageningen, the Netherlands. Instituut voor Mechanisatie, Arbeid en Gebouwen, Wageningen, the Netherlands. ISO (International Organization for Standardization). 2007. Automatic milking systems – Requirements and testing. Annex C Example of methods of evaluating detection systems for milk deemed as abnormal due to blood or changes in homogeneity. ISO 20966:2007 (Geneva, Switzerland). Ito, K., M. A. G. von Keyserlingk, S. J. LeBlanc, and D. M. Weary. 2010. Lying behavior as an indicator of lameness in dairy cows. J. Dairy Sci. 93:3553–3560. Jonsson, R., M. Blanke, N. K. Poulsen, F. Caponetti, and S. Højsgaard. 2011. Oestrus detection in dairy cows from activity and lying data using on-line individual models. Comput. Electron. Agric. 76:6–15. Juarez, S. T., P. H. Robinson, E. J. DePeters, and E. O. Price. 2003. Impact of lameness on behavior and productivity of lactating Holstein cows. Appl. Anim. Behav. Sci. 83:1–14. Kamphuis, C., B. DelaRue, C. R. Burke, and J. Jago. 2012. Field evaluation of 2 collar-mounted activity meters for detecting cows in estrus on a large pasture-grazed dairy farm. J. Dairy Sci. 95:3045–3056.
1943
Kamphuis, C., H. Mollenhorst, A. Feelders, D. Pietersma, and H. Hogeveen. 2010a. Decision-tree induction to detect clinical mastitis with automatic milking. Comput. Electron. Agric. 70:60–68. Kamphuis, C., H. Mollenhorst, J. A. P. Heesterbeek, and H. Hogeveen. 2010b. Detection of clinical mastitis with sensor data from automatic milking systems is improved by using decision-tree induction. J. Dairy Sci. 93:3616–3627. Kamphuis, C., H. Mollenhorst, and H. Hogeveen. 2011. Sensor measurements revealed: Predicting the Gram-status of clinical mastitis causal pathogens. Comput. Electron. Agric. 77:86–94. Kamphuis, C., D. Pietersma, R. Van der Tol, M. Wiedemann, and H. Hogeveen. 2008a. Using sensor data patterns from an automatic milking system to develop predictive variables for classifying clinical mastitis and abnormal milk. Comput. Electron. Agric. 62:169–181. Kamphuis, C., R. Sherlock, J. Jago, G. Mein, and H. Hogeveen. 2008b. Automatic detection of clinical mastitis is improved by in-line monitoring of somatic cell count. J. Dairy Sci. 91:4560–4570. Kujala, M., M. Pastell, and T. Soveri. 2008. Use of force sensors to detect and analyse lameness in dairy cows. Vet. Rec. 162:365–368. Kultus, K., H. U. Balzer, and S. Kohler. 2011. Comparison of results using smardwatch to detect oestrus in dairy cattle parallel to progesterone test and visual detection. Pages 154–162 in Proc. Fifth Eur. Conf. Precision Livestock Farming, Prague, Czech Republic. Czech Centre for Science and Society, Prague. Ledgerwood, D. N., C. Winckler, and C. B. Tucker. 2010. Evaluation of data loggers, sampling intervals, and editing techniques for measuring the lying behavior of dairy cattle. J. Dairy Sci. 93:5129–5139. Liberati, P., and P. Zappavigna. 2009. Improving the automated monitoring of dairy cows by integrating various data acquisition systems. Comput. Electron. Agric. 68:62–67. Linzell, J. L., and M. Peaker. 1975. Efficacy of measurement of electrical-conductivity of milk for detection of subclinical mastitis in cows—Detection of infected cows at a single visit. Br. Vet. J. 131:447–461. Little, T. W. A., C. N. Hebert, and D. Forbes. 1968. Electrical conductivity and leucocyte count of bovine milk. Vet. Rec. 82:431. Løvendahl, P., and M. G. G. Chagunda. 2010. On the use of physical activity monitoring for estrus detection in dairy cows. J. Dairy Sci. 93:249–259. Lukas, J. M., J. K. Reneau, R. Wallace, D. Hawkins, and C. MunozZanzi. 2009. A novel method of analyzing daily milk production and electrical conductivity to predict disease onset. J. Dairy Sci. 92:5964–5976. Maertens, W., J. Vangeyte, J. Baert, A. Jantuan, K. C. Mertens, S. De Campeneere, A. Pluk, G. Opsomer, S. Van Weyenberg, and A. Van Nuffel. 2011. Development of a real time cow gait tracking and analysing tool to assess lameness using a pressure sensitive walkway: The GAITWISE system. Biosystems Eng. 110:29–39. Martiskainen, P., M. Jarvinen, J. P. Skon, J. Tiirikainen, M. Kolehmainen, and J. Mononen. 2009. Cow behaviour pattern recognition using a three-dimensional accelerometer and support vector machines. Appl. Anim. Behav. Sci. 119:32–38. Mazeris, F. 2010. DeLaval Herd Navigator(R) proactive herd management. Pages 26–27 in Proc. First North Am. Conf. Precision Dairy Management, Toronto, Canada. Mazrier, H., S. Tal, E. Aizinbud, and U. Bargai. 2006. A field investigation of the use of the pedometer for the early detection of lameness in cattle. Can. Vet. J. Rev. Vet. Can. 47:883–886. Miekley, B., I. Traulsen, and J. Krieter. 2012. Detection of mastitis and lameness in dairy cows using wavelet analysis. Livest. Sci. 148:227–236. Miranda, N., R. Morais, M. Dias, C. Viegas, F. Silva, C. Serodio, J. Almeida, J. Azevedo, and M. C. Reis. 2009. Bioimplantable impedance and temperature monitor low power micro-system suitable for estrus detection. Pages 505–508 in Proc. Eurosensors XXIII Conf. Vol. 1. J. Brugger and D. Briand, ed. Elsevier Science BV, Amsterdam, the Netherlands.
Journal of Dairy Science Vol. 96 No. 4, 2013
1944
RUTTEN ET AL.
Mollenhorst, H., L. J. Rijkaart, and H. Hogeveen. 2012. Mastitis alert preferences of farmers milking with automatic milking systems. J. Dairy Sci. 95:2523–2530. Mollenhorst, H., P. P. J. van der Tol, and H. Hogeveen. 2010. Somatic cell count assessment at the quarter or cow milking level. J. Dairy Sci. 93:3358–3364. Mottram, T., and N. J. Bell. 2010. A novel method of monitoring mobility of dairy cows. Pages 182–183 in Proc. First North Am. Conf. Precision Dairy Management, Toronto, Canada. Muller, R., and L. Schrader. 2003. A new method to measure behavioural activity levels in dairy cows. Appl. Anim. Behav. Sci. 83:247–258. Neveux, S., D. M. Weary, J. Rushen, M. A. G. von Keyserlingk, and A. M. de Passille. 2006. Hoof discomfort changes how dairy cattle distribute their body weight. J. Dairy Sci. 89:2503–2509. Nielsen, L. R., A. R. Pedersen, M. S. Herskin, and L. Munksgaard. 2010. Quantifying walking and standing behaviour of dairy cows using a moving average based on output from an accelerometer. Appl. Anim. Behav. Sci. 127:12–19. Norberg, E. 2005. Electrical conductivity of milk as a phenotypic and genetic indicator of bovine mastitis: A review. Livest. Prod. Sci. 96:129–139. Norberg, E., H. Hogeveen, I. R. Korsgaard, N. C. Friggens, K. Sloth, and P. Løvendahl. 2004. Electrical conductivity of milk: Ability to predict mastitis status. J. Dairy Sci. 87:1099–1107. O’Connell, J., F. A. Togersen, N. C. Friggens, P. Løvendahl, and S. Højsgaard. 2011. Combining cattle activity and progesterone measurements using hidden semi-Markov models. J. Agric. Biol. Environ. Stat. 16:1–16. Ohtani, S., T. Wang, K. Nishimura, and M. Irie. 2005. Milk fat analysis by fiber-optic spectroscopy. Asian-australas. J. Anim. Sci. 18:580–583. Olynk, N. J., and C. A. Wolf. 2009. Stochastic economic analysis of dairy cattle artificial insemination reproductive management programs. J. Dairy Sci. 92:1290–1299. Østergaard, S., N. C. Friggens, and M. G. G. Chagunda. 2005. Technical and economic effects of an inline progesterone indicator in a dairy herd estimated by stochastic simulation. Theriogenology 64:819–843. Oude Lansink, A. G. J. M., J. Verstegen, and J. J. Van den Hengel. 2001. Investment decision making in Dutch greenhouse horticulture. Neth. J. Agric. Sci. 49:357–368. Palmer, M. A., G. Olmos, L. A. Boyle, and J. F. Mee. 2010. Estrus detection and estrus characteristics in housed and pastured HolsteinFriesian cows. Theriogenology 74:255–264. Pastell, M., L. Hanninen, A. M. de Passille, and J. Rushen. 2010. Measures of weight distribution of dairy cows to detect lameness and the presence of hoof lesions. J. Dairy Sci. 93:954–960. Pastell, M., M. Hautala, V. Poikalainen, J. Praks, I. Veermae, M. Kujala, and J. Ahokas. 2008a. Automatic observation of cow leg health using load sensors. Comput. Electron. Agric. 62:48–53. Pastell, M., M. Kujala, A. M. Aisla, M. Hautala, V. Poikalainen, J. Praks, I. Veermae, and J. Ahokas. 2008b. Detecting cow’s lameness using force sensors. Comput. Electron. Agric. 64:34–38. Pastell, M., and H. Madsen. 2008. Application of CUSUM charts to detect lameness in a milking robot. Expert Syst. Appl. 35:2032– 2040. Pastell, M., J. Tiusanen, M. Hakojarvi, and L. Hanninen. 2009. A wireless accelerometer system with wavelet analysis for assessing lameness in cattle. Biosystems Eng. 104:545–551. Pastell, M. E., and M. Kujala. 2007. A probabilistic neural network model for lameness detection. J. Dairy Sci. 90:2283–2292. Peralta, O. A., R. E. Pearson, and R. L. Nebel. 2005. Comparison of three estrus detection systems during summer in a large commercial dairy herd. Anim. Reprod. Sci. 87:59–72. Pinzón-Sánchez, C., V. E. Cabrera, and P. L. Ruegg. 2011. Decision tree analysis of treatment strategies for mild and moderate cases of clinical mastitis occurring in early lactation. J. Dairy Sci. 94:1873–1892. Pluk, A., C. Bahr, T. Leroy, A. Poursaberi, X. Song, E. Vranken, W. Maertens, A. Van Nuffel, and D. Berckmans. 2010. Evaluation of Journal of Dairy Science Vol. 96 No. 4, 2013
step overlap as an automatic measure in dairy cow locomotion. Trans. ASABE 53:1305–1312. Polat, B., A. Colak, M. Cengiz, L. E. Yanmaz, H. Oral, A. Bastan, S. Kaya, and A. Hayirli. 2010. Sensitivity and specificity of infrared thermography in detection of subclinical mastitis in dairy cows. J. Dairy Sci. 93:3525–3532. Poursaberi, A., C. Bahr, A. Pluk, A. Van Nuffel, and D. Berckmans. 2010. Real-time automatic lameness detection based on back posture extraction in dairy cattle: Shape analysis of cow with image processing techniques. Comput. Electron. Agric. 74:110–119. Rajkondawar, P. G., M. Liu, R. M. Dyer, N. K. Neerchal, U. Tasch, A. M. Lefcourt, B. Erez, and M. A. Varner. 2006. Comparison of models to identify lame cows based on gait and lesion scores, and limb movement variables. J. Dairy Sci. 89:4267–4275. Rajkondawar, P. G., U. Tasch, A. M. Lefcourt, B. Erez, R. M. Dyer, and M. A. Varner. 2002. A system for identifying lameness in dairy cattle. Appl. Eng. Agric. 18:87–96. Roelofs, J. B., F. van Eerdenburg, N. M. Soede, and B. Kemp. 2005. Pedometer readings for estrous detection and as predictor for time of ovulation in dairy cattle. Theriogenology 64:1690–1703. Rossing, W. 1999. Animal identification: Introduction and history. Comput. Electron. Agric. 24:1–4. Rossing, W., A. H. Ipema, and P. F. Veltman. 1985. Perspectieven voor het melken in een voerbox. Publikatie/Instituut voor Mechanisatie, Arbeid en Gebouwen; no. 207. Instituut voor Mechanisatie, Arbeid en Gebouwen, Wageningen, the Netherlands. Saint-Dizier, M., and S. Chastant-Maillard. 2011. Towards an automated detection of oestrus in dairy cattle. Reprod. Domest. Anim. 47:1056–1061. Sakaguchi, M., R. Fujiki, K. Yabuuchi, Y. Takahashi, and M. Aoki. 2007. Reliability of estrous detection in Holstein heifers using a radiotelemetric pedometer located on the neck or legs under different rearing conditions. J. Reprod. Dev. 53:819–828. Sananikone, K., M. J. Delwiche, R. H. BonDurant, and C. J. Munro. 2004. Quantitative lateral flow immunoassay for measuring progesterone in bovine milk. Trans. ASAE 47:1357–1365. Sato, S., H. Mizuguchi, K. Ito, K. Ikuta, A. Kimura, and K. Okada. 2012. Technical note: Development and testing of a radio transmission pH measurement system for continuous monitoring of ruminal pH in cows. Prev. Vet. Med. 103:274–279. Saumande, J. 2002. Electronic detection of oestrus in postpartum dairy cows: Efficiency and accuracy of the DEC (R) (showheat) system. Livest. Prod. Sci. 77:265–271. Scheibe, K. M., and C. Gromann. 2006. Application testing of a new three-dimensional acceleration measuring system with wireless data transfer (WAS) for behavior analysis. Behav. Res. Methods 38:427–433. Schön, P. C., K. Hamel, B. Puppe, A. Tuchscherer, W. Kanitz, and G. Manteuffel. 2007. Altered vocalization rate during the estrous cycle in dairy cattle. J. Dairy Sci. 90:202–206. Seegers, H., C. Fourichon, and F. Beaudeau. 2003. Production effects related to mastitis and mastitis economics in dairy cattle herds. Vet. Res. 34:475–491. Sloth, K. H., N. C. Friggens, P. Løvendahl, P. H. Andersen, J. Jensen, and K. L. Ingvartsen. 2003. Potential for improving description of bovine udder health status by combined analysis of milk parameters. J. Dairy Sci. 86:1221–1232. Song, X., and R. van der Tol. 2010. Automatic detection of clinical mastitis in Astronaut A3TM milking robot. Pages 154–155 in Proc. First North Am. Conf. Precision Dairy Management, Toronto, Canada. Song, X. Y., T. Leroy, E. Vranken, W. Maertens, B. Sonck, and D. Berckmans. 2008. Automatic detection of lameness in dairy cattle—Vision-based trackway analysis in cow’s locomotion. Comput. Electron. Agric. 64:39–44. Steeneveld, W., J. Swinkels, and H. Hogeveen. 2007. Stochastic modelling to assess economic effects of treatment of chronic subclinical mastitis caused by Streptococcus uberis. J. Dairy Res. 74:459–467. Steeneveld, W., L. C. van der Gaag, W. Ouweltjes, H. Mollenhorst, and H. Hogeveen. 2010. Discriminating between true-positive and
INVITED REVIEW: SENSORS FOR DAIRY HEALTH MANAGEMENT
false-positive clinical mastitis alerts from automatic milking systems. J. Dairy Sci. 93:2559–2568. Steeneveld, W., T. van Werven, H. W. Barkema, and H. Hogeveen. 2011. Cow-specific treatment of clinical mastitis: An economic approach. J. Dairy Sci. 94:174–188. Sun, Z., S. Samarasinghe, and J. Jago. 2010. Detection of mastitis and its stage of progression by automatic milking systems using artificial neural networks. J. Dairy Res. 77:168–175. Svennersten-Sjaunja, K. M., and G. Pettersson. 2008. Pros and cons of automatic milking in Europe. J. Anim. Sci. 86:37–46. Swinkels, J. M., H. Hogeveen, and R. N. Zadoks. 2005a. A partial budget model to estimate economic benefits of lactational treatment of subclinical Staphylococcus aureus mastitis. J. Dairy Sci. 88:4273–4287. Swinkels, J. M., J. G. Rooijendijk, R. N. Zadoks, and H. Hogeveen. 2005b. Use of partial budgeting to determine the economic benefits of antibiotic treatment of chronic subclinical mastitis caused by Streptococcus uberis or Streptococcus dysgalactiae. J. Dairy Res. 72:75–85. Tasch, U., and P. G. Rajkondawar. 2004. The development of a SoftSeparator (TM) for a lameness diagnostic system. Comput. Electron. Agric. 44:239–245. Tolkamp, B. J., M. J. Haskell, F. M. Langford, D. J. Roberts, and C. A. Morgan. 2010. Are cows more likely to lie down the longer they stand? Appl. Anim. Behav. Sci. 124:1–10. Tschmelak, J., N. Kappel, and G. Gauglitz. 2005. TIRF-based biosensor for sensitive detection of progesterone in milk based on ultrasensitive progesterone detection in water. Anal. Bioanal. Chem. 382:1895–1903. van Asseldonk, M., R. B. M. Huirne, A. A. Dijkhuizen, and A. J. M. Beulens. 1999a. Dynamic programming to determine optimum investments in information technology on dairy farms. Agric. Syst. 62:17–28. van Asseldonk, M., A. W. Jalvingh, R. B. M. Huirne, and A. A. Dijkhuizen. 1999b. Potential economic benefits from changes in management via information technology applications on Dutch dairy farms: A simulation study. Livest. Prod. Sci. 60:33–44.
1945
van den Borne, B. H. P., T. Halasa, G. van Schaik, H. Hogeveen, and M. Nielen. 2010. Bioeconomic modeling of lactational antimicrobial treatment of new bovine subclinical intramammary infections caused by contagious pathogens. J. Dairy Sci. 93:4034–4044. van der Tol, P. P. J., J. H. M. Metz, E. N. Noordhuizen-Stassen, W. Back, C. R. Braam, and W. A. Weijs. 2002. The pressure distribution under the bovine claw during square standing on a flat substrate. J. Dairy Sci. 85:1476–1481. van der Tol, P. P. J., J. H. M. Metz, E. N. Noordhuizen-Stassen, W. Back, C. R. Braam, and W. A. Weijs. 2003. The vertical ground reaction force and the pressure distribution on the claws of dairy cows while walking on a flat substrate. J. Dairy Sci. 86:2875–2883. van der Tol, R., and A. van der Kamp. 2010. Time series analysis of live weight as health indicator. Pages 230–231 in Proc. First North Am. Conf. Precision Dairy Management, Toronto, Canada. van Knegsel, A. T. M., H. van den Brand, J. Dijkstra, W. M. van Straalen, R. Jorritsma, S. Tamminga, and B. Kemp. 2007. Effect of glucogenic vs. lipogenic diets on energy balance, blood metabolites, and reproduction in primiparous and multiparous dairy cows in early lactation. J. Dairy Sci. 90:3397–3409. Vreeburg, N. 2010. Precision management on two Dutch dairy farms by use of Herd Navigator (R). Pages 104–105 in Proc. First North Am. Conf. Precision Dairy Management, Toronto, Canada. Welbeck, K., P. Leonard, N. Gilmartin, B. Byrne, C. Viguier, S. Arora, and R. O’Kennedy. 2011. Generation of an anti-NAGase single chain antibody and its application in a biosensor-based assay for the detection of NAGase in milk. J. Immunol. Methods 364:14–20. Williams, W. F., D. R. Yver, and T. S. Gross. 1981. Comparison of estrus detection techniques in dairy heifers. J. Dairy Sci. 64:1738– 1741. Wolfe, R. R., G. E. Ward, and S. C. Sharma. 1972. Method for electronic detection of bovine mastitis. Trans. ASAE 15:500. Zecconi, A., R. Piccinini, G. Giovannini, G. Casirani, and R. Panzeri. 2004. Clinical mastitis detection by on-line measurements of milk yield, electrical conductivity and milking duration in commercial dairy farms. Milchwissenschaft 59:240–243.
Journal of Dairy Science Vol. 96 No. 4, 2013
1946
Journal of Dairy Science Vol. 96 No. 4, 2013
APPENDIX Table A1. Characteristics of sensors for automated detection of mastitis in dairy cows Level I1
Level II2 Nonsensor
Output6
Se (%)
Sp (%)
T cases
V cases
Tested farms (cows)
No
Alert
75
18
—
—
1 (?)
T
Yes
Alert, Pr
?
?
?
?
1 (40)
? ?
FL NN MA MA MA Abs NN
V V V V V V T
Yes Yes No No No No Yes
83–92 78–84 85 84 88 68–86 —
75–94 51–75 73 73 67 ? —
+126/+1612/+620 ? ? ? ? — ?
+70/+736/+322 ? ? ? ? — ?
1 1 1 1 1 1 1
In-line, on-line In-line In-line
?
FA
V
No
?
?
1 (332)
V V
No No
? 808
? —
? ?
4 (112) 1 (194)
EC, CellSense Lukas et al., 2009 EC, milk yield Mollenhorst et al., 2010 AMS sensor
In-line, on-line In-line
RCM
Abs Abs, MA FL
+58 −71 ? —
—
SCC RCM
Alert, Pr Alert, Pr Alert Alert Alert Alert Class. NI min maj Degree of mastitis Alert Alert
V
No
CM likelihood 808
—
—
?
1 (194)
RCM
MA
V
Yes
Health alert
?
?
?
?
1 (587)
In-line, on-line
VJ, SCC
IQR, Abs
V
No
Alert
100
99
—
3 (191)
Norberg et al., 2004
EC
In-line
RCM
Reg
V
No
Class: He Su Cl
?
?
−797 +19 (EC) +9 (SCC) ?
?
1 (320)
Sloth et al., 2003
EC
In-line
RCM
Reg
T
No
?
—
—
—
(5 yr) 1 (322)
Sun et al., 2010
EC
In-line
VJ
NN
V
Yes
Alert, Pr
91
87
Zecconi et al., 2004
EC
In-line
OM
Reg
V
No
Alert
55–60
49
In-line
SCC
Abs
V
No
Alert
?
?
In-line
VJ
Reg
V
Yes
Alert, Pr
70
97.8
In-line
VJ
DTI
V
Yes
Pr mastitis
5–56
93–99
In-line
VJ
DTI
V
Yes
Pr mastitis
40–85
57–89
In-line
VJ
Cor
T
No
No
—
—
In-line
RCM
Abs
V
Yes
Alert
85
99
−520 +301 −2,265 +627 −1,249 +165 −1,249 +165 −339,011 +151 −305 +87 −24,717 +243 −2,962 +270 —
On-line
ELISA
Abs
A
No
No
—
—
Sensor
Location
GS3
Alg4
Miekley et al., 2012
EC
In-line
MA
Liberati and Zappavigna, Cavero et al., Cavero et al., Cavero et al.,
EC
In-line
RCM, SSC ?
FL
EC EC EC
In-line In-line In-line
SCC SCC SCC
EC ER
In-line In-line
Højsgaard and Friggens, EC 2010 Hovinen et al., 2006 EC Kamphuis et al., 2008b EC
2009 20067 2008 2007
Claycomb et al., 2009 Hassan et al., 2009
EC + Col Steeneveld et al., 2010 EC + Col Kamphuis et al., 2010a EC + Col Kamphuis et al., 2010b EC + Col Kamphuis et al., 2008a EC + Col9 Song and van der Tol, EC + 2010 Col Akerstedt et al., 2006 Optical biosensor
Val5
−43 +28
(478) (478) (160) (160) (160) (194) (111)
−970 +268 ?
1 (94)
?
4 (171)
−169,506 +76 −34 +10 −50,000 +105 —
1 (602)
1 (65)
+26
5 (649)
—
1 (?)
3 (850)
6 (838) 9 (1,109)
Continued
RUTTEN ET AL.
Source
Table A1 (Continued). Characteristics of sensors for automated detection of mastitis in dairy cows Level I1
Level II2 Tested farms (cows)
Location
GS3
Alg4
Val5
Nonsensor
Output6
Se (%)
Sp (%)
T cases
V cases
Chagunda et al., 2006b ?
On-line
?
Reg
V
Yes
82
99
—
CM5 chip Mazeris, 2010 HN Vreeburg, 2010 HN Kamphuis et al., 2008b CellSense
On-line
ELISA
No
A
No
—
—
—
−19,109 +492 —
1 (100)
Welbeck et al., 2011
RAM, RCM, DNM No
On-line On-line In-line
? ? Abs
A V V
Yes Yes No
RV RV Alert
80 82 83
— 98 —
— — —
— — ?
? 2 (286) 1 (194)
Bewley and Schutz, 2010
Reticulum
? ? SCC (Lab) ?
MA
T
Yes
No
—
—
−131,080 +101
—
1 (298)
Source
Sensor
1 Level I describes the sensor and its location in respect to the cow. EC = electrical conductivity; ER = electrical resistance; CellSense (Sensortec Ltd., Hamilton, New Zealand); AMS = automatic milking system; Col = milk color; CM5 chip (GE Healthcare, Uppsala, Sweden); HN = Herd Navigator (DeLaval, Tumba, Sweden); TB = temperature. 2 Level II describes data processing: gold standard (GS) and algorithm (Alg) used, the level of algorithm validation (Val), whether the algorithm used nonsensor data (yes or no), the sensitivity (Se) and specificity (Sp) of the algorithm, the numbers of GS positive (+) and negative (−) cases in the test (T cases) and validation (V cases) data sets, and the number of farms and cows tested; — = characteristic was not found in the publication; ? = description of the characteristic was unclear in the publication. 3 RCM = recorded cases of chronic mastitis; VJ = visual judgment; OM = observation by milker. 4 MA = moving average; FL = fuzzy logic; NN = neural network; Abs = absolute value; IQR = interquarter ratio; Reg = regression; DTI = decision tree induction; Cor = correlation; No = means no algorithm was used. 5 T = statistically tested relation between gold standard and sensor data; V = validated algorithm for detection; A = assumed relation between gold standard and sensor. 6 Pr = probability; Class: NI/min/maj = classification into no infection (NI) or minor (min) or major (maj) pathogen IMI; CM = clinical mastitis; Class: He/Su/Cl = classification into healthy/subclinical/clinical; RAM, RCM, DNM = risk of acute mastitis, risk of clinical mastitis, days to next sampling; RV = risk values. 7 In Cavero et al. (2006), 3 different mastitis definitions were used; T and V cases are given per definition. 8 Sensitivity was fixed in this study to determine the model with the lowest false alert rate. 9 Collection bin with electrical pins and light-emitting diodes.
1947
Journal of Dairy Science Vol. 96 No. 4, 2013
INVITED REVIEW: SENSORS FOR DAIRY HEALTH MANAGEMENT
TB
—
1948
Journal of Dairy Science Vol. 96 No. 4, 2013
Table A2. Characteristics of sensors for automated detection of estrus in dairy cows Level I1
Level II2
Sp (%)
T cases
V cases
Tested farms (cows)
Alert, Pr — Graph — Alert9 84 Alert —
— — 98 —
? — +98 —
+58 — ? —
1 1 1 3
No
Alert
—
—11
3 (98)
V V V V T
No Yes No No Yes
Alert, Pr 71–96 Alert, Pr 88 Alert 81 Alert 59 Alert, Pr ?
96–99 99 — — ?
— — ? —11 ?
−52 +43 — — ? +158 ?
Dev TS
T T
No No
Alert Alert
— —
— —
—
— —
ELISA ? SC SC ? ? [P4] [P4] [P4] [P4] [P4] [P4] [P4] ?
No No No No ? ? Dev Dev Dev Dev Dev Dev Dev FL
A A A A ? V V V V V V T V T
No No No No Yes Yes No No No No No No No Yes
No No No No RV RV Alert Alert Alert Alert Alert Alert Alert Alert, Pr
— — — — — 98–99 80–90 90–94 87–93 82–88 79–87 — 63 ?
— — — — — ? 98 90 93 95 96 — — ?
— — — — — — —11 —11 —11 —11 —11 —11 —11 ?
— — — — — — +141 +141 +141 +141 +141 ? +146 ?
1 (49) 1 (15 heifers) ? (1) — — ? 2 (286) 2 (199) 2 (199) 2 (199) 2 (199) 2 (199) 2 (246) 1 (67) 1 (40)
NC
SAI
Dev
V
No
Alert
?
?
?
?
1 (?)
Activity meter Activity meter
NC NC
RAI [P4]
? MA
A V
No No
Alert Alert
— 77
— 99
— —11
1 (1,075) 1 (635)
Activity meter
NC
[P4]
MA
V
No
Alert
62
99
—11
SW SW Activity meter Activity meter Activity meter Accelerometer
NC NC Leg Leg Leg Leg
? [P4] SAI SAI SAI No
? No GLR GLR GLR No
T A V V V A
No No No No No No
No Graph Alert Alert Alert No
— — 89 50 89 —
— — 99 100 100 —
— ? ? ? ? —
— −22,660 +835 −22,660 +835 — ? +18 +18 +18 —
1 1 1 1 1 1
2-Dimensional accelerometer HeatWatch
NC, Leg
MT
?
A
No
L/S
—
—
—
—
1 (6)
CS
[P4]
Dev
T
No
Alert
—
—
?
+95
1 (46)
3
Source
Sensor
Location
O’Connell et al., 2011 Brehme et al., 2008 Brunassi et al., 2010 Edwards and Tozer, 2004 Cavalieri et al., 2003a10
Pedometer ALT-pedometer Pedometer Pedometer
Firk et al., 2003b Firk et al., 2003a Cavalieri et al., 2003b10 Holman et al., 2011 Liberati and Zappavigna, 2009 Roelofs et al., 2005 Sakaguchi et al., 2007
Hockey et al., 2010b Holman et al., 2011 Liberati and Zappavigna, 2009 Løvendahl and Chagunda, 2010 Peralta et al., 2005 Kamphuis et al., 2012
Balzer et al., 2009 Kultus et al., 2011 Jonsson et al., 2011 Muller and Schrader, 2003 de Mol et al., 2009a Palmer et al., 2010
5
6
7
8
GS
Alg
Val
Nonsensor
Output
Leg Left Leg Leg
[P4] VO [P4] CP ?
Vit No FL No
T A V T
No No Yes No
Pedometer
Leg
[P4]
MA
V
Pedometer Pedometer Pedometer Pedometer Pedometer
Leg Leg Leg Leg Leg
SAI RAI [P4] [P4] ?
FL FL MA Dev FL
Pedometer Pedometer
Leg Leg NC
VO REO
Biosensor Biosensor Immunostrips RIANA biosensor HN HN Activity meter Activity meter Activity meter Activity meter Activity meter Activity meter Activity meter Activity meter
On-line ME On-line On-line On-line On-line On-line NC NC NC NC NC NC NC NC
Activity meter
Se (%)
81
+63
1 1 3 1 1
(58) (10) (98) (1,448)
(660) (373) (98) (67) (107)
1 (635) (?) (21) (18) (18) (18) (12)
Continued
RUTTEN ET AL.
Gillis et al., 2002 Kappel et al., 2007 Sananikone et al., 2004 Tschmelak et al., 2005 Mazeris, 2010 Vreeburg, 2010 Hockey et al., 2010a
4
Table A2 (Continued). Characteristics of sensors for automated detection of estrus in dairy cows Level I1
Level II2 Tested farms (cows)
Source
Sensor3
Location4
GS5
Alg6
Val7
Nonsensor
Output8
Se (%)
Sp (%)
T cases
V cases
Peralta et al., 2005 Cavalieri et al., 2003a10
HeatWatch HeatWatch
CS CR
RAI [P4]
? ?
A V
No No
Alert Alert
— 88
— —
— —11
Cavalieri et al., 2003b10 Cavalieri et al., 2003c10 Saumande, 2002 Alawneh et al., 2006
HeatWatch HeatWatch DEC system Video camera
CR CR CS ME
[P4] VO B[P4] SAI
? Reg ? ?
V T T V
No No No No
Alert Alert Alert Alert
88 —
— —
? ?
— −59 +43 ? ?
85
Schön et al., 2007
Microphone
NC
VO
Reg
T
No
?
—
—
—
— −11,257 +406 —
Miranda et al., 2009
Temperature transducer Temperature bolus
I
No
No
A
No
No
—
—
—
—
1 (10 heifers) (?)
Ret
?
MA
T
Yes
No
—
—
—
—
1 (298)
1
— 99
+96 —11
3 1 1 1
(?) (20) (30) (240)
Level I describes the sensor and its location (in the milking parlor) in respect to the cow. Level II describes data processing: gold standard (GS) and algorithm (Alg) used, the level of algorithm validation (Val), whether the algorithm used nonsensor data (yes or no), the sensitivity (Se) and specificity (Sp) of the algorithm, the numbers of GS positive (+) and negative (−) cases in the test (T cases) and validation (V cases) data sets, and the number of farms and cows tested; — = characteristic was not found in the publication; ? = description of the characteristic was unclear in the publication. 3 ALT = activity, laying time, and temperature; RIANA = river analyzer; HN = Herd Navigator (DeLaval, Tumba, Sweden); SW = SmartWatch (Institute of Stress Research GmBH, Berlin, Germany); HeatWatch (DDX Inc., Denver, CO); DEC system (IMV Technologies, L’Aigle, France). 4 NC = neck collar; ME = milking equipment; CS = cow sacrum; CR = cow rump; I = implant; Ret = reticulum. 5 [P4] = progesterone level; VO = visual observation; CP = confirmed pregnancy; SAI = successful AI; RAI = registered AI; REO = rectal examination of ovaries; SC = standard concentrations; MT = milking times; B[P4] = blood progesterone level. 6 Vit = Viterbi algorithm; FL = fuzzy logic; MA = moving average; Dev = absolute deviation from average or mean of previous time period; TS = time series; GLR = generalized likelihood ratio; Reg = regression. 7 T = statistically tested relation between gold standard and sensor data; A = assumed relation between gold standard and sensor; V = validated algorithm for detection. 8 Pr = probability; RV = risk values; L/S = lying or standing. 9 Alert categories: in estrus, maybe in estrus, and not in estrus. 10 Estrus synchronization before start of experiment with sensor. 11 An available algorithm was used; therefore, the test data set was not applicable. 2
1949
Journal of Dairy Science Vol. 96 No. 4, 2013
INVITED REVIEW: SENSORS FOR DAIRY HEALTH MANAGEMENT
Bewley and Schutz, 2010
—
1 (1,075) 3 (?)
1950
Journal of Dairy Science Vol. 96 No. 4, 2013
Table A3. Characteristics of sensors for automated detection of locomotion problems in dairy cows Level I1
Level II2
Sensor3
Location4
GS5
Alg6
Val7
Nonsensor
Output8 Se (%) Sp (%)
Chapinal et al., 2011
Leg, CT
Ga
Cor
T
No
?
—
—
—
—
1 (12)
Leg
T
No
Alert
—
—
—
—
2
Leg NC
Ga + CHE VO VO
Reg
Darr and Epperson, 2009 Martiskainen et al., 2009
3-Dimensional (3D) accelerometer 3D Accelerometer (IceTag3D) 3D Accelerometer 3D Accelerometer
No Reg
— V
No No
No — Alert, Pr 65
— —
— —
(3) 1 (30)
Pastell et al., 2009
3D Accelerometer
Leg
LS
Stat
T
No
Graphs
—
—
(11)
Scheibe and Gromann, 2006 3D Accelerometer
Leg, NC
?
No
A
No
Graphs
—
—
—
1 (4)
Nielsen et al., 2010
Leg
VO
No
—
No
No
—
—
−6 +6 −2 +2 —
— −94 +101 —
—
1 (10)
—
—
—
—
1
— — — — 39–56
— — — — 72–96
— — −2 +1 — ?
— — — — −503 +23 ?
2 1 (20) 1 (3) 1 (3) 28 (1,319) 1 (107)
Chapinal et al., 2011
3D Accelerometer (IceTag3D) 3D Accelerometer (IceTag3D) 3D Data loggers 3D Accelerometer 3D Accelerometer 3D Accelerometer Data loggers
Leg
No
No
—
No
Leg NC Leg Leg ?
VO VO ? VO9 Ga
No No MA Abs Reg
— A A A V
No No No No No
Graphs LF No Graph StC LB, SB Alert
Pedometer
Leg
?
FL
T
Yes
Alert, Pr ?
?
?
Leg Leg Leg FLA
T V T T
No No No No
Graph Alert ? Alert
? 50 — ?
? 80 — ?
— — — —
1 (12) 1 1 (16) 1
NN
V
No
Alert
100
57
—
No
?
?
1
Weighting platform Weighting platform
Fl Fl
A A V — — T
No No No — No No
? — 51–74 85 — —
? — 94–99 77 — —
— — ? — — ?
— — ? — — ?
1 1 1 (191) 1 (12) 1
Neveux et al., 2006
Weighting platform
Fl
No
A
No
No
—
—
—
—
1
Pastell et al., 2010
Weighting platform
Fl
Reg
T
No
Ga
—
—
—10
—
1
Rajkondawar et al., 2006 Rajkondawar et al., 2002 Tasch and Rajkondawar, 2004 van der Tol et al., 2002
Two parallel force plates Two parallel force plates Two parallel force plates
Fl Fl Fl
No Ga, CHE Ga, HT Ga, HT GLV EV ?
Abs MA MA No Reg
Drift in data Graphs Graphs Alert — Graph Alert
−36 +9 —
1
CU
+38 — — −211 +104 −36 +9 —
FLA FLA FLA
CHE Tr ? LS, HT LS, HT VO, HT VO LS EV
Abs CU Cor Stat
Pastell et al., 2008a Pastell et al., 2008b van der Tol and van der Kamp, 2010 Chapinal et al., 2009 Chapinal et al., 2010
Pedometer Pedometer Pedometer Four balance weighting floor Four balance system (4 plates) Four balance weighting floor Four strain gauge balances Four strain gauge balances Weighting floor
Reg No No
V A A
No No No
Ga, Pr Graph Graphs
? — —
? — —
— ? ?
— ? —
1 (6) ?
Pressure distribution plate
Fl
No
No
—
No
Images
—
—
—
—
(8)
Tolkamp et al., 2010 Ledgerwood et al., 2010 Mottram and Bell, 2010 de Mol et al., 2009b de Mol et al., 2011 Ito et al., 2010 Liberati and Zappavigna, 2009 Mazrier et al., 2006 Miekley et al., 2012 Higginson et al., 2010 Kujala et al., 2008 Pastell and Kujala, 2007 Pastell and Madsen, 2008
FLA FLA
Continued
RUTTEN ET AL.
Source
Tested farms T cases V cases (cows)
Table A3 (Continued). Characteristics of sensors for automated detection of locomotion problems in dairy cows Level I1
Level II2
Sensor3
Location4
GS5
Alg6
Val7
Nonsensor
Output8 Se (%) Sp (%)
van der Tol et al., 2003
Fl
No
No
—
No
Images
—
—
—
—
(9)
Pastell et al., 2008b Maertens et al., 2011 Pluk et al., 2010
Pressure distribution plate and a force plate Electromagnetic film Pressure sensitive mat Video camera
? Fl NTC
LS Ga LS
Abs Reg Stat
A V T
No No No
Graphs Ga ?
— 76–90 —
— 86–100 —
— —11 —
1 1 (12) 2 (79)
Poursaberi et al., 2010
Video camera
NTC
SLI
Reg
V
No
Ga
100
97.6
— — −12 +3 —
1 (94)
Song et al., 2008 Liberati and Zappavigna, 2009
Video camera Activometers
NTC NC
LS ?
No FL
A T
No Yes
Graph — Alert, Pr ?
— ?
—12 ?
−130 +54 — ?
1
(15) 1 (40)
Level I describes the sensor and its location (in the milking parlor) in respect to the cow. Level II describes data processing: gold standard (GS) and algorithm (Alg) used, the level of algorithm validation (Val), whether the algorithm used nonsensor data (yes or no), the sensitivity (Se) and specificity (Sp) of the algorithm, the numbers of GS positive (+) and negative (−) cases in the test (T cases) and validation (V cases) data sets, and the number of farms and cows tested; — = characteristic was not found in the publication; ? = description of the characteristic was unclear in the publication. 3 IceTag3D (IceRobotics, South Queensferry, UK). 4 CT = cow torso; NC = neck collar; FLA = floor AMS (automatic milking system); Fl = floor/passageway; NTC = next to corridor. 5 Ga = gait score; CHE = clinical hoof examination; VO = visual observation; LS = locomotion score; Tr = treatment; HT = hoof trimming; EV = examination by veterinarian; GLV = gait and lesion scoring by veterinarian; SLI = scoring of lameness indicators. 6 Cor = correlation; Reg = regression; Stat = statistical test; MA = moving average; Abs = absolute value; FL = fuzzy logic; CU = cumulative sum control chart; NN = neural network. 7 T = statistically tested relation between gold standard and sensor data; V = validated algorithm for detection; A = assumed relation between gold standard and sensor. 8 Pr = probability; LF = lying frequency; StC = step count; LB = lying bout; SB = standing bout; Ga = gait score. 9 Visual judgment of video recordings. 10 Number of gold standard cases for gait score 2: 11, for gait score 2.5: 9, for gait score 3: 23, for gait score 3.5: 7, for gait score 4: 5. 11 Number of gold standard cases for gait score 1: 54, for gait score 2: 55, for gait score 3: 50. 12 Number of gold standard cases for gait score 1: 4, for gait score 2: 8, for gait score 3: 1, for gait score 4: 2. 2
1951
Journal of Dairy Science Vol. 96 No. 4, 2013
INVITED REVIEW: SENSORS FOR DAIRY HEALTH MANAGEMENT
Source
Tested farms T cases V cases (cows)
1952
Journal of Dairy Science Vol. 96 No. 4, 2013
Table A4. Characteristics of sensors for automated detection of metabolic problems in dairy cows Level I1
Source
Sensor3
AlZahal et al., 2011 AlZahal et al., 2009 Ipema et al., 20089 AlZahal et al., 2007a AlZahal et al., 2007b AlZahal et al., 2009 Sato et al., 2012
Electrode Telemetric bolus Temperature sensor ? pH electrode pH electrode Glass electrode
Goense et al., 20099 Gasteiner et al., 2009
pH electrode pH electrode
Ohtani et al., 2005
Level II2
Location4
GS5
Alg6
Val7
Nonsensor
Output8
Se (%)
Sp (%)
T cases
Tested farms (cows)
V cases
VT No No ? No No RFS
Stat No No Reg No No Cor
T A — V A A A
No No No No No No No
No No No —10 No No No
— — — ? — — —
— — — ? — — —
— — — — — — —
— — — — — — —
1 1 1 1 1 1 1
No SPS
No Stat
— A
No No
No No
— —
— —
— —
— —
In-line
ORM
Reg
T
Yes
F%
—
—
—
—
AlZahal et al., 2009 de Roos et al., 2007
Fiber optic spectrophotmeter Telemetric bolus Infrared spectroscopy
? 1 (5 steers) ? (92)
Rumen On-line11
No CA
No Cor
A V
No No
No Alert
— 70
— 95
— ?
Mazeris, 2010 Vreeburg, 2010 Bar and Solomon, 2010 Halachmi et al., 2009 Edwards and Tozer, 2004
HN HN Rumination sensor TCM Pedometer
On-line On-line NC APW Leg
? ? VO VO, US JV
? ? Reg Stat ?
? V T T T
Yes Yes No No Yes
RV RV No BCS ?
— ? — — —
— ? — — —
— — — — −947 +498
— −1,724 +356 — — — — —
1 (4) 217 (1,085) ? 2 (286) 1 (75) 1 (186) 3 (1,445)
1
(8) (4) (1) (?) (1) (4) (4)
Level I describes the sensor and its location in respect to the cow. Level II describes data processing: gold standard (GS) and algorithm (Alg) used, the level of algorithm validation (Val), whether the algorithm used nonsensor data (yes or no), the sensitivity (Se) and specificity (Sp) of the algorithm, the numbers of GS positive (+) and negative (−) cases in the test (T cases) and validation (V cases) data sets, and the number of farms and cows tested; — = characteristic was not found in the publication; ? = description of the characteristic was unclear in the publication. 3 HN = Herd Navigator (DeLaval, Tumba, Sweden); TCM = thermal camera with MatLab (MathWorks Inc., Natick, MA) automated image analysis 4 RF = rumen fistulated; NC = neck collar; APW = above passageway after milking parlor. 5 VT = vaginal temperature; RFS = rumen fluid spot sampling, hand-held pH meter; SPS = standard pH solutions; ORM = official reference method in Japan; CA = chemical analysis; VO = visual observation; US = ultrasound (tissue thickness); JV = judgment of veterinarian. 6 Stat = statistical test; Reg = regression; Cor = correlation. 7 T = statistically tested relation between gold standard and sensor data; A = assumed relation between gold standard and sensor; V = validated algorithm for detection. 8 F% = fat percentage; RV = risk values. 9 Test of technical feasibility of measuring pH in-cow. 10 Accumulated time below pH cut of points. 11 In-line may be possible in the future. 2
RUTTEN ET AL.
RF Rumen Rumen Rumen RF RF Rumen (bolus) Rumen Rumen