IR Evaluation Using Multiple Assessors per Topic Andrew Trotman Department of Computer Science University of Otago Dunedin, New Zealand
[email protected] Abstract: Information retrieval test sets consist of three parts: documents, topics, and assessments. Assessments are time-consuming to generate. Even using pooling it took about 7 hours per topic to assess for INEX 2006. Traditionally the assessment of a single topic is performed by a single human. Herein we examine the consequences of using multiple assessors per topic. A set of 15 topics were used. The mean topic pool contained 98 documents. Between 3 and 5 separate assessors (per topic) assessed all documents in a pool. One assessor was designated baseline. All were then used to generate 10,000 synthetic multi-assessor assessment sets. The baseline relative rank order of all runs submitted to the INEX 2006 relevant-in-context task was compared to those of the synthetics. The mean Spearman’s rank correlation coefficient was 0.986 and all coefficients were above 0.95 – the correlation is very strong. Non matching rank-orders are seen when the mean average precision difference between runs is less than 0.05. In the top 10 runs no significantly different runs were ranked in a different order in more than 5% of the synthetics. Using multiple assessors per topic is very unlikely to affect the outcome of an evaluation forum. Keywords: Information Retrieval.
1. Introduction Information retrieval evaluation forms such as TREC [12] and INEX [2] are large international collaborations aiming to improve the performance of search engines. Each year they release a document collection and a set of information needs called topics. Participants index the documents, run the queries, and submit the results (called runs) back to the forum. The accuracy of each run is then measured by comparing the results lists against the known correct answers for each topic. These known correct answers are called assessments (or judgments). Producing the assessments is expensive and timeconsuming. At TREC the assessors are retired information specialists who are paid to perform the task. At Proceedings of the 12th Australasian Document Computing Symposium, Melbourne, Australia, December 10, 2007. Copyright of this article remains with the authors.
Dylan Jenkinson Department of Computer Science University of Otago Dunedin, New Zealand
[email protected] INEX the assessors are the participants themselves who must perform the task in addition to their ordinary duties. In both cases a human must decide which documents (and additionally at INEX which parts of those documents) are relevant to which topics and which are not. The test collections, however, are so large that it is not feasible to judge every document against every topic. TREC introduced the pooling method of reducing the assessment load. In TREC pooling the (typically 100) top ranking documents from each run are pooled. The pool is then de-duplicated and the pool documents are judged. Those documents that do not appear in the pool are not judged and are assumed to be nonrelevant. INEX uses a similar pooling method, but targets a pool size of (currently) 500 documents, but the number of results that end up in the pool varies from topic to topic. INEX imposes an additional rule – wherever possible a topic should be judged by the topic author. Even if this is not possible it should be judged by a single judge. In 2006 these assessors took an average of 7 hours per topic, and some were asked to assess as many as 3 topics. Assessment is a burden and consequently several others have investigated methods of reducing the load. Ogilvie & Lalmas [3], for example, show that for INEX using binary relevance is as effective as graded relevance. Piwowarski et al. [6] show that when identifying relevant parts of a document a yellow highlighting method is more effective than identifying the relevance of each individual XML element. Anecdotes suggest that changes over the last 5 years have reduced the assessment load from about a week per topic to about a day per topic. We are interested in further reducing the assessment load. To do this we propose relaxing the requirement that the assessment is by a single assessor (and consequently the topic author). If we are able to do so then an individual topic might be assessed by a group of 7 graduate students over a one hour period. Assessment might even be used as a teaching exercise. A double-judging experiment was run as part of INEX 2006 in which 15 topics were judged by two assessors each without the knowledge of the other. Trotman et al. [11] ran a further assessment experiment on these topics resulting in between 3 and 5 assessors for a mean of about 100 documents per topic. They examined the effect of shallow pooling (100 vs.
500 documents per pool) and showed that the shallow pools were effective in giving an indication of the performance of a run but not for distinguishing the performance of the top 10 runs. Their result does suggest that using an assessor other than the original topic author is likely to be effective. They measure the performance of each run against the official assessments and correlate it with an alternative set they produced. The correlation is very strong (Spearman’s of 0.97) except for the top 10 runs which do not correlate. The reason for the noncorrelation is likely to be the pool size difference of 500 documents in the official assessments and 100 in theirs. Trotman et al. [11] mix the official, the alternative, and their assessment sets and produce a set of between 3 and 5 separate assessments sets for a mean of 98 documents for the 15 topics. We use that set in our experiments. We first generate the mean average precision for each run submitted to the INEX 2006 relevant-incontext task against the official runs in the Trotman et al. subset. The relative rank order of the runs is generated from the mean average precisions. From the whole subset we generate 10,000 synthetic assessment sets by randomly choosing one of the assessors decisions for each document of each topic. These sets are representative of different random ways of distributing documents to different assessors for assessment – and the combination of results that might be seen. The mean average precision is then computed for each of the 10,000 sets and the relative rank order of runs is compared to the official rank order using Spearman’s correlation. We note a mean correlation score of 0.986, that is, the relative rank orders very strongly correlate. No substantial difference would have been seen if multiple assessors had been used per topic. Further we examine the mean average precision difference between two runs at which we would expect to see a difference between the official assessments and those of multiple assessors. For each possible pair of runs (A and B) we compute the difference in mean average precision. From the 10,000 synthetic runs we note the number of times the relative rank order of A and B is different to that seen with the official runs. We bucket this into mean average precision differences of 0.01 and fit a line to it. We note the point at which the probability of a switch is less than 0.05 (which we consider statistically significant) is between 0.02 and 0.03. Since the best MAP score seen is 0.36, this is representative of an approximately 7% increase in mean average precision. We believe that anything smaller is not interesting anyway; Voorhees & Buckley [13] suggest a MAP increase of 0.05 (15% at 0.3) is needed for there to be a meaningful difference between runs.
2. The INEX Evaluation Forum The details of how a test set is constructed differs between evaluation forum. INEX currently uses a dump of the Wikipedia subsequently converted into XML [1]. The collection is distributed to participants who are then asked to identify typical information needs they have of the collection. These needs are expressed in written paragraph form along with the reason the information is needed. This expression of the information need is referred to as the narrative. Users do not typically type their information need into a search engine as paragraphs of text. The average length of a web query is between 2 and 3 words [8] and not a long explanation of information needed. These web queries are derivatives of the user’s information need, and there are many possible such queries a user might give. Specifically INEX identifies two kinds of queries: Content Only (CO) queries, and Content and Structure (CAS) queries. The former is the typical keyword only query seen by a web search engine; the latter additionally includes structural constraints identifying which document structures (sections, paragraphs, etc.) are likely to contain relevant instances of the keywords and the preferred granularity of the search result. Along with the narrative participants are asked to submit a CO query and, if applicable, a CAS query too. Upon receiving a set of topics a participant extracts the queries and runs them through their search engines producing a set of results per topic. INEX is investigating the evaluation of search engines that identify results smaller in size than a whole document. In 2006 four tasks were identified: thorough, focused, relevant-in-context, and best-incontext. In the thorough task the search engine must identify relevant XML-elements from relevant documents and rank them relative to each other. The focused task, by contrast, must do the same but without identifying overlapping results. For the relevant-in-context task the search engine must first identify and rank relevant documents, then it must identify all relevant XML-elements within those documents (unordered, non-overlapping). The best-in-context task, by contrast, must identify the “best” point, in each relevant document, from which a user should start reading in order to satisfy their information need. Each of these tasks was examined by Trotman et al. [10] in an effort to identify a user base. They gave a use-case for each but concluded that the relevant-incontext task was the most viable. This task is, consequently, of interest to us. An obvious use of the relevant-in-context paradigm is searching collections of long documents such as a library of books. Relevant books would first be identified then relevant parts (XML-elements or passages) within those books would be highlighted. In 2007 INEX initiated a book searching track using
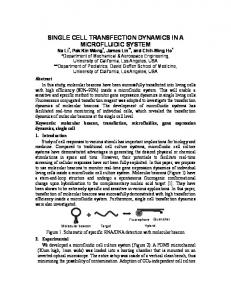
42,049 books totalling 210GB of text – the results have not yet been published. For the relevant-in-context task a result for a single topic is a set of 1,500 elements grouped together by document. A run is a set of results, one for each of a set of topics. These runs are then submitted to INEX for evaluation. A perfect run would identify only relevant documents and within those documents only relevant passages. Pehcevski et al. [5] state that “Users want to see as much relevant information as possible with as little irrelevant information as possible”. Any metric used to score a search engine is giving a measure of this, typically weighted so that the beginning of a result list is over-weighted while the end is under-weighted. But in order to evaluate a run the correct answers to the query must be known (so that a run can be compared to it) and producing the answers is expensive and time consuming. INEX topics are assessed by their original author (where possible), that is, the participants. Assessment is in addition to their ordinary duties which can include teaching and research. In 2006 each group was asked to assess three topics. If all three were assessed by the same individual the total load was about 5 days. Methods of reducing the assessment burden are, consequently, of interest. Several methods of reducing the assessment load are already being used at INEX. Topics are not assessed to exhaustion; instead a pooling strategy called top-n is used. In top-n pooling the first result from each run is added to a pool. The pool is then de-duplicated and if it contains more than n (in 2006 n=500) documents (not elements) then the pool is full. If not then the second result is taken from each run, the pools is again de-duplicated, and checked for exceeding n. The process continues in this way until at least n documents are in the pool or no more documents can be selected. Just those documents in the pool are assessed by a human. The validity of pooling at TREC has been studied extensively [14] in short, it is sound (however we accept that INEX pooling is subtly different). Identifying the relevance within a document is done using a yellow highlighting method as shown in Figure 1. Documents from the pool are presented to the assessor who identifies relevant passages. Relevant documents must contain a relevant passage. The crossover between the relevant passages and XMLelements in a run is used to measure performance (precision and recall). Even using pooling and yellow highlighting, the mean time to judge a topic at INEX 2006 was 6:51:00, nearly seven hours. It took 1:02, just over a minute, per relevant document and 44 seconds per irrelevant document [6]. We believe there remains further room for improvement in the time to assess – particularly by moving away from the model that the topic should be assessed by the original topic author. Others have al-
ready analysed the agreement level between multiple assessors [4; 9] and they are inline with those of TREC and it does appear valid to assess with a different assessor than the topic author. A further move away from using the original topic assessor is to use more than one assessor per topic. The pool might be split in half and two assessors asked to assess half the pool each. Further, a pool might be split into seven pieces and seven students each asked to spend one hour assessing. If this were possible assessing might additionally be used as a teaching exercise. Before embracing such a change it is essential to test the validity of it. We do this by synthetically generating runs assessed by multiple assessors and comparing the result to that seen when only one assessor is used.
Figure 1: Yellow Highlighting Assessment.
3. Experimental Equipment 3.1. INEX Topics and Assessments At INEX 2006 there were 125 topics. Of those 15 were assessed by two separate assessors neither of which was aware that topics were being assessed by someone else. Clearly in each case at least one of the assessors was not the topic author. During a session at the INEX 2006 workshop an experiment was run in which some documents from those 15 topics were assessed by further assessors [11]. A new pool was generated by applying the top-n pooling strategy with n set to 100. For reasons outlined elsewhere [11] this second pool was not a complete subset of the original, however the mean crossover was 98%. Not all the assessors completed the assessment task due to the time constraint (of about an hour and a half). Trotman et al. [11] generated, from both experiments, a set of assessments for the 15 topics consisting of between 3 and 5 assessors for each topic. To get into their set an assessor was required to complete at least half the assessment task. Additionally all assessments on documents not assessed by all assessors in their set were discarded. The details are given in
Table 1 where it can be seen that, for example, topic 310 had four assessors (two of which were at the workshop) who all assessed the same 91 documents, they disagreed on the relevance of 17 of those. Each assessor may have assessed additional documents but those documents are not included. Trotman et al. [11] report on the cross-assessor agreement levels in this data and report that as assessors are added the intersection decreases while the union continues to increase. Runs submitted to INEX 2006 were scored against one set of assessments known as the official set. Those generated by the second assessor are known as the alternate set. Those generated at the workshop are known as the Dagstuhl set. We use the designation baseline to refer to the 15 topic subset of assessments that was used for scoring at INEX, but only for those documents that are included in Table 1. Table 1: For each INEX topic the number of assessed documents, the number of assessors for that topic, and the number of documents for which there is disagreement over the relevance. Topic Docs Assessors Disagreement 304 135 3 19 310 91 4 17 314 130 4 26 319 78 4 19 321 132 3 8 327 78 5 7 329 86 5 13 355 83 3 9 364 56 5 17 385 87 4 5 403 113 4 16 404 104 4 30 405 99 4 3 406 67 5 25 407 132 3 7 Total 1,471 60 221
3.2. Metrics INEX measures the performance of a relevant-incontext run using mean average generalized precision (MAgP)[5]. This metric was introduced for the first time in 2006. As the metric is new, it is not yet clear whether or not there is any inherent bias in the metric. We, instead, use mean un-interpolated average precision (MAP) as that metric is well understood and it makes our result generalizable to other evaluation forums. It should be noted that in the absence of element or passage results within a document MAgP reduces to MAP. The INEX test set was used because we are unaware of any others for which there are more than 3 assessors per topic. Mean un-interpolated average precision is defined as the mean, over a number of topics, of the average precision of each topic. The average precision for a
topic is defined as the precision of each relevant document taken at each relevant document in the results list, divided by the number of known relevant documents. Precision, in turn, is defined as the number of relevant documents at and before a relevant document in the results list divided by the rank position of the document in the results list. All un-assessed documents are assumed to be nonrelevant. All assessed document containing any relevant content are considered relevant (see Section 2).
3.3. Runs There were 64 runs submitted to the INEX 2006 relevant-in-context task. The elements were discarded, and identical consecutive documents conflated resulting in a relative rank ordering of documents for each of the 15 topics. We do not concern ourselves with how those runs were generated or whether CO or CAS queries were used.
3.4. Simulated Assessment Sets For each topic, the number of documents for which the assessors are not unanimous is shown in Table 1. It ranges from 3 to 30. Examining topic 405 there were 4 separate assessors who each assessed the same 99 documents. Of those they agree on the relevance of 96 and disagree on the relevance of 3. If the assessment for topic 405 had been split between the assessors then the relevance of any given document would be determined by the decision of any one of the assessors. The relevance of the documents for which all the assessors agree would not change, but for the 3 documents it would depend on who assessed these documents. There are 64 different ways these contentious documents might have been distributed between the different assessors, however as each document can be either relevant or not relevant there are only 8, 2 3 , different possible outcomes. In total there are 221 documents for which the relevance is under dispute giving 2 221 , 3 *10 66 , different possible sets of assessments that could be drawn from the data. It is not practical to generate all these different combinations. Instead we choose to randomly sample the space to generate a large subset of them. We fully appreciate that for some topics every possible set of assessments is represented many times, but in combination with other topics, it is highly unlikely that our method will result in a duplicate. The probability that document d is relevant to a given topic t is Pt(r|d) and defined as
Pt (r | d ) =
Nr N
(1)
Where N is the number of assessors that assessed the document and Nr is the number of those assessors who consider the document relevant. If all assessors
4. Experiments We conducted three experiments to investigate the effect of using multiple assessors per topic. In the first we correlate the performance using the baseline assessments to that of the 10,000 synthetic assessments. In the second we identify the difference in MAP at which using multiple assessors has a significant effect on relative system performance. Finally, in the third experiment we examine the top 10 runs submitted to the INEX 2006 relevant-in-context task and look for differences that would be identified using synthetic assessments and check whether those differences are statistically significant.
puted and recorded. The relative rank order was generated and recorded. Then, using Spearman’s rank correlation, the correlation between the baseline rank order and each of the 10,000 synthetic rank orders was generated and recorded. Finally, the mean of the correlation coefficients was computed and recorded. Distribution of Spearman's Correlation 0.8 0.7 0.6 Proportion
agree a given document is relevant then Pt(r|d) = 1, if they all agree the document is not relevant then Pt(r|d) = 0, otherwise it is the proportion of assessors that considered the document relevant. Including the baseline assessor (as we do) is synonymous with that assessor getting help from the others. An alternative is to exclude the baseline which is synonymous with that assessor subcontracting the others. With the small number of available assessors it is not practical to test this latter case. A synthetic document assessment for document d (for a single topic, t) is generated by choosing a random number p the range [0,1) and then comparing it to Pt(r|d). If p < Pt(r|d) then the document is set to relevant, otherwise it is set to non-relevant. This is a random selection of an assessor (with replacement). A synthetic topic assessment is generated by generating a synthetic assessment for each document assessed for that topic. For topic 405, that is 99 synthetic document assessments are needed. Likewise, a set of assessments is generated for all documents of all topics forming a synthetic assessment set. Note that a document can both be relevant to one topic and not relevant to another in the same assessment set, but must be either relevant or not relevant with respect to a single topic. There are alternative methods of generating synthetic assessment sets; however we believe they are equivalent.
0.5 0.4 0.3 0.2 0.1 0 0.95
0.96
0.97
0.98
0.99
Spearman's Correlation
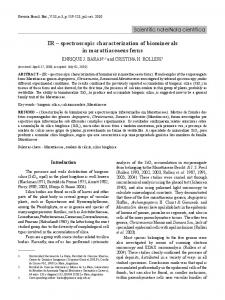
Figure 2: Distribution of the 10,000 Spearman’s correlation coefficients. Each measures the correlation between the baseline and a single synthetic assessment.
4.2. Results 1 The 10,000 Spearman’s rank correlation coefficients were bucketed into buckets of size 0.01 and are plotted in Figure 2. A correlation coefficient of 1 occurs when there is complete agreement in relative rank orders. A coefficient of -1 is seen in perfect disagreement. A coefficient of 0 occurs when there is no correlation (the ranks are independent of each other). Of the 10,000 correlations, 7,245 (72%) lie in the range [0.98-0.99). All 10,000 fall above 0.95, and 89% fall above 0.98. The mean correlation coefficient was 0.986. There is a very strong (near perfect) correlation between the relative rank order seen using a single assessor and that which would have been seen using multiple assessors. From this it is reasonable to conclude that if multiple assessors had been used there would not have been a measurably real difference in the result of the relevant-in-context task at INEX 2006.
4.1. Experiment 1 The aim of this experiment was to determine if a measurably real difference exists between the relative rank order produced using one assessor and that of using multiple assessors. That is, would there have been a different result if multiple assessors had been used? First, using the baseline assessment set, the mean average precision of every run submitted to the INEX 2006 relevant-in-context task was measured. From this the relative rank order of the runs was generated and recorded. Next, for each of the 10,000 synthetic assessment sets the mean average precision for each run was com-
4.3. Experiment 2 The aim of this experiment was to identify whether the difference between the mean average precision scores of two runs was plausibly real. The methodology is similar to that of Voorhees & Buckley [13] who generated assessment sets by splitting a single set of assessments into multiple groups for a similar purpose. Our experiment differs from theirs in so far as we use multiple synthetic assessment sets and compare to a baseline. First the relative rank order of all the runs was generated against the baseline assessments (as outlined in Experiment 1). Then for all possible pairs of
4.4. Results 2
Switch Probability 1 0.9 Switch Probability
0.8 0.7 0.6 0.5 0.4 0.3 0.2 0.1 0 0.05
0.4 0.35 0.3 0.25 0.2 0.15 0.1 0.05
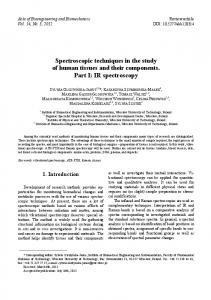
We define a significant difference as a greater than 5% chance of a relative rank order switch compared to the baseline. Figure 3 shows, for each run pair, the probability, when multiple assessors are used, of seeing a different outcome than when the baseline assessor was used. Scores vary from 0.00 to 0.99. Figure 4 shows the same result as Figure 3, but grouped into buckets representing differences from baseline mean average precision of 0.01. The probability of a switch in relative rank order decreases as the difference in mean average precision increases. This result is as expected because runs that vary very little are far more sensitive to small changes than those that vary a great deal. The figures show that when the difference in mean average precision is greater than 0.05 there is essentially no chance of a switch. Voorhees & Buckley [13] suggest that a difference in mean average precision of less than 0.05 is insufficient to conclude that a difference is meaningful. In our experiments the probability of getting a different result when mean average precision scores differ by more than 0.05 is essentially zero. From this it is reasonable to conclude that if multiple assessors had been used there would not have been a material difference in the result of the relevant-incontext task at INEX 2006. Any differences that would have been seen would only have occurred where runs were not significantly different anyway.
0
Switch Probability(Bucketed)
Switch Probability
runs, the difference in mean average precision was computed and recorded. Next, for each of the 10,000 synthetic assessment sets, the relative rank order of the two runs was computed and compared to the baseline order. The number of times a switch was seen was recorded.
0.1
0.15
0.2
0.25
0.3
0.35
0.4
MAP Difference
Figure 3: For all possible pairs of runs submitted to the INEX 2006 relevant-in-context task, the probability of a switch in relative rank order from the baseline rank order.
0 0
0.05
0.1
0.15
0.2
0.25
0.3
0.35
0.4
MAP Difference
Figure 4: The results in Figure 3 bucketed into differences of 0.01.
4.5. Experiment 3 Of particular interest in collaborative information retrieval evaluation forums is the performance of the top 10 systems. Far more can be learned by examining what is happening there than by examining the worst 10 runs. The aim of experiment 3 is to determine whether or not a different outcome in the INEX 2006 relevantin-context task would have been seen if multiple assessors had been used instead of a single assessor. All runs were ranked using the baseline assessment set and then Experiment 2 was repeated using only the runs that ranked in the top 10. Additionally, all pairs of runs that showed a probability of switching of greater than 5% were identified. Then, for each of those pairs of runs the average precision of each run was measured and recorded for each topic. Finally, a two-tailed t-test was performed on the average precisions (of 15 topics) to identify whether or not there was a statistically significant difference between the pairs of runs. The t-test was chosen because it is believed to be the most appropriate measure of significance [7]. We expect all pairs of runs showing a greater than 5% chance of switching order to have no significant difference in performance as measured by the t-test. If, for example, two runs differ by only one document, and one run considers that document relevant and the other not, then the better run is simply a function of whether or not that document is considered relevant in a synthetic assessment set. If exactly half the assessors consider the document relevant then the probability of a switch is expected to be 0.50, but there is no significant difference between the runs.
4.6. Results 3
Top 10 Runs 0.9
Switch Probability
0.8 0.7 0.6 0.5 0.4 0.3 0.2 0.1 0 0
0.02
0.04
0.06
0.08
0.1
0.12
0.14
MAP Difference
Figure 5: Observed chance of a switch in relative performance of the top 10 runs submitted to INEX 2006 relevant-in-context task.
Table 2: Two-tailed t-test p value for all pairs of runs showing a greater than 5% chance of switching relative rank order when multiple assessors are used. Run-codes have been used; see Table 3 for the run names. Run A Run B p 41-A 40-A 0.82 40-C 41-A 0.85 40-B 41-A 0.85 19-A 16-A 0.94 19-A 16-B 0.63 16-C 40-C 1.00 16-C 40-B 1.00 16-C 41-A 0.88 16-C 40-A 0.71 16-A 16-B 0.61
Table 3: Names of INEX 2006 relevant-in-context runs. Codes are used in Table 2 for clarity. Code Group INEX run name 16-A 16 zet-dirichlet-AC 16-B 16 zet-okapi-AC 16-C 16 zet-pivot-AC 19-A 19 TOPX-CO-AllInContext-exp Okpi-2-7-0.75-2006-SansOvlp40-A 40 ParDocSansArticleBdy OkTg-Lineaire-RkSym100pcent-Okpi-2-7-0.75DocDoxParent40-B 40 VectTagFamClass-2006etiq50it-2006-SansOvlpParDocument OkTg-Lineaire-RkSym100pcent-SemiSup5-Okpi-2-70.75-DocDoxParent40-C 40 VectTagFamClass-2006etiq50it-2006-SansOvlpParDocument 41-A 41 A_CO_ARTorNAME
Figure 5 shows, when using the 10,000 synthetic assessment sets, and only the top 10 runs, the probability of a getting a different result from that of the baseline assessment set. The 5% probability that we consider significant is drawn dotted. There are 10 pairs of runs exhibiting instability, but some are very close in the figure and are hard to see. Table 2 lists each pair of runs for which the probability of a switch in relative performance is greater than 5% along with the p value from a two-tailed ttest. Short codes have been used for clarity. Table 3 gives the full names of the runs and the participating group’s id given the short code. Of note is that the top 10 runs were produced by only 4 separate participating groups. In all cases where there is a significant chance of getting a different relative rank order, no significant difference between runs measured with a t-test is seen. That is, using multiple assessors is only unstable in the cases where there is no significant difference between the runs anyway. T-tests on all pairs of the top 10 runs suggests that only 6 pairs differ significantly. From this it is reasonable to conclude that if multiple assessors had been used there would not have been a material difference in the result of the relevant-incontext task at INEX 2006.
5. Discussion and Conclusions Information retrieval test sets consist of three parts, a document collection, a set of topics and a set of assessments. At INEX the assessments are built by the participants themselves who in 2006 were expected to assess 3 topics each, totaling about a working week. We are particularly interested in reducing this assessment load for two reasons: First, a week is a substantial amount of time to spend doing nothing other than assessing topics. Second, we are looking for methods of using our participation in the evaluation forums as a teaching tool. One way to achieve both goals is to ask a class of students to assess topics. An individual topic might be split amongst seven students each working independently, but collectively assessing an entire topic. Such an approach to assessment is only valid if it can be shown that the result of using multiple assessors per topic would be indifferent from that of using a single assessor. Indeed, we have shown that the result would have been the same if multiple assessors had been used in the INEX 2006 relevant-in-context task. INEX 2006 was chosen because for 15 of those topics there were between 3 and 5 assessors each – making it possible to construct synthetic multipleassessor assessment sets. The relevant-in-context task was chosen because it is the most plausible XML-IR retrieval task. First the relative rank order of the runs was measured using a baseline assessment set derived from the official INEX assessments.
10,000 random multiple-assessor assessment sets were then generated. Next the relative rank order of the runs was measured with each of the synthetic assessment sets. These were shown to very strongly correlate with the original. The point of instability was examined and it occurs when the mean average precision difference between two runs is less than about 0.05. Differences in MAP of this small amount are not very interesting. Focusing on the top-10 runs, 10 pairs showed a greater than 5% chance of producing a different set of results when multiple assessors were used instead of a single assessor. Investigation into the significance of difference between these runs suggested that none existed. From this it can be said that on the data that was used in the experiments, the only place where a difference in relative rank order of runs would be seen is where there is no significant difference between runs anyway. We believe that, in the light of no evidence to the contrary, it is reasonable to conclude that using more than one assessor per topic is valid for information retrieval evaluation forums. This result could have a profound effect on the nature of these forums. INEX 2006 assessment was allotted 50 days, in part because the assessors (being the participants) had to assess in addition to their ordinary duties. If a large number of people could be coordinated simultaneously, as is inherent in the teaching of classrooms of students, the assessment phase might be reduced to just a few days. Some participants find it difficult to complete the assessment task. The result we present suggests that it is valid to ask another group (who might have spare resources) to complete the assessment of these topics. Doing so would both increase the number of topics used for evaluation and protect the investment in assessing already contributed by the original assessors. After examining the effect of using multiple assessors per topic (rather than the conventional single assessor per topic) we conclude that it would have no material effect on the evaluation of search engine performance.
6. Acknowledgements Partly funded by a University of Otago Research Grant.
7. References [1] Denoyer, L., & Gallinari, P. (2006). The Wikipedia XML corpus. In Proceedings of the INEX 2006 Workshop.
[2] Malik, S., Trotman, A., Lalmas, M., & Fuhr, N. (2006). Overview of INEX 2006. In Proceedings of the INEX 2006 Workshop. [3] Ogilvie, P., & Lalmas, M. (2006). Investigating the exhaustivity dimension in content oriented XML element retrieval evaluation. In Proceedings of the 15th ACM Conference on Information and Knowledge Management (CIKM 2006). [4] Pehcevski, J., & Thom, J. A. (2005). HiXEval: Highlighting XML retrieval evaluation. In Proceedings of the INEX 2005 Workshop. [5] Pehcevski, J., & Thom, J. A. (2007). Evaluating focused retrieval tasks. In Proceedings of the SIGIR 2007 Workshop on Focused Retrieval, 3340. [6] Piwowarski, B., Trotman, A., & Lalmas, M. (2007 (submitted)). Sound and complete relevance assessments for XML retrieval. [7] Sanderson, M., & Zobel, J. (2005). Information retrieval system evaluation: Effort, sensitivity, and reliability. In Proceedings of the 28th ACM SIGIR Conference on Information Retrieval, 162169. [8] Spink, A., Wolfram, D., Jansen, B. J., & Saracevic, T. (2001). Searching the web: The public and their queries. Journal of the American Society for Information Science and Technology, 53(2):226-234. [9] Trotman, A. (2005). Wanted: Element retrieval users. In Proceedings of the INEX 2005 Workshop on Element Retrieval Methodology, Second Edition, 63-69. [10] Trotman, A., N.Pharo, & Lehtonen, M. (2006). XML-IR users and use cases. In Proceedings of the INEX 2006 Workshop. [11] Trotman, A., Pharo, N., & Jenkinson, D. (2007). Can we at least agree on something? In Proceedings of the SIGIR 2007 Workshop on Focused Retrieval, 49-56. [12] Voorhees, E. M. (2005). Overview of TREC 2005. In Proceedings of the 14th Text REtrieval Conference (TREC-14). [13] Voorhees, E. M., & Buckley, C. (2002). The effect of topic set size on retrieval experiment error. In Proceedings of the 25th ACM SIGIR Conference on Information Retrieval, 316-323. [14] Zobel, J. (1998). How reliable are the results of large-scale information retrieval experiments? In Proceedings of the 21st ACM SIGIR Conference on Information Retrieval, 307-314.