Oct 28, 1997 - Ricardo Pong-Wong* John A. Woolliams .... effect and the major effect of a single diallelic locus (A and B). Before selection ..... Fournet et al.
Original
Response when
to
mass
article
selection
identified major gene is segregating
an
Ricardo Roslin Institute
(Received
Pong-Wong*
John A. Woolliams
(Edinburgh), Roslin, 28 October
Midlothian EH25
1997; accepted
Abstract - A deterministic model to
2 June
9PS, UK
1998)
predict response with mass selection when a segregating is presented. The model uses a selection index framework in which the weight of the different components included in the index are adjusted to describe the different methods of selection using genotype information as selection criteria. The response over multiple generations to several methods of selection using either the whole genotype effect (genotypic methods) or only the Mendelian sampling deviation of the major locus (Mendelian methods) was compared with selection using only performance record (phenotypic method). Relevant differences in response between using and ignoring information on the major gene were observed only when the favourable allele was at a low frequency. When the major locus had a completely additive effect, all the genotypic or Mendelian methods had a higher cumulated genetic gain in the first 3-4 generations of selection but this advantage was lost thereafter. In the long term, without exception, all methods using genotype information of an additive major gene had lower cumulated gain than phenotypic selection over a wide range of parameters. The reason for the long-term loss, was a reduction in the intensity of selection applied to the polygenic background arising from increasing the differences in the selective advantage between genotype groups. The same trend was observed when the favourable allele of the major locus was completely recessive or dominant, with the exception of the cases of a large recessive locus (over one phenotypic standard deviation) where the extra early gain from using genotype information was maintained in the long term. This was explained by the inefficiency of the phenotypic selection to fix the favourable allele due to the linkage disequilibrium built-up between the major locus and the polygenic effects. Differences in the inbreeding rate were also observed between these methods: the genotypic methods had the highest inbreeding rate while the Mendelian had the lowest. The difference in the inbreeding rate was mainly observed in the first generations of selection and increased with lower starting frequency of the major locus. @ Inra/Elsevier, Paris major gene / indice / gain / inbreeding / loss major locus
*
is
Correspondence and reprints ricardo.pong-wongCbbsrc.ac.uk
E-mail:
Résumé - Réponse à la sélection massale en présence d’un gène majeur identifié. On présente un modèle déterministe de prédiction de la réponse à la sélection massale quand un gène majeur est en ségrégation. Le modèle utilise le cadre de la théorie des index avec modifications des pondérations concernant les différentes
composantes de l’index,
en
fonction des différentes méthodes de sélection. Les
plusieurs générations, à plusieurs méthodes de sélection utilisant soit l’ensemble des effets génotypiques (méthodes génotypiques) ou seulement la déviation d’échantillonnage mendélien au locus majeur (méthodes mendéliennes) ont été comparées à la sélection utilisant uniquement les performances (méthode phénotypique). Des différences appréciables selon la prise en compte ou non de l’information sur le gène majeur ont été observées uniquement quand l’allèle favorable était à une basse fréquence. Quand le locus majeur avait un effet complètement additif, toutes les méthodes génotypiques ou mendéliennes ont engendré un progrès génétique cumulé plus élevé durant les 3-4 premières générations mais cet avantage a été ensuite perdu. Sur le long terme, pour une large gamme de paramètres et sans exception, toutes les méthodes utilisant l’information génotypique pour un gène majeur additif ont engendré un gain cumulé inférieur à la sélection phénotypique. La raison de cette perte à long terme a été une réduction de l’intensité de sélection appliquée à l’arrière-plan polygénique, liée à l’augmentation des différences d’avantage sélectif entre groupes génotypiques. La même tendance a été observée quand l’allèle favorable au locus majeur a été complètement récessif ou dominant, à l’exception des cas d’un gène à effet important (plus d’un écart-type phénotypique) et avec récessivité où le gain lié à l’utilisation de l’information génotypique se maintient plus longtemps. Ceci a pu être expliqué par l’inefficacité de la sélection phénotypique à fixer l’allèle favorable à cause du déséquilibre de liaison induit entre le locus majeur et les effets polygéniques. Les méthodes génotypiques ont créé plus de consanguinité que les méthodes mendéliennes. Ceci a été observé surtout dans les premières générations et a été d’autant plus important que la fréquence initiale de l’allèle favorable au locus majeur était faible. © Inra/Elsevier, Paris gène majeur / index / progrès génétique / consanguinité réponses,
sur
1. INTRODUCTION
Although selection in farm animals has been successfully carried out assuming the infinitesimal model, the discovery of single genes having large effects on quantitative traits and advances in DNA technology has increased the interest of using genotype information to improve response to selection. Additionally, statistical methods to obtain estimates of the effects of such genes are also becoming more reliable (e.g. [8, 11, 12, 16]). The benefits of combining both the genotype and performance information has mostly been assessed in terms of the short- and the medium-term genetic response relative to traditional phenotypic selection. The general conclusions are that the use of the genotype information from a major gene or a marker linked to the gene significantly increases the short-term genetic response [2, 13, 17, 18, 20]. However, Gibson [6] also reported that methods using genotype information may have a detrimental effect in the long-term cumulated gain. Therefore, further studies are still required to understand the factors affecting the short- and long-term response to selection when a major locus is
segregating. In this paper a deterministic model to predict response to selection in a mixed inheritance model (i.e. where the total genetic effects are due to a poly-
genic effect and a single locus with a major effect) is defined. Recursive equations for predicting the change in the genetic level, the polygenic variance and the gene frequency of the major locus over multiple generations of selection are presented. The linkage disequilibrium between the major locus and the polygenic effects built-up with selection is also calculated. A selection index framework to combine both genotype and performance information is used to describe different opportunities for selection. Using this framework, several methods of selection are compared across a wide range of parameters. The comparison was made in terms of short- and long-term response, the level of inbreeding accumulated after several generations of selection and the probability of losing the favourable allele during the selection process. Comparison of risks associated with gene assisted selection (GAS) such as inbreeding have received little information to date. 2. METHODS 2.1. Deterministic
genetic model
2.1.1. Notation
A quantitative trait is assumed to be genetically affected by a polygenic effect and the major effect of a single diallelic locus (A and B). Before selection in the base population, the frequency of the favourable allele (A) is p, and the three possible genotypes (AA, AB, BB), are assumed to have Hardy-Weinberg equilibrium frequencies, and be in linkage equilibrium with the polygenic effect. Following the same notation as Falconer !4!, the single gene has an additive effect (a), defined as half the difference between the effects of both homozygote genotypes (i.e. a (G p - )/2), A BB and a dominance effect (d) defined as the G deviation of the effects of the heterozygote genotype from the average value of both homozygote genotype effects (i.e. d AB G - (G AA + )/2). BB The G additive genetic variance explained by the single locus is ), 2 = 2p(1 — p)a where a is the average gene substitution equal to: a + d(1 - 2p) [4]. It is also assumed that all individuals have known genotype and the effects of the major locus is also known without error. Individuals within a genotype class can be distinguished by considering the genotypes of their parents. The genotype effect of an individual is, then, decomposed into two different components: i) the average effect of its parents’ genotypes (MG); and ii) the remaining (MS) defined here as the Mendelian sampling term of the major locus (i.e. G MS + MG). The component MG represents the family mean effect due to the single locus, and MS the deviation of the individual from the average family effect. When the effect of the single locus is completely additive (i.e. d 0), three groups with different MS value can be distinguished in each of the three genotype classes. The possible MS values for these groups are: +a, +a/2 or 0 for homozygotes AA; +a/2, 0 or - a/2 for heterozygotes AB; and 0, -a/2 or -a for homozygotes BB. Knowing the genotype and the MG term of an individual determines the value of its MS =
=
o, q1 , 0 2(
=
=
term.
by
Hence, the total population is classified into nine different groups defined the three possible genotypes j(j = AA, AB, BB), and the three possible
Mendelian
1,2,3) distinguished with a completely addipolygenic effects for each group jk, is pj k with variin the whole are frequencies population , where k ubj the base population all the groups have the same expecta-
sampling
terms
k(k
=
tive locus. The mean ance and their
Jfl,,!,
£j £ u Jjk
=
1. In
k
tion and variance for the polygenic effects, equal to zero and Va, respectively. The environmental variance J d , is equal across generations and groups. The in the base population is Jd initial polygenic heritability Va/(Va ) . + The total genetic effects GV (single locus and polygenic effects) of individuals within each groupk is normally distributed with the following expectation and variance:
h),
and the phenotypic values (y) have the same expectation as equation (1), but with an additional variance due to environment (0,!2). Combining the different subgroups with the same genotype j, the mean polygenic effects of the combined groups and their variance are:
where the first term of the variance arises from the polygenic variance within each MS group and the second term from the differences between the mean effect of each MS group. The same polygenic parameters for the overall population (i.e. p and Jf l ) can also be calculated using formulae (3) and (4), but the summation is over the parameters of the three combined genotype groups. The polygenic variance of the whole population ) U2 can, then, be divided into ( two components according to their sources: the within genotype variance (a w) ; and the between genotype variance (U2 ab ), being equal to the first and second components of formula (4), respectively. Before selection, the between genotype polygenic variance is zero since all groups have the same mean polygenic effects. 2.1.2. Selection index
The total
genetic effects affecting
an
components: the MS and MG effects due
individual can be divided into four to the individual’s genotype at the
single locus, the mean polygenic effects of the genotype group the individual belongs to and its deviation from the group mean. Assuming that all individuals have
one
phenotypic record
and that their genotypes and those of their parents
known, a general selection index used to calculate their estimated values for truncation selection is of the form: are
and its expectation and variance within each group
breeding
are:
where the components of the index are the estimators of the four genetic components. BS and BG are the breeding values due to the components of the major locus (MS and MG), BU is an estimator of the mean polygenic effect of each genotype group, , tj and BE is the remaining polygenic effect t confounded with the environmental deviation (i.e. BE y - G!k - BU!,) and =
its
expectation
is
zero.
mating, the breeding value due to a biallelic single its dominance deviation is estimated using the average gene substitution (a). Thus the respective breeding value of individuals with genotype AA, AB and BB are 2(1 - p)a, (1 — 2p)a and -pa [4]. Then, the breeding values of the candidates to selection and their parents required to calculate BS and BG are estimated using the new value of a, recalculated with the current gene frequency in the group of candidates to selection. The estimation of BU is dealt with in Appendix A, but in the suggested prediction model, it is assumed to be estimated with negligible error (i.e. BU is the true In practice, the estimation of the mean polygenic effect within each genotype group with small error would only be possible with large population sizes. The use of the selection index given in equation (5) as a selection criteria allows the flexibility to change the relative weight given to each of the genetic components. For instance, increasing the relative weight given to BS and BG would increase the average selective advantage of individuals with the most favourable genotype, yielding a faster change in the frequency of the favourable
Assuming
locus
random
accounting for
). j p
allele. The optimization of the selection index under different assumptions and its relationship with some methods of selection described previously in the literature is
explained
in
Appendix
B.
2.1.3. Selection response
At each generation
parents of
sex
(assumed to be discrete), the proportion of selected . Since truncation selection is applied, a x r x (x = m, f ) is 7
threshold point T can be found numerically fulfilling the condition that the proportion of individuals with index score greater that T over the nine groups is 7 . Thus the contribution of each group to the selected parents is k x r rj 7 x ,
such that
L !r!!!!
=
. x r 7
Knowing , jk r 7 x
and
!!!,!,
other
polygenic parameters
jk,x as the intensity of selection (2!k,!), the average effect (5!,!,!) and the polygenic variance adjusted for the reduction due to the Bulmer effect [1] can be estimated within each group.
in the selected parents, such
polygenic
(01 a 2, jk,x)
The difference in selective
advantage due to the single gene effect affects the
intensity of selection (i ) applied to the polygenic effect in each group jk. x , jk It is expected that individuals with the poorest genotype would, on average, have a greater polygenic effect if they are to be selected over candidates with a more favourable genotype. Similarly, since the intensity of selection varies between groups, the reduction in polygenic variance due to the Bulmer effect [1] is also expected to be different. Linkage disequilibrium between the major locus genotype effect and the polygenic effect is, then, created in the selected
and ! !A,! >
!a,AB,x ! aa,BB,x
(with p< , A S AB < -5’BB!; S X overdominance the selected heterozygotes may be ranked differently). Assuming that selected parents are randomly mated and there is equal family size for each mating pair, the genetic parameters in the offspring generation (denoted with * ) are expected to be: parents, where
and
jk ,j) r 7 ( m , jk is proportional to the probability of a sire from group jk, m r 7 being randomly mated with a dam from group jk, f; and T(j*k*Ijk, m; jk, f) is
where
the probability of a mating pair from groups jk, m and jk, f having an offspring j given Mendelian inheritance. , k * The polygenic variance within each offspring’s group has three different sources: i) the variance within each mating group; ii) the variance due to differences in the expected mean polygenic effect between mating pairs; and iii) the polygenic Mendelian sampling variance. The reduction in variance due to selection [1] affecting the variance within mating pairs was accounted for in formula (10). Similarly the variance arising from the polygenic Mendelian sampling is also expected to be reduced with the accumulation of inbreeding in the selected parents. However, this effect is not accounted for with the present deterministic model. Since the distribution of parental genotypes will differ among the genotypic classes in the offspring generation, a proportion of the disequilibrium created during selection of the parents is retained. In the offspring generation, the mean polygenic effect within each genotype group (/’*AA, B’ -lj’m) and its -lÀ / / variance are no longer expected to be the same. In the overall population, this disequilibrium results in the appearance of a negative covariance between the major locus and the polygenic effects, and the polygenic variance between genotypes ( ab) is no longer zero. The measurement of these Q variance components is described in Appendix A (note, however, they are not required for the prediction of the response to selection). Since the offspring become the candidates for selection in the next round, the parameters calculated for the offspring generation can, then, be used recursively to estimate parameters of subsequent generations. In each round of selection, new linkage disequilibrium between the major locus genotype and the polygenic effect is created and maintained until the favourable allele is fixed. The differences in the selective advantage responsible for this disequilibrium will vary due to changes in the parameters of the next generation such as the group frequencies ub , the polygenic variance and the linkage disequilibrium jk carried over from the previous round of selection.
A’ a;*A (a;*A B’ B a,B 0 )
2.1.4.
Comparison with stochastic simulations
In order to test the accuracy of the predictions obtained using the present deterministic approach over multiple generations, they were compared with results from stochastic simulation using a thousand replicates. In the simulated population, the base group was assumed to be composed of 360 unrelated individuals (180 males and 180 females). The initial polygenic and environmental variances were considered to be 0.2 and 0.75, respectively. The segregating major locus was completely additive (a 0.443, d 0) and the starting frequency of the favourable allele was 0.15 (i.e. = 0.05). At each generation all individuals were scored with the relevant index and 30 males and 60 females with the highest estimated breeding values were selected to be the parents of the next generation (i.e. proportion selected 7 m r 1/6, !rf 1/3). Each male was mated hierarchically to two females randomly chosen from the selected group to produce six offspring per female (three males, three females). The same selection process was then applied to the offspring to produce the subsequent generation. Loss in the polygenic variance due to inbreeding was taken into account during the simulation of the polygenic breeding values of the offspring. =
=
) J
=
=
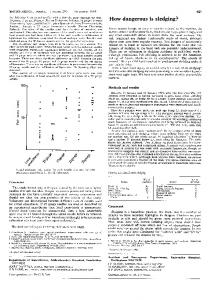
(i.e. the polygenic breeding value of an offspring was simulated to be the mean polygenic breeding value of its parents plus a Mendelian deviation drawn from a normal distribution with mean zero and variance (Va/2)[1- (F S + Fd)/2!, where Va is the polygenic variance in the base population and F S and F d the coefficient of the sire and dam, respectively). inbreeding offspring’s Figure1 shows the evolution of the total and the polygenic means as well as the change in the gene frequency of the major locus obtained with both the deterministic and the stochastic approaches under two different methods of selection. In the early generations the results from the deterministic approach have good agreement with the stochastic results, but a small overestimation of the polygenic response was observed later. After 19 generations of selection the overestimation of the polygenic response for both methods of selection was 8 %, representing 0.32 phenotypic standard deviation. Most of the discrepancy between these two prediction approaches is explained by the fact that the loss in polygenic variance due to inbreeding is not taken into account with the deterministic approach. The cumulated overestimation of the deterministic approach after 19 generations was reduced to only 2 % (i.e. 0.09 op) when the inbreeding level observed in the stochastic simulation was used to adjust the polygenic variance in the deterministic formulae (results not shown). For the population size and the gene frequency assumed in the stochastic simulations, the error associated with the estimation of BU (as a predictor of p ) was j very small and affected the agreement between predictions obtained with the stochastic and the deterministic model very little.
2.2.
Comparison
between different methods of selection
Two methods of selection
(genotypic
and Mendelian
selection) using
geno-
type information in the selection process when a known major locus is segregating were compared with the traditional phenotypic selection. Three different variants (I, II and III) for both the genotypic and the Mendelian methods were considered in the comparison. The methods of selection were based upon varying the weight given to the different components included in the selection index given in equation (5) (see table 1). In the genotypic methods both components of the major locus are included in the index while the Mendelian methods weight the major locus only by its BS component (i.e. /3 BG = 0). In this study the genotypic and Mendelian methods of selection are referred as the gene assisted selection (GAS) methods. The selection indices for the variants I and II are the result from the optimization using classical index theory to maximize immediate genetic gain, from either accounting for or ignoring the linkage disequilibrium between the major locus and the polygenic effects (see Appendix B). The genotypic I and II are also equivalent to the maximum accuracy and direct selection methods described by Gibson [6]. For genotypic III, the relative weight given to the components BG is the same as it would be with phenotypic selection. For the case of Mendelian III, the weight given to the BS is updated in each generation to maximize response in the current round of selection. This was required since the optimum weight in Mendelian methods depends on the gene frequency, in contrast to the genotypic methods where the optimum weight is the same as that obtained from classical index theory regardless of the frequency of the
favourable allele (see Appendix B). It is important to note that variant I of both methods (i.e. when accounting for the disequilibrium) are the only cases where the two polygenic components (BU and BE) are assigned a different weight in the selection index. Thus the precision in which the mean polygenic effect is estimated affects variant I. In the other variants where both polygenic components have the same weight, the distinction between both polygenic sources becomes irrelevant. 2.3. Criteria of
comparison
The effects of each alternative of selection on the short- and long-term cumulated genetic response were compared using the deterministic model previously described. This comparison was carried out over a range of different heritabilities and the size and degree of dominance of the major gene effects. Further criteria of comparison were the inbreeding coefficient cumulated over several generations of selection and the probability of losing the favourable allele when its starting frequency was low. These comparisons were made using stochastic simulation as the present deterministic model does not account for them. Most of the comparisons were carried out with a common set of parameters. In this set the polygenic and the environmental variance were 0.20 and 0.75, respectively (i.e. polygenic heritability 0.21). The major locus had a additive effect d and the starting frequency of the completely (a 0.443, 0) 2= 0.25). The favourable allele was 0.15 (i.e. 0.05; total heritability h proportions of males and females selected were 0.16 and 0.33, respectively. made by altering the gene frequency and its Changes in initial effect. The polygenic heritability was modified by altering the environmental variance while keeping constant the polygenic variance (Va 0.2), thus the total variance was not equal to 1 in all cases.
hP=
=
=
)= J
!9were
=
3. RESULTS 3.1.
Response
to selection
3.1.1. Short- and
(using
the deterministic
long-term cumulated
model)
response with
an
additive
locus The predicted cumulated responses to selection over the generations when the major locus is completely additive are shown in table II. When the starting frequency of the favourable allele was 0.15, all the GAS methods achieved greater cumulated genetic response than the traditional phenotypic selection during the early generations of selection. The superiority of these methods over the traditional phenotypic selection peaked after 2-3 generations of selection, ranging from 10 % of extra gain for the Mendelian methods to 30 % obtained with the genotypic schemes. However, the extra cumulated response of these methods over the phenotypic selection gradually diminished and disappeared after 6-7 generations. After the favourable allele had been fixed with all the methods of selection (see results of generation 20), the GAS methods yielded a lower cumulated genetic response than the phenotypic selection. In the longer term, their loss in the cumulated gain relative to the phenotypic selection was of comparable magnitude to the maximum benefit (extra cumulated gain) they had in early generations. Since the genetic gain per generation after fixation is expected to be the same for all the methods (since genetic response is only due to polygenic gain), the difference in the cumulated response between these methods becomes permanent. A similar trend was found when the starting frequency of the favourable allele was 0.85 but at lower timescale and differences. The extra gain achieved using genotypic selection was only 12 % for the first generation, and disappeared after 2-3 generations. The short-term benefit using Mendelian methods was only marginal or at worst null (results not
shown).
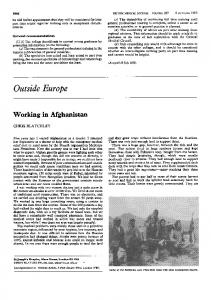
Figure 2 shows the genetic response achieved in generations 1 and 30 with a range of polygenic heritabilities (where Va was held constant) and effects of the major locus with starting frequency of 0.15. (Since the trends were similar in most of the GAS methods not all of them
are shown.) The extra response the cases of genotypic selection in the first round of selection was greater with lower polygenic heritability and a larger effect of the single locus, confirming the results previously reported by Lande and Thompson !13!. However, as in table II, greater gain in the short term tended to be associated with a larger permanent loss in the longer term. For the case of Mendelian methods, the advantage over phenotypic selection in early generations was observed only with low polygenic heritability. When the starting frequency was 0.85, the effects of all selection methods in the cumulated response were only marginal in both the early and later generations (results not shown). The differences in the short- and long-term cumulated response observed with these methods of selection were related to the weight given in the selection index to the major locus relative to the polygenic effects. The extra gain in the early generations obtained with the genotypic and the Mendelian methods was achieved through a faster increase in the frequency of the favourable allele, but with a lower response in the polygenic background (table I!. In the long term,
achieved
by
those methods with lower rate of polygenic gain in the previous generations had less cumulated genetic response. Over all the methods of selection a faster increase in the frequency of the favourable allele in a generation was always related with a lower gain in the polygenic effects. The maximum gain in the polygenic effects for a single round of selection was obtained when the favourable allele was fixed, corresponding to the case where no extra gain can be due to the major gene.
3.1.2. Effect of accounting for the
linkage disequilibrium
The linkage disequilibrium is taken into account in variant I of the genotypic and the Mendelian methods by assigning the optimum weight to BU. The selection method genotypic I performed better than genotypic II over the whole selection process confirming the results previously reported in the literature !6!. Nevertheless, this benefit represented only a marginal increase in response to selection. For the second round of selection, the cumulated gain obtained with genotypic I was less than 2 % greater than the genetic response observed with genotypic II. In the long term the loss in the cumulated genetic response of genotypic I was 10 % smaller than that observed with genotypic II. Assigning the correct weight to BU in the Mendelian method did not yield any benefit, in terms of extra gain. In this case the re-optimization of the selection index considering the frequency of each group rather than using the estimate obtained from classical index theory (i.e. Mendelian III), was more important to ensure maximum
genetic
progress.
3.1.3. Effect of the
degree of dominance
Comparisons of different GAS methods when the effect of the favourable allele (A) is completely additive, dominant or recessive are shown in figure3 for 0.15 and a 0.443 (when p 0.85 the trend was the same but at a smaller p scale). The most beneficial situation of using GAS methods, in terms of greater short-term response, was when the favourable allele was recessive and at low frequency. Moreover, their long-term genetic gain was even greater for the cases when the effect of the recessive major locus was larger than one phenotypic standard deviation (figure 4), contrasting with the case of an additive locus where a loss in the long-term cumulated gain always appeared unavoidable (see figure !). The trend with the favourable allele being dominant was similar to those observed in the case of a completely additive locus but at a lower scale =
(results
=
=
not
shown).
3.2. Level of
inbreeding
The inbreeding accumulated after ten generations of selection for two cases with different starting gene frequencies is shown in table III. The highest level of inbreeding was obtained when selection was carried out using genotypic methods; while the lowest was achieved with the Mendelian methods. The inbreeding rate varied over generations, with the highest rate observed in early generations before the favourable allele was fixed. The greatest differences in the level of inbreeding were obtained when the frequency of the favourable allele was low. Where the starting frequency of the favourable allele was 0.15, the inbreeding level of genotypic I and Mendelian II was 2.8 % greater and 5.7 % smaller, respectively, than the inbreeding level accumulated with phenotypic selection. Where the starting frequency was 0.05, the inbreeding coefficients, relative to phenotypic selection, were 8.4 % greater with the genotypic II and 6.5 % smaller with Mendelian II.
3.3.
Probability
of
losing
the favourable allele
Table IV shows the
probability of losing the favourable allele when its 0.05. For the variants I BU was estimated in three different ways: i) the mean phenotypic value adjusted by the major locus effects; ii) by regressing the adjusted phenotype on the favourable alleles; and iii) the same as (ii) but restricting the difference to between -cY and 0 (see Appendix A for more information on the regression approach). Because the average selective advantage of a genotype group depends on the genotype effects and their mean polygenic effects, the restriction imposed in (iii) it was ensured that the genotype group with the most favourable genotype will always have the greatest selective advantage. As expected those methods which assign a greater weight to the major genotype had lower probability of actually losing a rare favourable allele. However, the method of estimating B U when using genotypic I and Mendelian I methods of selection had a great impact on the probability of losing the favourable allele. Unless the differences in the polygenic mean between genotype groups were restricted, the probability of losing the favourable allele was large, especially when the single locus had a small effect. The error associated with the estimation of BU when only few individuals belong to a given genotype group can be quite large overcoming the greater selective expected from the individuals with the better genotype. starting frequency
was
4. DISCUSSION
In this paper a deterministic approach was presented to predict response to selection when a major locus is segregating. A flexible selection index framework was used to describe the different selection methods compared in
this study (and in others previously reported in the literature), showing that their differences lay in the relative weight given to each component included in the selection index. Different alternatives of selection were compared in a wide
range of situations to
of
a
give a picture of the potential benefit of using information major locus during selection, including the impact on inbreeding and the
of losing the favourable allele. None of the indices studied, genotypic or Mendelian, were able to resolve the conflict between the short-term and the long-term benefits of GAS, with the exception of rare recessive alleles of large effect. This finding is similar in outcome to Gibson [6], Ruane and Colleau (17!, Fournet et al. [5] and Larzul et al. [14] who used different approaches to the problem. Moreover, the present results also show that the situations when the use of genotype information is expected to yield a greater benefit in the short term, tend to be associated to a larger negative effect in the long-term cumulated response. The loss in long-term genetic gain increased with smaller heritability, larger effect of the major locus and lower starting frequency of the favourable allele.
probability
The conflicts arise from the higher short-term response from a faster increase in the favoured allele and a reduced long-term gain in polygenic effects [5, 14, 16, 17]. The higher average selective advantage of individuals with the most favourable genotype results in a lower selection pressure among them. Further increases in the selective advantage of an allele results in a greater proportion of individuals with this allele being selected, but also further decreases in the selection pressure applied to the polygenic effects. The selective advantage is increased by increasing the weight in the index or an increase in the average effect. In the overall population, this greater proportion of individuals selected from the groups with lower selection pressure would yield an unavoidable loss in the intensity of selection applied to the polygenic effects (see figure Bl in Appendix B). This explains both: i) that the maximum polygenic gain per generation for any of these methods was predicted to be when the major locus was fixed and the population was no longer subdivided in different groups; and ii) the observation that the greater the initial selective advantage the greater the long-term loss. Although methods assigning greater weight to the major locus have faster fixation time of the favourable allele, they are also expected to have greater polygenic gain during the period after they fix the favourable allele but before it is achieved by the phenotypic selection method. In most of the cases studied here, this latter period only partially compensated for the initial loss of polygenic gain. to this general picture were observed and were limited to cases favourable recessive allele at low starting frequency and with large effect N a > This refines the results of Fournet et al. [5] and Larzul et al. [14] for ( mass selection who studied recessive alleles of large effect. The use of genotype information with recessive single genes of smaller effect still presented the negative effect in the long-term cumulated gain relative to phenotypic selection, but the magnitude was substantially smaller than when the favourable allele was additive or dominant. The benefits of GAS are due to the inefficiency of the phenotypic selection in fixing a recessive locus. In the first round of selection the heterozygote individuals (AB) have, on average, the same chance of being selected as those individuals homozygous (BB) to the less favourable allele, reducing the rate of change in the frequency of the favourable allele. However in subsequent generations linkage disequilibrium is built-up, and the average selective advantage of the heterozygote individuals is less than the homozygote BB since their mean polygenic effects are expected to be smaller (some ABs will have AA parents). Considering that major genes with greater effects are expected to yield larger linkage disequilibrium, the phenotypic selection is also expected to be less efficient fixing such loci. Thus the beneficial effect of using genotype information remains in the long term only for recessive locus with large effects. Fournet et al. [5] and Larzul et al. [14] also studied the case with progeny testing but in this case the AB individuals are distinct from the BB when genotypes are not recorded. A justification for increasing the difference in the selective advantage between genotype groups would be to reduce the probability of losing a favourable allele, yet whilst the benefits may appear obvious, the poor results observed for the selection methods genotypic I and Mendelian I are alarming. The chance of losing the rare favourable allele with these methods were, in some cases, greater than when phenotypic or even random selection was applied. This problem was
Exceptions
with
a
in the estimation of the mean polygenic effects of each to the small size of the genotype group with the rare allele. For the population size assumed in this study, the mean polygenic effect
associated with
errors
genotype group due
between the different groups was estimated with such error that the greater selective advantage of individuals with the most favoured genotype was not always secured. These results raise some doubts about the practical desirability of using a selection index which accounts for the difference in the mean polygenic effects. The error in estimating the mean polygenic effects of each genotype group did not affect the performance of other methods since all polygenic components had the same weight in the index. Since the extra response to selection using genotypic I (where mean polygenic effects are assumed known, precisely, and are accounted for) relative to genotypic II (where they are ignored) it may be that unless the population is very large genotypic II is more robust. The different selection indices resulted in differences in the inbreeding coefficient at the time of fixation and these differences may affect the assessment of the long-term results from the deterministic model. The lowest cumulated inbreeding was observed for the Mendelian methods while the genotypic methods showed the highest. This difference in cumulated inbreeding was more accentuated when the starting frequency was low. Grundy et al. [7] showed that selection on the Mendelian sampling term gave reductions in the inbreeding rate of up to 24 %. Hill et al. [10] also showed the value of selecting for family deviation in reducing the inbreeding rate. Weighting the major locus by only its Mendelian sampling term reduces the extent of between family selection and so may be expected to reduce the inbreeding rate during fixation. The increased inbreeding rate observed with the genotypic methods is consistent with the results from Ruane and Colleau [17] who reported a similar trend when genotype information of a marker linked to a major gene is used during the selection process. Greater inbreeding rates will affect the long-term response through the greater rate of loss of polygenic variance. Thus predictions using the deterministic model are expected to overestimate the long-term response of the genotypic methods relative to the phenotypic selection and underestimate those for Mendelian methods. Finally, the general framework proposed here for studying response to mass selection when a major locus is segregating may provide a valuable tool to assess the value of gene assisted selection schemes in more specific situations. This study considered only some specific cases of how the major locus and the polygenic components may be weighed in a selection process. However, the selection index approach used in this study would allow testing of any possible combination of weights given to both genetic sources. The antagonism between the short- and the long-term genetic response first reported by Gibson [6] and confirmed by further studies including this one, appears to suggest that there is no general formulae for maximizing genetic response across the whole selection process when a major locus is segregating. Dekkers and Van Arendonk [3] showed that selection response at a given timescale may, however, be optimized by modifying the weight given to the major locus across the different rounds of selections. Their method for finding the optimum weight to maximize gain at a given time will easily be implemented in the deterministic model proposed
here.
The model described is also sufficiently flexible for extension to multiple alleles and overlapping generations. The latter case was considered by Larzul et al. [14] but their model does not account for the Bulmer effect and the weight given to the major locus relative to the polygenic effect is less obvious to change. However the results of this study suggest that the implementation of GAS requires clear definition of the objectives resolving the conflicts of early response with long-term response, inbreeding and allele loss.
ACKNOWLEDGEMENT The authors acknowledge financial support from the Milk Marketing Board of England and Wales and The Ministry of Agriculture, Fisheries and Food. The authors thank Naomi Wray for providing the programme for stochastic simulation.
REFERENCES
!1! Bulmer M.G., The effect of selection on genetic variability, Am. Nat. 105 (1971) 201-211. [2] De Koning G.J., Weller J.1., Efficiency of direct selection on quantitative trait loci for a two-trait breeding objective, Theor. Appl. Genet. 88 (1994) 669-677. [3] Dekkers J.C.M., Van Arendonk J.A.M., Optimum selection on identified quantitative trait loci, Proc. 6th World Cong. Genet. Appl. Livest. Prod. 26 (1998) 361364. [4] Falconer D.S., Introduction to Quantitative Genetics, 3th ed., Logman Scientific and Technical, Essex, 1989. [5] Fournet F., Elsen J.M., Barbieri M.E., Manfredi E., Effects of including major gene information in mass selection: a stochastic simulation in a small population, Genet. Sel. Evol. 29 (1997) 35-56. [6] Gibson J.P., Short-term gain at the expense of long-term response with selection of identified loci, Proc. 5th World Cong. Genet. Appl. Livest. Prod. 21 (1994) 201-204. [7] Grundy B., Luo Z.W., Villanueva B., Woolliams J.A., The use of Mendelian indices to reduce the rate of inbreeding in selection programmes, J. Anim. Breed. Genet. 115 (1997) 39-51. [8] Guo S.W., Thompson E.A., A Monte Carlo method for combined segregation and linkage analysis, Am. J. Hum. Genet. 51 (1992) 1111-1126. [9] Hazel L.N., The genetic basis of constructing selection indexes, Genetics 28 (1943) 476-490. [10] Hill W.G., Caballero A., Dempfle L., Prediction of response to selection within families, Genet. Sel. Evol. 28 (1996) 379-383. [11] Janss L.L.G., Van Arendonk J.A.M., Thompson R., Application of Gibbs sampling for inference in a mixed major gene-polygenic inheritance model in animal populations, Theor. Appl. Genet. 91 (1995) 1137-1147. [12] Kennedy B.W., lauinton M., Van Arendonk J.A.M., Estimation of effects of single genes on quantitative traits, J. Anim. Sci. 70 (1992) 2000-2012. [13] Lande R., Thompson R., Efficiency of marker-assisted selection in the improvement of quantitative traits, Genetics 124 (1990) 743-756. [14] Larzul C., Manfredi E., Elsen J.M., Potential gain from including major gene information in breeding value estimation, Genet. Sel. Evol. 29 (1997) 161-184. [15] Luo Z.W., Thompson R., Woolliams J.A., A population genetics model of marker-assisted selection, Genetics 146 (1997) 1173-1183.
[16] Pong-Wong R., Woolliams J.A., Estimating major gene effects with partial information using Gibbs sampling, Theor. Appl. Genet. 93 (1996) 1090-1097. [17] Ruane J., Colleau J.J., Marker assisted selection for genetic improvement of animal population when a single QTL is marked, Genet. Res. 66 (1995) 71-83. [18] Smith C., Improvement of metric traits through specific genetic loci, Anim. Prod. 9 (1967) 349-358. [19] Woolliams J.A., Pong-Wong R., Short-term versus long-term responses in breeding schemes, Proc. 46th Annual Meeting of the EAAP, 1995, p. 35. [20] Zhang W., Smith C., Computer simulation of marker-assisted selection utilizing linkage disequilibrium, Theor. Appl. Genet. 83 (1992) 813-820. APPENDIX A: Description of the linkage the single locus and the polygenic effects
disequilibrium
between
The quantification of the linkage disequilibrium between the major locus and the polygenic effects built-up during the selection process is not an essential component of the deterministic model developed. However, it is of interest in understanding the dynamics of GAS. This linkage disequilibrium is characterized by differences in the mean polygenic effects between genotype and a negative covariance between groups, resulting in the appearance of the major genotype effect and the polygenic effects in the offspring population. The quantification of the new variance components describing the linkage disequilibrium in the offspring generation is approximated using an extra parameter !y. This is defined as the average gene substitution of the single locus due to the associated polygenic effects and is the regression coefficient of the mean polygenic effect of each genotype group on the number of favourable alleles in each genotype (as in the estimation of the effect of allele substitution, Falconer !4!). Since the group with the less favourable genotype is associated with a greater polygenic mean, -y is expected to be negative. Hence, the covariance between major genotype and the polygenic effects is equal to 2p(1 - p)a-y and the between genotype polygenic variance b )(o, 2 isa equal to [2p(1- ph + 6, where6 accounts for the remaining variance not explained by 2] the regression. Using equation (9) it can be shown that if the same proportion of parents is selected in both sexes and random mating is practised, the mean polygenic effect of the heterozygous offspring is the average of the mean polygenic effect of both homozygotes. In this case the regression on the mean polygenic effect would explain all the variance and6 would be zero. The covariance matrix between both the single gene and the polygenic effects and their components included in the selection index described in equation (5) is shown in table AI. Where estimates O , /LAB and p /LAA f BB are poor, the regression estimates for these means (i.e. ILAA and /-lAB /ZBB expressed as deviation from the overall , mean are equal to 2(1 — p)-y, (1 — 2p)q and -2p-y, respectively) might be considered in the selection index given in equation (5).
b a Q
APPENDIX B: Optimization of the selection index to maximize immediate response and the relationship between the different methods of selection
Using the same approach as Lande and Thompson !13!, the effect of the single gene components are assumed to have a polygenic-like behaviour and, then, the selection index given in equation (5) can be maximized using classical index theory !9!. The vector of index coefficients, /3 will then be equal to PGd, l where P and G are the phenotypic and genetic covariance matrices and d the vector of relative economic values for each component. Since the objective is to maximize the total genetic progress regardless of its source, all components have the same economic weight (i.e. d’ = [1,1,1,1]). Assuming that the effect of the single locus is known and the mean polygenic effect of each genotype class can be estimated at each generation without error the phenotypic and genetic covariance matrices follow from table A1.
and
In P and G, Q W is the within-group polygenic variance and this will be a assumed to be constant across classes and equal to Va over all generations. This assumption is in common with classical sib indices for polygenic traits.
Calculation of the vector of index coefficients which maximizes the immediate genetic progress is !i’ It corresponds to knowing the mean !1, 1, 1, genotypic effects between groups and is equivalent to the rrca!im!m accuracy method of Gibson !6!. Here it will be referred as genotypic I. In most practical cases the estimates of the mean polygenic effect within genotype groups may be poor, and an alternative may be to assume no linkage disequilibrium between the major locus and the polygenic effect (i.e. y 0; AA p AB l / ). The component BU is then ’incorrectly’ assumed to be ABB zero and not disentangled from the component BE. Under this assumption the optimum selection index without using B U would have index coefficients Since BU is no longer disentangled BG 1 BE 3 equal to: (3 BS 1 and ( 3 from BE, the component BU would have an intrinsic weight similar to BE It corresponds to the direct selection method of Gibson !6!, BU (i.e. ,Q and here referred as genotypic II. The assumption of =0 is made by Lande and Thompson !13). Although the index coefficients obtained here and those reported by them are different, it can be shown that this is due to a different approach to decomposing the phenotypic observation, and the relative weight given to the major locus is the same in both cases.
h!].
=
=
=
=
=
=
=
=
h p 2.
h p 2).
Mendelian indices The selection index can also be maximized applying the constraint that ,3 0 and the index coefficients which maximize progress can be obtained MG using classical index theory. When linkage disequilibrium is taken into account, the index coefficient will be: (3’ !l, 0,1, h2]; and when no linkage equilibrium is assumed, /3’ [1, 0, h’, h ] . Here they will be referred as Mendelian I and 2 Mendelian II, respectively. =
=
=
Phenotypic
selection
Similarly when the single locus is completely additive, the traditional phenotypic selection without using genotype information intrinsically gives the same weight to all the components included into the index; in this study this is equal to the total heritability (however, any value given to the index will be equivalent to the phenotypic selection, provided that all index coefficients are the
same).
Comparison of genetic gain predicted using study
the classical index
theory
and the
deterministic model described in this
Luo et al. [15] showed predictions of gain by classical index theory (as in Lande and Thompson !13!) were accurate only when the gene frequency of the major gene is 0.5, with underestimation at lower frequency and overestimation at higher frequency. Figure BI shows the genetic gain in one round of selection predicted using classical index theory and the deterministic approach described here. Classical index theory gave the optimum weight for genotypic methods which was constant for different allele frequencies. With Mendelian methods the optimum weight depended upon the allele frequency. This then justifies the need to re-adjust the weight given to BS according to the frequency among the candidates (this method will be referred as Mendelian III).