The ISMS Durable Goods Datasets
May 10, 2012 Jian Ni Carey Business School Johns Hopkins University 100 International Drive Baltimore, MD 21202 Tel: 410-234-9430 Fax: 410-234-9439 Email:
[email protected] Scott A. Neslin Tuck School of Business at Dartmouth Dartmouth College Hanover, NH 03755 Ph: 603-646-2841 Fax: 603-646-1308 Email:
[email protected]
Baohong Sun Cheung Kong Graduate School of Business 111 West 57th Street, Suite 418 New York, NY10019 Tel: 212-782-3991 Fax: 212-956-9675 Email:
[email protected]
1
Abstract
This
paper
describes
two
new
datasets
available
to
academic
researchers
(at
http://www.informs.org/Community/ISMS). The first is a panel dataset containing the transactions of 19,936 households made over the period from December 1998 to November 2004 at a major U.S. consumer electronics retailer. There are a total of 173,262 transactions, including purchases and returns of products as well as extended warranties. There are 16 product categories and 292 sub-categories, ranging from big ticket items such as televisions to small ticket items such as CDs and batteries. The second dataset features a field experiment for a Christmas promotion that took place in December 2003 in the form of a direct mailing sent to a randomly selected group of households at the end of November 2003. We describe the data and the research issues that can be potentially studied using these two durable goods datasets.
Key words: retailer, durable goods, panel data, product adoption, holiday promotion, sales forecasting
2
1. Introduction Durable goods play a crucial role in the economy. In 2008, personal consumption expenditures on durables exceeded $1.1 trillion (Federal Reserve Bank of St. Louis, 2009). Compared with fastmoving consumer packaged goods (CPG), consumer decisions for durable goods are much more sophisticated, dynamic, and deliberative, and raise numerous research questions for microeconomic and marketing analysis. A thorough understanding of consumer decisions with respect to durables will help develop and test both economic and consumer behavior theories, and have important implications for managerial decisions. Over the past decades a rich analytical literature in both marketing and economics has examined the competitive behavior of firms that sell durable goods. However, empirical research investigating consumer decisions about durable goods are sparse in marketing. Examining Marketing Science and Journal of Marketing Research, more than 400 papers have been published regarding consumer purchase behavior of CPG products using IRI and ACNielsen datasets over the past three decades. This contrasts with 36 papers focused on durable goods, among which 28 used aggregate sales and only eight used individual consumer purchase history (consumer panel data). The purpose of this paper is to address this disparity by introducing two distinct databases to the research community. Both are being administered by the INFORMS Society for Marketing Science (ISMS) and are called ISMS Durables Dataset 1 and ISMS Durables Dataset 2. To the best of our knowledge, the ISMS durables datasets are the most comprehensive customer-level transaction data available to researchers. We make these datasets publically available with the wish to facilitate researchers in marketing, economics, psychology, and other fields to conduct research that help understanding consumer purchase decisions about durable goods. 3
Both databases are provided by an anonymous major U.S. consumer electronics retailer. ISMS Durables Dataset 1 is panel data: It contains the complete transaction records of a large set of customers encompassing most of the retailer’s stores over a six-year period. ISMS Durables Dataset 2 is also at the customer level. It is cross-sectional and features the results of a direct mail promotion field experiment. It contains a host of variables calculated before the promotion, an indicator of whether the customer was offered the promotion, and dollar purchases made by the customer during the promotion period. In what follows, we describe both databases and suggest a few illustrative research topics. More time is spent on Dataset 1 because it can be used to investigate a broader set of topics. However, ISMS Durables Dataset 2 is also quite promising and we discuss it as well. Detailed documentation of the variables in each database is available at http://www.informs.org/Community/ISMS. 2. ISMS Durables Dataset 1 2.1 Data Description The first dataset consists of all transaction records of 19,936 randomly selected households from the same national retail chain during 6 years from December 1998 to November 2004. During this period, the 19,936 households made 173,262 transactions of durable goods and/or services from 1176 of the focal retailer’s stores located throughout the United States 1 . There are 16 product categories (e.g., PC Hardware), 292 sub-categories (e.g., desktop computers), and 22,210 specific products (models), ranging from big ticket items such as televisions, cameras, and PDAs, to accessories and small ticket items such as CDs and batteries. Brand information for each model is also available. 1
For each randomly selected household, we have the complete transaction record. Thus, whether the data are evenly
distributed across years depends on the purchase frequency of each individual customer.
4
There are six types of transactions: product purchase, product return, extended service contract purchase, extended service contract return, sales discount, and miscellaneous. Each record includes detailed information about these transactions for a particular customer at a particular date, and depending on the transaction type, information such as brand purchased or returned, service contracts purchased or returned, product category, price paid or refunded, length of coverage of service contract, and time and location of transaction. Finally, each record contains customer-level demographic information such as income, gender, family size and age. Tables 1A and 1B show frequency counts of the six transaction types across all categories as well as for the top 10 categories2. There are thousands of transactions per category. Wireless and DVS have the highest product return rate, at 15.2% and 17.5%, respectively, while Music has the lowest return rate at 5.4%. PC Hardware has the highest purchase rate of extended service contracts, at 21.6%. Interestingly, consumers who purchase an extended service contract for the Mobile category are more likely to return that contract. [Table 1 Goes Here] Table 2 provides descriptive statistics for representative sub-categories such as digital camera, camcorder, TV, VCR, Desktop, and Notebook. Again, there are thousands of purchases in these sub-categories, suggesting research can be conducted at the sub-category level. The number of brands per sub-category ranges from 11 to 67, a rich but manageable number to analyze. Taking Digital Cameras as an example, 1953 customers made 2524 purchases of 20 brands during the six years at an average price of $311.95, and purchased on average $71.27 in extended service plans offered by the retailer. Among these transactions, 22% are associated with the purchase of an 2
We report the top 10 major categories instead of all 16 because there are sparse observations in the other 6
categories.
5
extended service contract, 11.9% of the products were returned, 3.4% were purchased online, and 24.8% were bought during the holiday season (Thanksgiving and Christmas weeks). Big ticket items like Digital Camera, Camcorder, Desktop and Notebook have about 20% of purchases associated with an extended service contract purchase; while those categories also have a relatively high product return rate. However, the TV sub-category stands with the highest ratio of service contract price to the product price. [Table 2 Goes Here] Table 3 illustrates “market basket” statistics for the “PC Hardware” category. There are six sub-categories within PC Hardware: scanners, PDAs, notebooks, desktops, printers, and monitors. A total of 5,266 customers bought at least one of these products. Table 3 shows the combinations that were bought most frequently over the observation period (not necessarily at the same purchase occasion). With six sub-categories, there are 26 = 128 possible combinations or market baskets. However, Table 3 shows that 12 baskets account for more than 90% of the baskets actually purchased. The most common basket, not surprisingly, is purchasing a desktop, printer, and monitor (1287 customers). However, 908 customers purchased just a printer, 390 purchased just a monitor, and 331 purchased just a laptop. A natural question is to understand what distinguishes the single-item basket customers from the multiple-basket customers. Table 4 provides purchase statistics at the customer level. The data can be aggregated per trip or examined at its most micro-level – the transaction. Note the standard deviations are at least as high as the means for these variables, so there is ample variation and obviously some “heavy users”. For example, the average amount spent per trip is $317 with a standard deviation of $497; the average amount per transaction is $109 with a standard deviation of $295. This suggests it will
6
be practical to segment heavy from light users and examine differences in categories purchased, etc. Table 5 provides descriptive statistics of customer demographics. Again, we see ample variation in age, children, income, and a roughly equal split between male and female head-ofhousehold. [Table 3, 4 and 5 Go Here] Examination of the data reveals that 98% of the regular prices paid on the same day are the same across stores. This suggests that pricing decisions are made at the retailer’s headquarters and are relatively uniform across stores. To construct a price time series, one can use the Transaction_Type
and
Unit_Price
variables
(see
documentation
at
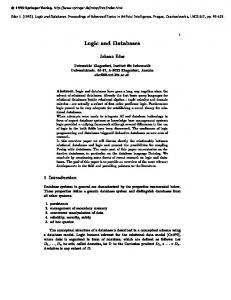
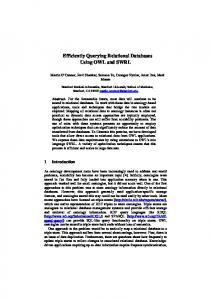
http://www.informs.org/Community/ISMS). Transaction_Type reveals whether the transaction was a product purchase and also identifies possible promotional price discounts. The Unit_Price variable states the price paid or the amount of the promotional price discount. For example, in Figures 1 and 2 we plot the price and sales trends of Apex digital video camera models 763370 and 749912. To prepare these figures, we aggregate across customers to count the number of units sold for the product and the average price paid, per week. While it will be possible to construct weekly price and purchase series for many product models, this will not be possible for infrequently purchased models. Users will find it easier to construct price and sales time series at the brand rather than model level (e.g., Sony digital video cameras rather than each Sony model), and at the monthly rather than weekly level. Or researchers may be able to construct a price series using data collected from other sources such as NPD.com. [Figures 1 and 2 Go Here] 7
2.2 Illustrative Research Issues for ISMS Durables Dataset 1 Given Dataset 1 is panel data at the customer level over time, researchers can study rich purchase decisions such as product adoption (e.g., digital video camera), brand choice (e.g., which brand of digital video camera to purchase), add-ons (e.g., televisions and television stands), multicategory choice (e.g., television equipment and audio equipment) and adoption of on-line purchase channel. Data can also be used to examine issues related to “Black Friday”, the Friday after the Thanksgiving holiday, which has become the much-heralded “kick-off” to the Christmas shopping season. In light of the substantial economic impact of Black Friday, this shopping event deserves closer scrutiny than has been reported in the academic literature and the popular press. The data also contain consumer purchase history on extended service contracts (ESCs) and on product returns. Contributing more than half of the total profits of major electronics retailers, extended service contracts (ESCs) have become a major profit engine for consumer electronics retailers such as Best Buy (BusinessWeek 2004). It is imperative to understand why and how consumers purchase ESCs and how to improve marketing mix decisions. Similarly, allowing consumers to return products encourages them to try a product for which they have huge uncertainty. However, consumers can also abuse the return policy. When too many products are returned, retailers bear significant cost. It therefore is important to understand the fundamental driving force behind product returns and how product returns affect future purchasing. For example, how does product return affect customers’ product adoption and their subsequent purchases? What types of products are more likely to be returned? Retailers provide a platform where manufacturers compete to maximize their long-term profits. Many competitive marketing mix strategies such as new product introductions, (product 8
line) pricing, and advertising can be studied. For example, when Sony lowers the prices on its digital cameras, how does Cannon adjust its prices to defend its position? Static or dynamic models can be developed to measure and test the nature of interactions among firms, to test theories of competition and for policy analysis by simulating behavior under a variety of market environments. Given its panel structure Dataset 1 affords the opportunity to study manufacturer competition using customer-level data. 2.3 Limitations of ISMS Durables Dataset 1 With a six-year observation window and complete household-level transaction records of a large number of electronic durable goods, this dataset is unique. However, it is also subject to limitations. First, it does not contain information on non-price related promotions such as TV advertising, catalogs, store display etc.3 Second, it is from a single retailer. Without information on consumer purchases from other retail outlets, studies on some consumers decisions such as product adoption, upgrade, and replacement could be subject to bias. Third, the dataset includes price paid, but does not provide a “store environment” file, i.e., it does not include prices for all available models at each point in time. One can create a price time series as described earlier by aggregating across the 1176 stores. However, for low-sales items, there may not be enough observations to construct a satisfactory time series. 4 We caution researchers to be aware of these limitations when making assumptions, formulating models, and drawing conclusions. 3. ISMS Durables Dataset 2 3.1 Data Description 3
Users will notice a steep increase in January 2001 and January 2002 sales for several products. We could not
confirm with certainty, but this may be due to special promotions that were run during these months. 4
It is not uncommon in marketing and economics to collect price information from alternative sources.
9
ISMS Durables Dataset 2 features a field experiment for a Christmas promotion run by the same chain as that featured in Dataset 1. The field experiment took place in December 2003 in the form of a direct mail campaign offered at the end of November 2003 to randomly selected households. The promotional offer was as follows: Households received $10 off if they purchased during the promotional time period (12/4 – 12/15). If they did purchase, they would get 10% off on a subsequent purchase, good through the end of December. Roughly half of the 176,961 households in the database (promotion group) received the Christmas holiday promotional mailer; the other half (control group) did not. When running the experiment, the retailer did not know a priori the customer attributes that would lead to the most incremental sales. Thus, the assignment of promotion in the field experiment was truly random. In addition to receipt of and response to the promotion, the data contain approximately 150 descriptors of all customers, covering purchase history prior to the promotion, response to previous promotions, purchase of warranties/extended service, product returns etc. Table 6 provides statistics for a few key variables characterizing the reaction to the Christmas promotion for the promotion and control groups. Mean sales for those receiving the promotional offer is $12.42; for those not receiving the offer it is $9.73.5 The other statistics show the experimental and control groups were equally matched on variables available before the promotion. This of course is as it should be, given the promotion was distributed randomly. [Table 6 Goes Here] 3.2 Research Opportunities and Limitations
5
The average is a lot lower than for dataset 1, Table 4, because a lot of households who received the promotion did
not purchase. Among the purchasers, the average would be much higher.
10
Dataset 2 provides the opportunity to analyze the results of a promotional field test, plus other topics such as the “direct-mail-promotion-prone” consumer. Its most attractive attribute is the field test; hence the most obvious use of the database is to analyze the results of the field test – both predicting the results and understanding them. For example, what are the best methodologies for predicting customer-level incremental sales? What variables best predict incremental sales for this promotion? In addition, since the data contain response to previous promotions – all delivered via direct mail – one could profile the direct-mail-deal-prone customer (see Blattberg and Neslin (1990, Chapter 3) for a summary of research on the deal-prone consumer in the context of CPG promotions). One limitation is that the data are not longitudinal in the sense of Dataset 1. The RFM variables, etc., precede the field experiment, but the data do not contain week-by-week purchase histories of each customer. While Datasets 1 and 2 are offered by the same company, the data cannot be linked - the customers’ IDs in the two datasets do not have a one-to-one mapping. 4. Process for Obtaining the Databases The databases are provided by the INFORMS Society of Marketing Science (ISMS), (http://www.informs.org/Community/ISMS ). The distribution of the data is controlled to ensure its use is consistent with ISMS’s mission of enabling the development, dissemination, and implementation of research based on marketing science approaches. Database documentation, purchase agreement, open forum, working paper collection, and downloading instructions are available at http://www.informs.org/Community/ISMS. 5. Summary
11
In sum, ISMS makes available to the marketing science community two durable goods datasets – a panel database and a field test database. We hope these databases will spark a major acceleration in research on durable goods that will benefit the practice of marketing for many years to come.
12
References 1. Blattberg, R., S. A. Neslin. 1990. Sales Promotions: Concepts, Methods and Strategies. Prentice Hall, Englewood Cliffs, New Jersey. 2. Business Week. 2004. The Warranty Windfall. Dec. 20th. http://www.businessweek.com/magazine/content/04_51/b3913110_mz020.htm. 3. Federal Reserve Bank of St. Louis. 2009. Personal Consumption Expenditures: Durable Goods. Technical Report.
13
Table 1: Number of Observations of Different Types of Transactions (ISMS Durable Dataset 1) Table 1A: Counts across All Categories Transaction Type
All Categories 139,580 14,724 15,033 2,437 1,452 36 173,262
Product Purchases Product Returns Extended Service Contract Purchases Extended Service Contract Returns Product Purchases with Discount Miscellaneous Transactions Total Transactions
Table 1B: Counts Separately for Major Categories Transaction Type
Audio
DVS a
Mobile Imaging
Music
Product Purchases Product Returns Extended Service Contract Purchases Extended Service Contract Returns Product Purchases with Discount Miscellaneous Transactions Total Transactions
17,876 2,102 2,168 313 183 0 22,642
3,082 540 524 110 31 0 4,287
18,098 1,834 2,439 394 111 0 22,876
14,008 759 328 24 60 0 15,179
Transaction Type Product Purchases Product Returns Extended Service Contract Purchases Extended Service Contract Returns Product Purchases with Discount Miscellaneous Transactions Total Transactions
P*S*T b 22,889 2,796 1,101 194 128 0 27,108
PC Hardware 12,601 1,494 2,716 356 307 0 17,474
TV 13,116 1,449 2,219 251 259 0 17,294
10,300 1,104 1,266 126 141 0 12,937
Video Wireless Hardware 9,762 5,393 1,132 818 1,405 490 196 121 80 54 0 0 12,575 6,876
a. DVS includes direct TV system/accessories, satellite dishes, digital video recorders, etc. b. P*S*T stands for products like computer accessories, cables, computer media, etc. See documentation for detailed info about the category and sub-category specifications.
14
Table 2: Descriptive Statistics for Sub-Categories (ISMS Durable Dataset 1)
Category:
Imaging
Imaging
Sub-Category:
Digital Camera
Camcorder
1,953 2,524 20 $311.95 $71.27 22.1% 11.9% 3.4%
# of Customers # of Transactions # of Brands/Models Average Price Paid Average Price Paid for ESC % of Product Purchases with ESC % of Product Purchases Returned % of Product Purchases Made Online
Category: Sub-Category: # of Customers # of Transactions # of Brands/Models Average Price Paid for Product Average Price Paid for ESC % of Product Purchases with ESC % of Product Purchases Returned % of Product Purchases Made Online
Video Hardware VCR Home 1,963 3,029 21 $105.65 $29.75 11.6% 8.2% 0.83%
Imaging Television
Video Hardware
TV
Digital Video
1,604 3,058 11 $475.58 $101.17 22.9% 8.4%
Camcorder Accessories/ Batteries 1,020 1,456 25 $57.01 NA 0 10.4%
7,040 17,294 67 $370.04 $147.13 12.8% 8.4%
3,489 6,554 35 $165.32 $35.15 15.4% 10.7%
0.33%
0.76%
0.39%
1.62%
Music
PC Hardware
PC Hardware
Wireless
Music
Desktop
Notebook
Wireless
3,902 15,179 NA $39.65 $23.73 2.2% 5.0%
2,443 5,074 14 $738.68 $223.11 22.6% 8.1%
911 2,320 12 $1221.70 $278.32 22.6% 9.8%
2,721 6,876 NA $91.16 $52.85 7.1% 11.9%
3.3%
0.26%
0.34%
0.33%
15
Table 3: Market Basket Statistics for the PC Hardware Category* (ISMS Durables Dataset 1) Scanner
PDA
Notebook Desktop √
Printer √ √
Monitor √
√ √ √ √ √ √ √
√ √ √
√ √
√ √ √ √ √
√ √
# 1287 908 501 394 390 331 264 232 174 114 93 92
% 24.4% 17.2% 9.5% 7.5% 7.4% 6.3% 5.0% 4.4% 3.3% 2.2% 1.8% 1.7%
Cum % 24.4% 51.7% 51.2% 58.7% 66.1% 72.4% 77.4% 81.8% 85.1% 87.3% 89.0% 90.8%
* Most popular combinations purchased over the period of observation, representing 4780 of the 5266 customers who purchased PC Hardware.
Table 4: Descriptive Statistics for Household Purchases (ISMS Durable Dataset 1)
Variable
Mean
Average Expenditure per Shopping Trip Average Expenditure per Transaction Average # of Items Purchased per Trip Average # of Items Purchased per Transaction Average # of Purchase Trips per Household Average # of Purchase Transactions per Household Average Price Paid per Item Average Amount Spent on Holiday Shopping a # of Purchases of Gift Card # of Online Purchases # of Different Items Purchased a.
$317.02 $109.23 2.39 0.82 2.99 8.69 $108.91 $189.77 1487 2550 22210
Standard Deviation $497.52 $295.50 3.79 1.38 2.78 11.67 $295.42 $352.71 NA NA NA
Holiday shopping refers to purchases made on Black Friday and Christmas and for customers who bought something.
16
Table 5: Descriptive Statistics for Household Demographics (ISMS Durable Dataset 1)
Variable
Observations a
Age_Household.Head Gender_Household.Head With Child(ren) or not # of Children Income
Standard Minimum Maximum Deviation 48.42 15.17 18 99 b 0.64 0.48 0 1 0.66 .47 0 1 0.40 0.80 0 6 c 5.68 2.36 1 9
Mean
16,384 16,566 8,451 19,936 16,811
a. Demographic information is missing for some customers. b. Male is coded as 1 and female is coded as 0. c. Income level of the household is coded at 1-9 scale where larger number indicates higher income.
17
Table 6: Descriptive Statistics of ISMS Durables Dataset 2
Sample Size Average Sales Amount During December Promotion period (across both purchase and nonpurchase occasions) # of Transactions in previous 12 months # of Large ticket item purchases in previous 12 months # of Small ticket item purchases in previous 12 months # of ESPs purchased in previous 12 months
Control Group (Did not Receive Promotional Offer) 88,625
Treatment Group (Received Promotional Offer) 88,336
$9.73 ($104.14)a, b
$12.42 ($120.85)
1.73 (3.44)
1.74 (3.59)
0.17 (0.51)
0.17 (0.50)
0.96 (3.57)
0.99 (4.10)
0.16 (0.54)
0.16 (0.54)
a. Standard Deviations are reported in Parentheses. b. The average is lower than the “Average Expenditure per Shopping Trip” in dataset 1 (Table 4) because many households who received the promotion in dataset 2 did not make purchases.
18
Figure 1: Weekly Unit Sales Volume and Price Trend for Apex Digital Video Model 763370 (ISMS Durables Dataset 1)
Figure 2: Weekly Unit Sales Volume and Price Trend for Apex Digital Video Model 749912 (ISMS Durables Dataset 1)
19
20