Unwind the callstack across C/C++, Fortran,. Python, Java, UPC, etc. ⢠Explore applicaXon performance at all levels. ⢠Close the loop with developers for more ...
Isolating Runtime Faults with Callstack Debugging using TAU John C. Linford1, Sameer Shende1, Allen D. Malony1, Andrew Wissink2, Stephen Adamec3 1ParaTools,
Inc. Eugene, OR, USA, 21093 2Ames
Research Center Moffett Field, CA, USA, 90435 3University
of Alabama at Birmingham Birmingham, AL, USA, 35209
Outline • • • • •
Brief overview of TAU MulG-‐language callstack debugging with TAU Design and implementaGon Examples: CREATE-‐AV Helios and Kestrel Summary and conclusions
2
Brief overview of TAU
3
TAU is a performance evaluaGon tool • TAU supports parallel profiling and tracing • Profiling: how much (me was spent in each rou4ne • Tracing: when the events take place in each process • TAU can measure hardware performance counters • TAU can automaGcally instrument your source code • Rou4nes, loops, I/O, memory, phases, etc. • TAU runs on all HPC plaTorms and it is free • TAU has instrumentaGon, measurement and analysis tools • ParaProf, PerfExplorer, Jumpshot, etc. • TAU has performance database technology (TAUdb) 4
For more informaGon TAU Website: hYp://tau.uoregon.edu/ • SoEware download • Release notes • Documenta4on TAU LiveDVD: hYp://www.hpclinux.com/ • Boot up on your laptop or desktop • Includes TAU and variety of other packages • Include documenta4on and tutorial slides
5
Multi-language callstack debugging with TAU
6
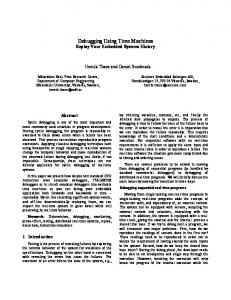
Segfault! What do you do?
Python Callstack
C++
MPI
Fortran
7
Debugging challenges • ExecuGon text output rarely sufficient • Core files aren’t much help for 10k processes • What if the fault occurred in a DSO? • Most debuggers are monolingual • Developers need to reproduce the crash to fix it, but program inputs are sensiGve or proprietary
8
TAU has already solved most of these • Rich performance informaGon • Scales to 100k processes and beyond • Highly efficient packed profile format • Maintains and updates address maps for DSOs • C, C++, CUDA, Fortran, UPC, Python, Java, etc. • With tau_exec, recompile not required 9
TAU callstack debugging has two goals • Assist in debugging mulG-‐language applicaGons • Unwind the callstack across C/C++, Fortran, Python, Java, UPC, etc. • Explore applica4on performance at all levels • Close the loop with developers for more rapid turnaround of bug fixes • Compact, portable, informa4ve reports • Independent of sensi4ve or proprietary inputs
10
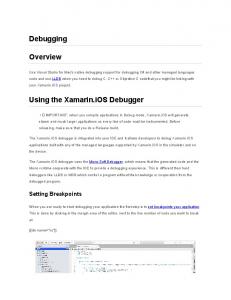
Callstack unwinding is the key to debugging
PyEval_EvalCode
aero.py:328
… Solver::iterate …
… Solver.cpp:19 …
TIMESTEP
JCL1.F:1798
FPE 11
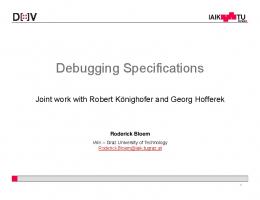
Performance informaGon is retained
PyEval_EvalCode
Started on rank 13
… Solver::iterate …
… MPI_Recv read 451k …
TIMESTEP
Allocated 3298k heap
FPE
954s runtime 12
The debugger can answer these quesGons 1. Where and when did the program fail? 2. What was the nature of the fault? 3. What was the applicaGon’s heap memory uGlizaGon? 4. Where there any memory leaks in the applicaGon? 5. What were the applicaGon’s performance characterisGcs? 6. How much Gme did the applicaGon spend in I/O and communicaGon operaGons? 13
Design and Implementation
14
Signal handler intercepts the fault signal • export TAU_TRACK_SIGNALS=1 • tau_exec registers a signal handler • Error signal triggers callstack unwind tau_exec!
15
TAU unwinds the callstack of each thread • GLIBC backtrace API and GNU binuGls determine rouGne name, file name, source line number • A profile file is created for each thread profile.0.0.0 profile.1.0.0 …
16
TAU orchestrates a graceful shutdown
• Profile files containing diagnosGc informaGon are created for all threads, healthy or otherwise • Healthy threads exit gracefully
17
Examples: CREATE-AV Helios and Kestrel
18
CREATE-‐AV Helios and Kestrel
19
Helios and Kestrel somware architecture
20
Build with debugging symbols (-‐g) for a more informaGve backtrace
21
Create a wrapper file to see Python events import tau!
wrapper.py
def OurMain():! import samarcrun! tau.run('OurMain()')!
22
Set environment variables and run with tau_exec Normal Execution mpirun -np {n} pyMPI ./samarcrun.py Debugging with TAU export TAU_TRACK_SIGNALS=1 export TAU_CALLPATH_DEPTH=100 mpirun -‐np {n} tau_exec -‐T python pyMPI wrapper.py Debugging with TAU + I/O and Memory Tracking mpirun -‐np {n} tau_exec -‐T python pyMPI -‐io -‐memory \ wrapper.py 23
TAU generates profile data at Gme of failure
24
Use ParaProf to explore the profile data
25
Right-‐click the thread you want to explore
26
Use the Metadata window to locate the source line that caused the error
27
ParaProf highlights the erroneous line
28
Peak read bandwidth in Helios
29
A segmentaGon fault in Kestrel with memory and I/O diagnosGcs
30
Inclusive Gme spent in Kestrel code regions
31
Exclusive Gme spent in Kestrel code regions
32
Summary and conclusions 1. TAU callstack debugging isolates errors in mulG-‐language HPC somware by intercepGng signals at runGme 2. Run codes with tau_exec to register the TAU signal handler, create profile files, and shutdown gracefully 3. The profile can be sent to developers when sensiGve or proprietary inputs cannot be provided 4. Developers use ParaProf to analyze the fault locaGon and runGme performance data in the profiles 5. Memory use, IO, and runGme performance are recorded 6. No recompilaGon necessary
33
Acknowledgments
This work was supported by the DoD High Performance CompuGng ModernizaGon Program (HPCMP) User ProducGvity Enhancement, Technology Transfer and Training (PETTT) program and through support provided by the DoD HPCMO to the HIARMS InsGtute and the CREATE program.