Phyllanthus Columnaris, European Journal of Scientific. Research, 2009, 28(1), 76-81. 9. Habib MR, Nikkon F, Rahman ME, Karim MR, Isolation of stigmasterol ...
Anjoo Kamboj et al. /BioMedRx 2013,1(3),235-238
Research Article
Available online through http://jprsolutions.info
Isolation and Characterization of Bioactive Compounds from the Petroleum Ether Extracts of Leaves of Xanthium Strumarium Linn. Anjoo Kamboj1*, Pooja Atri1, Ajay Kumar Saluja2 1.
Chandigarh College of Pharmacy, Landran, Mohali (Punjab), India. 2. A.R. College of Pharmacy, V.V Nagar, Gujarat,India
Received on:17-12-2012; Revised on: 19-01-2013; Accepted on:10-02-2013 ABSTRACT Objective: Xanthium strumarium Linn. belonging to the family compositae, commonly known as ‘burweed’ and chotagokhru in hindi contains a number of phytoconstituents such as alkaloids, phytosterols, glycosides, bioflavonoids, phenols, terpenoids and sugar. The objective of the present study was to isolate and characterize phytoconstituents from the petroleum ether extract of leaves of Xanthium strumarium Linn. Methods: Petroleum ether extract was saponified with alcoholic KOH and then subjected to column chromatography and eluted with different solvents of increasing polarity, composed of hexane, chloroform, ethyl acetate to isolate the constituents. Isolated compounds were purified by PTLC, CC and recrystallization method. The structure of the isolated compounds was established on the basis of spectroscopic evidences (IR, UV, 1HNMR, 13CNMR, MS). Results: Phytosterol such as stigmasterol, ß-sitosterol and two long chain alcohols pentatriacontan-1-ol and tritriacontanol isolated from the petroleum ether extract of leaves of the plant. Conclusions: Xanthium strumarium contains stigmasterol, ß-sitosterol, pentatriacontan-1-ol and tritriacontanol which are responsible for various pharmacological activities of the plant. Keywords: Xanthium strumarium, stigamasterol, ß-sitosterol, compositae, phytosterols, tritriacontanol. INTRODUCTION Xanthium strumarium L. (Family: Compositae) a medicinal plant commonly found as a weed, is widely distributed in North America, Brazil, China, Malaysia and hotter parts of India. Extract of the whole plant, especially leaves, stems, roots , fruits & seeds have been applied traditional medicine for treatment of leucoderma, poisonous bites of insects, epilepsy, salivation, long- standing cases of malaria, rheumatism, tuberculosis, allergic rhinitis, sinitis, urticaria, constipation, diarrhea, leprosy, lumbgo, bacterial and fungal infection. Most of the pharmacological effects can be explained by the constituents like sesquiterpene lactones, glycoside, phenols, polysterols present in all plant parts. The main objective of the present study was to isolate and characterize the bioactive principles from the petroleum ether extract of Xanthium strumarium leaves. [1-3] MATERIALS & METHODS
barium and Museum (RHMF), NISCAIR, New Delhi. A herbarium sample of this plant is preserved in the department. The plant parts was separated manually and dried under shade, coarsely powdered, sieved, weighed and stored in airtight container and subsequently referred as powdered drug and was used for the extraction. Extraction and Isolation Powdered leaves of Xanthium strumarium was defatted with petroleum ether (600-800C) in a soxhlet apparatus. The solvent was recovered under pressure to obtained dark green mass. The petroleum ether extract of leaves of the plant was saponified using 1M alcoholic KOH, to remove fatty material and then subsequently picked up in petroleum ether and the solvent was evaporated to yield unsaponified matter. This fraction contains lesser number of components than the unsaponified extract [4].
Collection, Authentication and Preparation of Plant material Xanthium strumarium L. were collected from Landran, Mohali (Punjab) in month of October. The plant was originally authenticated Chromatographic Separation by Dr. H. B. Singh, Chief Scientist and Head, Raw Materials Her- A small quantity of unsaponified matter was dissolved in the petroleum ether and this solution was spotted on TLC plates using precoated aluminium with silica gel 60 F254. Then the TLC plates were run in *Corresponding author. specific solvent system and viewed individually under UV light Anjoo Kamboj and also (5%) sulphuric acid in methanol reagent. Through several Chandigarh College of Pharmacy, Landran, Mohali (Punjab), India. BioMedRx Vol.1 Issue 3.March 2013
235-238
Anjoo Kamboj et al. /BioMedRx 2013,1(3),235-238 pilot experiments it was found that the compounds CompoundA of unsaponifiable fraction were separated by the solvent system Compound A is a white needle shape crystalline powder (250 mg), 0 0 of chloroform and ethanol in the proportion of 9.8: 0.2. melting point: 156 -160 C, λmax in ethanol: 253. In hexane Rf is 0.29 and The chromatograms when developed in iodine chamber yielded chloroform: ethanol (9.8:0.2) Rf is 0.46. The IR spectra showed ab-1 -1 six to seven spots respectively and three spots appears reddish sorption peaks at 3426.42cm (O-H stretching); 2939.31 cm (=C-H -1 -1 brown soon turns to purple or violet indicate zones for steroi- Str.), 2926.23 cm and 2867.84 cm (asymmetric and symmetric -C-H -1 dal nucleus. Column chromatography of petroleum ether extract was stretching of CH2 group); 1641.6 cm (C=C absorption); other bands -1 -1 conducted using silica gel (mesh 60-120) that was packed using wet includes 1463.65 cm (CH2 bending); 1389.71 cm (CH3 bending) and -1 packing method in hexane. The column was run with using hexane 1039.29 cm (C-C stretching of cycloalkane). Mass spectra of this and ethyl acetate by gradient elution technique. TLC was used to compound suggested that its molecular mass is 412 (M.F C29H48O) monitor the eluates. 68 fractions each of 25ml were collected. Similar having characteristic fragments observed at m/z: 367, 271, 255, 229, fractions were pooled together and concentrated. Further purifica- 189, 175, 161, 133, 121, and 105. Peak at m/z 273 is due to loss of C10H19 tion is carried out using preparative TLC. Spots were identified, scraped (M-139). The dehydration of fragment m/z 273 yield m/z 255, which on and elutes using petroleum ether and chloroform as a solvents. Frac- successive dealkylation would yield ions at m/z 203, 149, 133, 121, tion 8-15 (hexane: ethyl acetate; 95:5) were pooled together, concen- 105. trated and purified as compound A, fraction 16-20 (hexane: ethyl ac1 etate; 90:10) were pooled together, concentrated and purified as com- H- NMR has given signals at δ 5.34 (1H, br (S), H-6) due to H-6 pound B and fractions 30-50 (hexane: ethyl acetate; 85:15) were pooled olefinic protons, δ 5.14 (1H, q, H-23), 5.02 (1H, q, H-22), 3.52 (1H, tdd, together, concentrated and two compounds were isolated named as J=4.66, H-3) and six methyl protons also appeared at δ 0.697, 0.786compound C and D. finally purification is carried out by recrystalliza- 0.822 (2 CH3), 0.9127, 0.9843 and 1.014. tion method [4-6]. Compound B Finally eluates yielded a single spot when subjected to TLC using The compound B is obtained as colorless needles (100 mg), melting 0 0 several solvents systems including chloroform: ethanol (9.8:0.2), chlo- point: 136 -138 C, λmax in ethanol: 208. In hexane Rf 0.23 and chlororoform: ethyl acetate (9.8: 0.2), hexane. These four compounds were form: ethanol (9.8:0.2) Rf 0.58. The IR spectra showed absorption further subjected to IR, 1H NMR (400MHz), 13C-NMR (100MHz) and peaks at 3432 cm-1(O-H stretching); 2937 cm-1 (=C-H Str.), 2849 cm-1 and 2844 cm-1 (aliphatic C-H stretching); 1642 cm-1(C=C absorption); MS to ascertain the chemical structure. other includes 1465 cm-1 (CH2 bending for cyclic (CH2)n); 1381.6 Test for Alcohol cm-1(CH3 bending) and 1050 cm-1(C-C stretching of cycloalkane). Mass 4g of cerric ammonium nitrate was dissolved in 10ml of 2N HNO3 on spectra of this compound suggested that its molecular mass is 414 mild heating. A few crystals of isolated compounds were dissolved (M.F C29H50O) having characteristic fragments observed at m/z: 414, in0.5ml of dioxane. The solution was added to 0.5ml of cerric ammo- 329, 273, 255, 243, 203,149,121 and 105. 1H- NMR has given signals at nium nitrate reagent and diluted to 1 ml with dioxane and shaken well. δ 5.277 (1H, br, S, H-6), 4.077 (1H, m, H-3), and six methyl protons The developed yellow to red color indicates the presence of an alco- appeared at d 1.06-0.97 (6H, m, H-18, 19), 0.924-0.801 (9H, m, H-26, 27, holic hydroxyl group. 29), 0.67 (3H, s, H-21). Tests for Steroid Salkowski reaction: A few crystals were dissolved in chloroform and a few drops of concentrated sulphuric acid were added to the solution. Reddish color in the upper layer indicates the presence of steroid. Liebermann-burchard reaction: A few crystals were dissolved in chloroform and a few drops of concentrated sulfuric acid were added to it followed by addition of 2-3 drops of acetic anhydride. Solution turned violet blue and finally green. Spectroscopic Characterization: Among the spectroscopic techniques IR, 1H-NMR, 13C-NMR and MS were carried out. The infrared spectrum was recorded on FTIR Perkin Elmer, 1H-NMR and 13C-NMR spectra were recorded using CDCl3 as a solvent on Bruker Advance 400NMR Spectrometer SAIF Panjab University, Chandigarh.
Compound C The compound C is white amorphous compound (100 mg), melting point: 880-910C. In chloroform Rf 0.34 and chloroform: ethyl acetate (3:2) Rf 0.59. The IR spectra showed absorption peaks at 3306.57 cm-1(O-H stretching); 2917.35 cm-1 and 2848.79 cm-1(aliphatic C-H stretching); other includes 1473.13,1462.65 cm-1 (CH2 bending vibration); 1071.93, 1061.67 cm-1 (C-O stretching) and 730.33, 719.27 cm-1 (a long aliphatic chain). Mass spectra of this compound suggested that its molecular mass is 480 (M.F C33H68O) having characteristic fragments observed at m/z: 480, 453, 338, 321,284, 242, 213, 155, 141 and 112. 1H- NMR has given signals at δ 3.64 (2H, t, J=6.6, H-1), 1.52 (8H, m, 4xCH2), 1.25 (54H, br s, 27xCH2), 0.88 (3H, m, H-33). Compound D The compound D is white amorphous compound (100 mg), melting point: 840-890C, λmax in ethanol: 288. In chloroform Rf 0.43 and chloroform: ethyl acetate (3:1) Rf 0.62. The IR spectra showed absorption peaks at 3306.57cm-1(O-H stretching); 2848.94 cm-1 and 2917.40 cm-1
BioMedRx Vol.1 Issue 3.March 2013
235-238
Anjoo Kamboj et al. /BioMedRx 2013,1(3),235-238 (aliphatic C-H stretching); other includes 1473.04 cm-1, 1462.66 cm-1 (CH2 bending); 1061.76 cm-1 (C-O stretching) and 730.13, 719.25 cm-1 (long aliphatic chain). Mass spectra of this compound suggested that its molecular mass is 508 (M.F C35H72O) having characteristic fragments observed at m/z: 507, 475, 435, 361, 321, 285, 257, 227, 210 and 133. 1H- NMR has given signals at δ 3.62 (2H, t, j=6.6, H-1), 2.03 (1H, s,-CH2OH), 1.67 (1H, s), 1.25 (64H, br s, 32xCH2), 0.88 (3H, m, H33).
dealkylation would yield ions at m/z 243, 203, 149,121, 105 respectively. The IR spectra showed absorption peaks at 3432 cm-1(O-H stretching); 2937 cm-1 (=C-H Str.), 2849 cm-1 and 2844 cm-1 (aliphatic C-H stretching); 1642 cm-1(C=C absorption); other includes 1465 cm-1 (CH2 bending for cyclic (CH2)n); 1381.6 cm-1(CH3 bending) and 1050 cm-1(C-C stretching of cycloalkane) [6-10].
RESULT & DISCUSSION : Four compounds isolated from the petroleum ether extracts of leaves of Xanthium strumarium by increasing polarity of solvent system (hexane: ethyl acetate) using silica gel. The 1H- NMR and other spectral data for these compounds revealed that compound A and B belong to sterol group. Compounds C and D were identified as long chain alcohols from their physical constants and spectral data. Compound A and B isolated as white powder. The melting point of A and B were 1560-1600C & 1340-1380C respectively and both showed positive results in alcohol test and in all the tests of steroid. Mass spectrum of A and B showed a parent molecular ion peak [M+H]+ at m/z 412 and 414 respectively which corresponds to the molecular formula C29H48O and C29H50O [6-10]. The compounds were characterized on the basis of spectroscopic analysis and comparison with reported data in literature. The melting point of compound A and B were in good agreement with melting point given for stigmasterol and ß-sitosterol in the literature. The molecular formula was established as C29H48O by high resolution mass spectrometry which indicated M+ peak at m/z 412 (calculated for C29H48O, 412.3926). The fragmentation pattern was in line with that of sterols. The IR spectrum showed absorption bands at 3426.42 cm-1 that is characteristic of O-H stretching. Absorption at 2939.31 cm-1 is due to =C-H Stretching, 2926.23 cm-1and 2867.84 cm-1 is due to C-H stretching, frequency at 1641.6 cm-1is due to C=C stretching; other bands includes 1463.65 cm-1 due to CH2 bending; 1389.71 cm-1 CH3 bending and 1039.29 cm-1 signifies C-C stretching of cycloalkane. In 1H-NMR spectrum of compound A, H-3 proton appeared as a triplet of a double doublet (tdd) at δ 3.53 and H-6 olefinic protons showed a broad singlet at δ 5.34. Two olefinic protons appeared downfield at δ 5.14(m) and d 5.02 (m) which was identical with the chemical shift of H-22 and H-23, respectively of stigmasterol. Six methyl protons also appeared at δ 0.697, 0.786-0.822 (2CH3), 0.9127, 0.9843 and 1.0104. The nature of oxygen was shown to be hydroxyl group as depicted by IR spectrum (3426.42cm ) [6-10]. -1
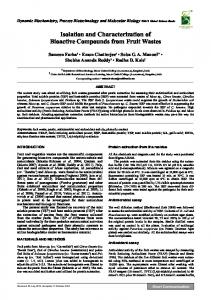
Similarly from 1H-NMR spectrum of compound B it was seen that H3 proton appeared at δ 4.077 triplet of a double doublet (tdd) and H6 olefinic protons showed a broad singlet at δ 5.277. Moreover, six methyl protons appeared at δ 0.67, 0.801-0.924 (3 CH3), 0.97-1.06 (2 CH3). These assignments are in good agreement for the structure of ß-sitosterol. The molecular ion peaks were given at m/z 414 and the characteristic ion peak at m/z 273 because of loss of C 10H21 (M-141). The dehydration of fragment m/z 245, which on successive
HO
Sitosterol (C 29H50O; Mol.Wt.414.71) Compound C was isolated as white amorphous powder. The mass spectral data of the compound gave a molecular formula C33H68O [m/z 480]. IR spectra showed absorption peaks at 3306.57 cm-1 indicate presence of alcohol group and band at 730.33, 719.27 cm-1 was due to long aliphatic nature of molecule. 1H- NMR spectra showed presence of triplet at δ H 0.88 for the three end protons while the methylene group α to the hydroxyl group or carbinolic proton (CH2OH) as a triplet at δH 3.64. The rest of methylene protons merged into a broad singlet at δH 1.25. The methylene protons ß- to carbinolic group resonated at δH 1.52 with OH proton. Compound D was isolated as white amorphous powder. The mass spectral data of the compound gave a molecular formula C35H72O [m/z 508]. IR spectra showed absorption peaks at 3306.57cm-1 indi-
BioMedRx Vol.1 Issue 3.March 2013
235-238
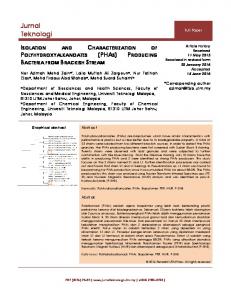
Anjoo Kamboj et al. /BioMedRx 2013,1(3),235-238 cate presence of alcohol group and band at 730.33, 719.27 cm-1 was due to long aliphatic nature of molecule. 1H- NMR spectra showed presence of triplet at δH 0.86 for the three end protons while the methylene group α to the hydroxyl group or carbinolic proton (CH2OH) as a triplet at δH 3.62 (J=6.6Hz). The rest of methylene protons merged into a broad singlet at δH 1.27. The methylene protons ß- to carbinolic group resonated at δH 1.51 with OH proton. HO
Tritriacontan-1-ol Pentatriacontan-1-ol CONCLUSION The isolation and identification of compound A-D from the petroleum ether extract leaves of Xanthium strumarium was the first ever reported from this plant. From the physical, chemical and spectral evidences compound A-D were confirmed as stigmasterol, beta-sitosterol, tritriacontanol and pentatriacontan-1-ol respectively. REFERENCES 1. Kamboj A, Saluja AK, Phytopharmacological review of Xanthium strumarium L. (Cocklebur), International j of Green Pharmacy, 2010, 129-139. 2. Gill LS. In ‘The ethnomedical uses of plants in Nigeria.’ Published by University of Benin Press, University of Benin, Benin city, Edo State, 1992, 46: 43.
3.
Sofowora A, In ‘Medical plants and traditional medicine in Africa.’ Published by Spectrum books Ltd. Ibadan, 1993, 156-158. 4. Stahl E, Thin Layer Chromatography: A Laboratory Handbook. 2 nd edition, Springer, New York, 1969. ISBN: 0387047360. 5. Harborne JB, Phytochemical Methods: A Guide to Modern Techniques of Plant Analysis, 3rd Edn., chapman and Hall: London. ISBN: 0-412-57270-2 (1998) 302. 6. Peach K, Tracey MV, Modern methods of plant Analysis. 1st Edn, Springer Varlag, Berlin, 1955, 328-373. 7. Pateh UU, Haruna AK, Garba M, Iliya I, Sule IM, Abubakar MS, Ambi AA, Isolation of stigmasterol, ß-sitosterol and 2Hydroxyhexadecanoic acid methyl ester from the rhizomes of Stylochiton Lancifolius Pyer and Kotchy (Aeaceae), Nigerian journal of Pharmaceutical Sciences, 2009, 7(1), 19-25. 8. Jamal AK, Yaacob WA, Din LB, A Chemical study on Phyllanthus Columnaris, European Journal of Scientific Research, 2009, 28(1), 76-81. 9. Habib MR, Nikkon F, Rahman ME, Karim MR, Isolation of stigmasterol and beta sitosterol from methanolic extract of root of bark of Calotropis gigantea (Linn), Pak. J. Biol. Sci., 2007, 10, 4174-4176. 10. Rao GV, Rao KS, Annamalai T, Radhakrishnan N, Mukhopadhyay T, Chemical constituents and mushroom tyrosinase inhibition activity of chloroxylon swietenia leaves, Turk J Chem, 2009, 32, 521-526.
Source of support: Nil, Conflict of interest: None Declared
BioMedRx Vol.1 Issue 3.March 2013
235-238