Nov 10, 1989 - Copyright c 1990 Pergamon Press plc ... Department of Ecology, Ethology and Evolution, University of Illinois at Urbana-Champaign,.
I rrron Rer. Vol. 30, No. 6. PP 807-816. 1990 Pnnted m Great Britain All rights reserved
Copyright
c
0~42-69~9~90 $3.00 + 0.00 1990 Pergamon Press plc
ISOLATION, DNA SEQUENCE AND EVOLUTION OF A COLOR VISUAL PIGMENT GENE OF THE BLIND CAVE FISH ASTYANAX FASCIA7”US RUTH YOKOYAMA and SHOZO YOKOYAMA
Department
of Ecology, Ethology and Evolution, University of Illinois at Urbana-Champaign, Champaign, IL 6f820, U.S.A. (Received 14 September 1989; in revisedform10 November 1989)
Abstract-Visual pigment genes have been isolated from a Mexican blind cave fish, Asryanaxfisciurus. We report here the DNA sequence of one of these genes, which has 70% nucleotide similarity with both the human red and green pigment genes. This gene appears capable of encoding a functional protein and is probably responsible for the green-sensitive pigment found in the pineal organ of the blind cave fish (Tabata, 1982). The pattern of nucleotide substitutions most likely reflects functional adaptation of the visual pigment gene during the past 400 million years of fish evolution. Mexican characin
Color vision
Genomic sequence
Functional adap-
the two types of color visual pigments (Levine and MacNichol, 1982). Within the last one Myr, eyed river fish Astyanax fasciatus, formerly known as A. mexicanus, gave rise to a series of cavernicolous populations (Avise and Selander, 1972; Chakraborty and Nei, 1974; see afso Wilkens, 1988). These geographically isolated cave fish A. f~sciaf~s have become morphologically very different from the ancestral river fish, having lost both body pigmentation and eyesight. Despite the initial expectation of nonfunctional visual pigments, two separate absorption spectral responses at 494 and 525 nm have been detected in the pineal organ of the blind cave fish (Tabata, 1982), exhibiting the existence of functional rhodopsin and green-sensitive pigments. As a first step towards understanding evolution of the visual pigment genes, especially in the context of possible loss of function, we have cloned and sequenced a gene from the blind cave fish. This gene and other vertebrate visual pigment genes are compared and subjected to statistical analyses to study the patterns of nucleotide substitutions.
INTRODUCTION
has profound effects on the evolution of organisms by affecting survivorship through such behaviors as mating preference, foraging strategies and prey preference. Vision begins when a photon is absorbed by a visual pigment. Each pigment is characterized by its wavelength of maximal absorption. Rhodopsin is responsible for vision in dim light and has a maximal absorption at a wavelength of 495 nm. Color vision in humans is mediated by one short and two long wavelength-sensitive pigments which have absorption maxima at approx. 420 nm (blue-sensitive), 530 nm (green-sensitive) and 560 nm (red-sensitive) (Nathans, 1987). The latter two genes share 98% nucleotide similarity and seem to have diverged about 30 million years (Myr) ago, whereas the long and short wavelength pigment genes diverged more than 500 Myr ago (Nathans, Thomas & Hogness, 1986; Yokoyama & Yokoyama, 1988). To date, the vertebrate color visual pigment genes have been characterized only in humans (Nathans et al., 1986). Originating early in vertebrate evolution, fish are crucial for studying the evolution of vertebrate color vision, Since fish and mammalian lineages diverged about 400 Myr ago, it is expected that many fish will still have both long and short wavelengthsensitive pigments. In fact, in addition to the highly conserved rhodopsin, many fish contain
Molecular evolution
Vision
MATERIALS AND METHODS
Genomic DNA preparation Genomic DNAs were prepared from commercially supplied blind cave fish, Asfyanax
807
808
RUTH YOKOVAMA and SHOZO YOUOYAMA
fasciatus, by using a modified procedure of Blin and Stafford (1976). Essentially, fish were frozen
in liquid nitrogen and the tissue homogenized into a fine powder. The powder was then transferred to 100 mM EDTA, 2% Sarkosyl and 100 pg/ml proteinase K and incubated for 16-l 8 hr at 50°C. The DNA was extracted 3 times with phenol, 3 times with chloroform: isoamyl alcohol (24: 1) and precipitated with ethanol. DNA probe labelling and hybridizations
Three visual pigment cDNA clones, generously provided by Dr J. Nathans, were used as probes: bovine rhodopsin (bd20, Nathans & Hogness, 1983), human red (hs7, Nathans et al., 1986) and human blue (hs37, Nathans et al., 1986). The Eco RI inserts of these complete cDNA clones were excised and electroeluted from a gel, using an IBI gel electroeluter, and labelled with “P dCTP by nick translation (Rigby, Dieckmann, Rhodes & Berg, 1977). About 10 pg per lane of Eco RI- or Hind III-digested genomic DNA were electrophoresed on a 0.8% agarose gel and blotted onto nylon filters ~Southern, 1975). Filters were hybridized for 18-24 hr at 55°C with each nick translated cDNA probe in hybridization buffer [4 x SSC (SSC contains 0.15 M sodium chloride and 0.015 M sodium citrate at pH 7), 2.5 x Denhardt solution, 50 mM sodium phosphate, pH 6.5, and 100 pg/ml herring sperm DNA]. The hybridized filters were washed extensively with 2 x SSC at room temperature and then for at least 1 hr at 55°C in 1 x SSC for the hybridizations to the human red and bovine rhodopsin probes and 65°C in 2 x SSC for the hybridization to the human blue probe. Plaque hybridization was conducted by using the method of Benton and Davis (1977) under similar conditions as the Southern hybridizations, except for the addition of 0.5% SDS and increase of Denhardt solution to 10 x in the hybridization solution. Washing was performed with a total of 5 changes of 2 x SSC, twice at room temperature and 42°C and once at 55°C for 10 min each. Const~~~t~on and screening of a blind caue $sh genomic library
Approximately 120 p g of genomic DNA from one fish was partially digested with Sau3A I and separated by size on an agarose gel. The DNA in the size range of 9-23 kilobases (kb) was electroeluted from the gel and ligated with
lambda EMBL3 vector DNA which had been double digested with Barn HI and Eco RI to prevent self-ligation. The ligated DNA was packaged in vitro into bacteriophage particles by using Gigapack packaging extract (purchased from Stratagene) and plated on the nonpermissive E. coli host NM539. Approximately 2 x 10’ recombinant plaques were screened sequentially with the three visual pigment cDNA probes, A total of 38,33 and 37 positive clones were obtained by using the probes bd20. hs7, and hs37. respectively. DNA sequencing
The complete coding region of a genomic clone, designated GF, which hybridized to the human red cDNA probe, was chosen for sequencing. Subclones for sequencing were produced by one of three different methods: (1) the Sal I insert of G, was digested with Sau3A I, ligated with Barn I-II-digested Ml3mp19; (2) specific restriction fragments were isolated and ligated with Bluescript vector; and (3) deletions of large subclones in Bluescript were produced by exonuclease III/mung bean nuclease and religated by using Stratagene’s protocol. These subclones were sequenced by the dideoxy-chaintermination method using single stranded MI3 phage templates or double stranded Bluescript SK- templates (Sanger, Nicklen & Coulson, 1977; Hattori, Hidaka & Sakaki, 1985). Data analysis
Alignment of DNA sequences were initially performed by the method of Wilbur and Lip man (1983) and refined visually. After the alignment, the proportion (p) of different nucleotides for each pair of genes was computed. From this proportion, the total number of nucleotide substitutions per site (d) was estimated by (Jukes & Cantor, d = - (3/4)ln[l - (4/3)p] 1969) and two-, four- and six-parameter & 1981; Takahata methods (Kimura, Kimura, 1981; Gojobori, Ishii h Nei, 1982). The numbers of synonymous (4) and nonsynonymous (d,) nucleotide substitutions were estimated by the method of Miyata and Yasunaga (1980). To estimate d, and d,, Miyata and Yasunaga (1980) used Jukes and Cantor’s (1969) method. However, nucleotide substitution at the two-fold and three-fold degenerate sites does not satisfy the assumption used in the Jukes and Cantor’s method. Consequently, the Miyata and Yasunaga’s method is an approximation (Lewontin, 1989). Nevertheless,
R H
RH
. e-
:
l
-
a
-23.7
*
-
9.5
-
4.3
1
m-
. a.-
- 2.3
; ,.
. ;** .
- 2.0
l
.’
Rho
Rid
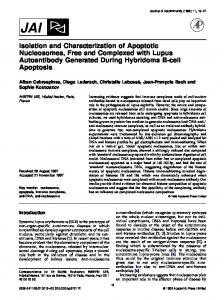
FIN. 1. Southern hybridization of Eco RI (R) and Hind III (H) digested genomic blind cave fish DNA with human blue (blue), human red (red) and bovine rhodopsin (rho) cDNA clones (hs37, Nathans et al.. 1986; hs7. Nathans et al., 1986; and bd20. Nathans & Hogness, 1983, respectively). Black bars to the right of each filter indicate the positions of the i. Hind III digested DNA markers, the sizes of which are indicated in kilobases at the right margin.
809
811
Color visual pigment gene in Asr.~anas Jbsriaru.\
show that the Miyata and Yasunaga’s approach give reasonably good estimates of d, and d, (Nei & Gojobori, 1986). The phylogenetic tree was constructed by using the neighbor-joining (NJ) method (Saitou & Nei. 1987) and the unweighted pair-group method with arithmetic mean (UPGMA, e.g. see Nei, 1987).
computer
simulations
RESULTS
AND DISCUSSION
Mammalian visual pigment cDNA clones detect homologous sequences in blind cave jish To determine if we could detect visual pigment genes in the blind cave fish, we hybridized fish genomic DNA to human blue (hs37, Nathans et al., 1986) human red (hs7, Nathans et al., 1986), and bovine rhodopsin (bd20, Nathans & Hogness, 1983) cDNA clones. It should be noted that bovine and human rhodopsin genes are 90% identical at the nucleotide level (Nathans & Hogness, 1984). The results are shown in Fig. 1. Hybridization to blue cDNA showed a relatively small number of strongly hybridizing bands in each of the Eco RI- and Hind III-digested DNA. Hybridization to red cDNA is especially strong, with the Eco RI- and Hind III-digested DNA showing 4 and 3 hybridizing bands, respectively, each spanning a total of approx. 21 kb. Hybridization to rhodopsin cDNA showed bands spanning a total of approx. 35 kb in each of the Eco RIand Hind III-digested DNA. From these hybridizations, it became clear that it would be H
T
STS
1
to isolate
3
2
the visual
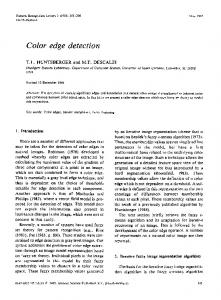
After screening with the human red cDNA clone, 33 positive 1 clones were obtained, five of which hybridized to the first 310 and last 323 nucleotides of the complete cDNA clone. One of these clones had two Eco RI bands identical in size to the two strongest Eco RI genomic bands hybridizing to red cDNA (see Fig. 1). Because of this strong homology and the likelihood that its sequence was complete, we have chosen this gene, designated G,, for sequencing. The sequencing strategy and nucleotide sequence of G, are shown in Figs 2 and 3, respectively. As is the case for the human red and green genes, G, has six exons and 5 introns. This is in contrast to the human blue visual pigment (Nathans et al., 1986) and bovine (Nathans & Hogness, 1983), human (Nathans & Hogness, 1984) and chicken (Takao, Yasui & Tokunaga, 1988) rhodopsin genes which have only five exons, missing a comparable exon 1. Although the intron positions have been completely conserved between G, and the human red and green genes, the length of each intron of the GF, ranging from 82 bp to 1.1 kb (Fig. 3) is much shorter than the corresponding intron of the latter genes, which range from 1.5 to 6.6 kb (Nathans et al., 1986). R
s
S
5
4
I I
H I 4
,
c
/ W
N
,
/
4 --
D
.
c C-L ci-
X
-e ,
*
/
D
PE
6
--
--
pigment
Isolation and nucleotide sequence of a blind cave fish gene, G,
B x
T
,
genes from blind cave fish by using the mammalian cDNA probes.
possible
I
4
1 .
I
/ 4
1 4
I
500 Fig. 2. The genomic structure and sequencing strategy of G,. a gene from a blind cave fish homologous to the human red and green genes. The black boxes indicate the putative coding sequences which are interrupted by introns. The genomic clone was subcloned into M13mp19 phage or Bluescript SK- plasmid by using the indicated restriction enzyme or exonuclease III/mung bean nuclease deletions. (B) Barn HI; (D) Dra I: (E) Eco RI; (H) HinP I; (P) Pst I; (R) Rsa I; (S) Sau3A I; (T) Taq I; (X) Xba I.
,
Rum
812
YOKOYAUA
and SHOZOYOKOVAMA
~TATTTTTTATTWT~MAccTMK;IGTuTGicATGcTCcAGoGcuM
CAWTAATC TGTTTGTCTCAMTGTGT~ATGMTC~GGTTMTTCAA
ATETTTAGAC&WTGTGTGTTA&QZACT~XNTUT~TC~XUX#
GTATTTccIAAlXCTTMAGCATATCWTTATTCWrG~A
~TMTCuGGMTcocouMcT~ca3ufccIGT~~KioGToIw:~~~~~
TT-AMTC~(~~~~~G~~(~~TATA
AMUWXCMGGWXATGMAC~TGCCTAEAGTW&XXTTGAAGWAWCT~WXAAA
-wTm
ACTm$xAAcmGcC
~T~~~~~~ux;crmnU~iunccocCrc;mnT~~~~~~~~~ IO
20
30
Met Ala Ala His Ala Asp Clu Pm Val Fhe Ala Ala At-gArg Tyr Am Glu Glu Thr Thr At-gGlu Ser Ala phe Val Tyr 7hr AsnAb ATGGCC~MTG~:~T~CCTGTGTTCGCI~~:~~;~:T~MTCI\G(~MA~:AU,AGCGK;M~;~GTTTU:AUMT~C 40 AsnAsnThrArgA
50
spProFheGluGlyProAmTyrHisIleAlaProArgTrpValT~AsnLw
MCMTNX~GGTMTAT~
121tp CTTTOXN
AT MTTT
fXB.?ACXCAUZTAT
do
WATT
GCCCCT MTGGGTCTACMC
70
CTA
80
AleSerLarTrplletIleIleVelVelIlcAlaSerIlePheThrAsn~LarVel~leValAlaThrAlaLys~LysLys~~rg MTa:nATGGA~ATCAncnnATCcuruArcrrCAcr~iu;rcrGnAA~crAcer~~McnC~mcnr;~ !m
100
110
HisProLarAsnTrpIleLar~1A8nLarAlaIleAls~LarGlyGluThrVelLarAlaSerThrlle~~lPhcAsnGlnVel cIu:~cTAMcTGGA~~GGTAMccIGOnATAoa:~T~Crr;crr,~eACnCrrou:rrs:~AT~KiTGTGTTCMc~GTc la,
130
FheGlyTyrFheValLwGlyHisP~~MstCysIleFbGluGlyTrpThrValSsrValCysG nCGGCTK:mCTCCn~~~ATGTOCATTm(;AGu;ATQ;~CCGfCICTCTGTG 140
GTAKTW%
l.llb
Is0
TCTTTTouG
100
lyIleThrAloLarTrpSerLarThrIle1leSgTrpGluAr(lTrpValValValCysLysProPhcGlyAenVelL~PheAspGly cTATCAcAocTcT(iTGcTcIcTGAcTATAAn:T~Tffi(ilyiuz:TGGcTGCnc;rcTcCMGcuI~ccTMTCnMo~UTGGc 170
l&l
15U
LysTrpAlaAlaGlyGlyIleIlePheAlaTrpThrTrpAlaIleIleTrp~ThrProProIle#wGlyTrpSsrAr AMTGGOCA~PL;C,OOCATTAnmoa:Tffi~TffiuX:ATTATCTGCTa~OCTCMATCmCOCmGMtRGTM6TIIW: 2m
210
g Tyr Trp Pm His Gly Lsu Lys Thr Ser QS Gly Pm A~J Val Fhs Sg Gly Ser Glu Asp Pm Gly Val Ata Ser 82tp~~GT~T(;Om:uToorcrGMo~TcrTGTO[E.CCTMTCTG~ICMCOOCKiT~TOCAMCTCGOCTCC 230
22u
240
TyrM~1ThrLeuLarLarThrCysCysIleL&lProLwSerValIleIleIleCysTyrIlePheValTrpAsnA~ILeHisGln l~ATGGTC~cTGcTGCnKx:TcCTGTATTCnctTcTCTcCorCA~ATCATTTGcTK:An:~CFIcT~MT[ia:AK(IIc~ 2m
250
Val Ala Gln Gin Gin Lys &?+JSer Glu Ser Thr Gin Lys Ala Glu lys Glu Val St- Arg Hst Val GTATCTM
13dtp TTCCCMX
GTCQTcKi~cltMA~TU~TcTKx:uOAlyi~MGMGcMoTGToC~ATGoTG 290
2Eu
270
ValValCIetIleLwAlaPhcIleLarCysTrpGlyProTyrAlaSwPheAla7hrPheSerAlalar~~GlyTyrAlaTrpHis GTAGTGATGATCcnoa:mAn:crGTa:m;~cuTATaa:Ta:mccc~ccTTcr~nGmcanmTATarTacuc 320
310
300
ProLa,AlaAlaAlaLarProAlaTyr~AlaLyoSerAlaThrlleT~~~IleIleT~#lPhtllet~~Gln CUICTG~~~~~TCTGCCCO~TT~TTCOOCAK;AGTG~:ACCATCTACMT~CATCA~TAT~T~~~:ATGM~~~:~;~~ 340
a0
~he~t-g~w~ys11elktGlnLwFbeGlyLyslysValGluAspAlaGsrGluValSsrGlYSer~r~r TTCmiMcTorATCATGucclGmoumcmcGTCUG~TTGM~(iKi~MTCT~kM
CIA 33%~~ CWXWX 330 Glu Vat Scr Thr Ala Sef c~MGTGTcT~~XT
TUTM~TCTATOGOGCCCmACT~T~MMTATATCMU\TCTMCAT~~~ATCA~~
TCTGCTAIXTGCATTATGGTWXT~TAUZTMUXAl%TWlXMTCTTTATATT clETcTGulliocATTcT(wcATA~CM~
TCATATCAGGACTCTATWT~TAGTUETATGATGM.XTTTATuTTC UTATfEl-gGMTETUXTGfMT~TATTTT~
-TGmcmm-
CDclwzDemTTCaTGmTuCaG~~~
TWCTCTaZMCfGMTAT--TO-ATTTGTcTAToocTwI[EToGMToTcT(iMMcmM~MTA~~~~~C~~AJT#GFTo~~ GtxATmAAcMTTTmmmlTGn-
CnwrrTAA-AM
TCWWATMmA-fTIZfATCTATTSTccA'IIITuI,-
ATATMCCTG TXTGWTT
GTCTATtWCClTTWSinTT'lTTAEWTUBTAfilcATTM
TNXMj&jj~TGT
TTUSMlTAMoeTGTATGTMTCTCTTT
MZXCAKmW-TWMT
WMNMM#MTATGTATAll7ATT
WWTTCTT
AmwmMA_TCTM
Fig. 3. Nucleotide sequence and deduced amino acid sequence of G,. The deduced amino acid sequence is written above each nucleotide triplet. The first and last 10 nucleotides of each intron and intron size is also included. A possible TATA box and the putative polyadenylation signal AATAAA are underlined.
Color visual pigment gene in Astyanax j&ciarus 'fY*NEETTRESAFVYTNANNlRDPFEGPNYHIAPRUVYNLASLUM GF MAAHADEPVFAARR ~ __GGUSLDRL-G-HPDDSY-DS-GS-~-T---S-S--G---------------H-T-V-G_HPGDSY_DS_GS_I-T---S-S--G---------------H-T-V---POUSLORL+++++*r**++tt+*++**RKnS-EE-YLFKYISSVC_VD--D-----V-AFY-~AAF'H --A-O-YL-EP-PFSMLAAY4 -****************NGT-GPNFYVPFSNKlGVV-SRH
_F__T__V___G__LA__M______________---V-_-A-__,__-__,"-_-S__-RH -Y----VSFGGFLLCIFSVFPVFVASCN---BH GT-FLIGFPL-AH-L---LRY----Q-R$
--V---FMVFGGF-TTLYTSLH----
FLLIMLGFPI-F-TLYV-VPH----T--Y--L-
GF LGHPMCIFEGUTVSVCGITALVSLTlISWERVVVVCKPFGNVKFDGKUAAGGIIFAUTUA GH ______VL__Y___L____G____A_______"--------_R__A-L_IV__A_S_~-_
177 II
__VL__Y___L____G____A_______L--------_R__A_L_IV__A_S_I_S
180 180
RH ---BH F-RHV-AL--FLGT-A-LVTG---AFLAF--Yl-I------FR-SS-H-LTVVlAT--IG
161
RhB F-PTG-NL--FFATLG-EI-----VVLAI--Y------MS-FR-GENH-IM-VA-T-VM-
164
RH AV-TA---______--_______________SY-__P-__IV_~V____I__AI_~L__L -GVSI--F--___FI-EBH RhB LACAA--LV-----I-E-MPC--
-PC-----UYTVGTKYRSE--TUF-FIF-F-V---L-CFS-1 -I-YYTPH-ETNNE-FVIYMFVVHF-i--I--FF--G
GF FVUNAIHOVAQPQKDSESTPKAEKEVSRnVVVVMlLAFlLCUGPYASFATFSALNPGY~UH GH a--L--RA--K---E_____---___T-----~--CF-----O~--C-A_A__::e:: RH G--L--RA--K-_-E---__---_
--T-------F-YCV---__TF__C_A_A__
BH DLLR-LKA--A--QE-AT-----R-__-:----VCS_CV-YV%
-GV-FYIFTHP;SDFG
GF PLAAALPA~FAKSATIYNPIIYVFMNRClFRSCIHQ *LFGKKVEDASEV*SGSTTEVS*** ; _-~-__--F----_-----V----------N--L-*------D-G--LS-A-K--~-SVS _-"____
_~-____~_--~V--~~~-----W--L-*_--~--D-C_-LS~A_K~___SVS
BH LRLVTI-SF-S---C-------C---K--PA---KnVC---KMVC--AMT-G-DTC-SGK----TVS RhB -IFHTI--F---TSAV---V--IM--K****TAS ;S
l *VSPA
352 359 359 341 34b
364 364
BH STPVGPN
346
%v
--N-MVTT-CCC-NPLGDDEA-TTVSKTETSQ
281 284
355
RH S*'VSPA *'*APA
303 240
--A--MYMVN-RNHGLD
PLVFTVKEA-A--PE-AT--------T---II-VI--LI--L--
297
348
Fig. 4. Alignment of the deduced amino acid sequences of G, with those of the human green (G,), red blue (EH) pigment genes (Nathans et al., 1986) and bovine rhodopsin gene (Rh,, Nathans & Hogness, 1983). The amino acids are indicated in the one-letter code. Amino acids identical to G, are indicated by a dash. Gaps necessary to optimize the alignment are indicated by asterisks. The boxes show the identity between G, and G,, or between G, and R,, at the nine informative sites (see the text). (R,,),
Figure 3 also shows that G, has a possible TATA box about 100 bps upstream from the start of the coding sequence and a putative polyadenylation signal AATAAA which is located about 750 bps downstream from the stop codon (underlined in Fig. 3). In addition, G, has the consensus intron splice junctions of GT/AG and no internal stop codons. All of these characteristics strongly suggest that GF is capable of encoding a functional protein. A comparison of the deduced amino acid sequence of G, (Fig. 3) with those of the
previously sequenced human red (I&), green (G,,), and blue (BH) pigment genes (Nathans et al., 1986) and bovine rhodopsin gene (Rh,, Nathans & Hogness, 1983) is shown in Fig. 4. The number of amino acids deduced from G, is nine residues shorter than those of the human red and green genes, being three and six amino acids shorter in the first and last exons, respectively. Out of the nine informative amino acid differences which can distinguish between red and green pigments, the polypeptide deduced from GF shows six identical to the green pigment
814
RUTH YOKOVAMA
and S~ozo Y~KOVAM~
Table I. Proportions of nucieotide and nonsynonymous differences between Penes
Rtl
GH
R"
GF
B”
Rh,
25/1092
31711065 46711035 G;; 16/S41 3lS;1065 463/1035 G, 138,‘SlS 137/818 475/1017 B” 302/793 2971793 3 IO/780 Rh, 3201798 3151799 3351785 3091795
46311041 460)1041 SI1/1023 46011035
R,, = red pigment gene in human (Nathans et al., 1986); G,= green pigment gene in human (Nathans et al., 1986); G, = blind cave fish gene; BH = blue pigment gene in human (Nathans et al., 1986); &%a= bovine rhodopsin gene (Nathans & Hogness, 1983). Values above the diagonal are the proportions of different nucleotides per site, whereas those below the diagonal are the proportions of different nucleotides per nonsynonymous site.
and three Therefore, encoding the pineal 1982).
identical to the red pigment GF is a likely candidate for the green-sensitive pigment organ of the bhnd cave fish
(Fig. 4). the gene found in (Tabata,
Molecular evolution of GI. Using the alignment in Fig. 4, the proportion of different nucleotides for each pair of the human color visual pigment genes (Nathans gene et al., 1986), the bovine rhodopsin (Nathans & Hogness, 1983), and GF.was evaluated (Table 1). When the DNA sequence of GF was compared to those of R, (or G,,), B, and Rhs,the proportions of different nucleotides were 30, 47 and 50%, respectively, suggesting that GF is most closely related to the human red and green genes. To obtain the phylogenetic tree of these genes, the numbers (d) of nucleotide substi-
1A I
0.20
0.33
B 0.13 c 0.01 r
Rii
0.24
’ 0.01 %
Table 2. The average number of nucieotidc substitutions per site for different branches of the evolutionary tree
64
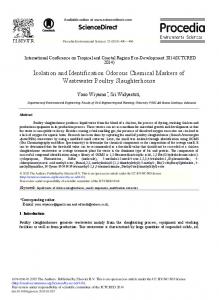
Fig. 5. The phylogenetic tree constructed for human visual color pigment genes red (R,,). green (G,) and blue (B,,) and the visual pigment gene in AsrJ~ax (G,) by using the number of nucleotidc substitutions at all positions. The rooted tree was constructed by the NJ method (Saitou & N& 1987), using Rh, as the outgroup.
Branch
A-B B-G, 8-C
C-R, C-G, A -BE
Number of nucleotide substitutions .-_--.___ __ Nonsynonymous All (d, 1 Cd,!
Synonymous (d,)
0.45 rf:0.054” 0.35 + 0.04Y 0.35 _+0.045* 0.02 k 0.008 0.02 + 0.009 0.57 & 0.066~
O.I2_+0.013 0.20 & 0.018 0.06 + 0.009 0.01 f 0.004 0.01 & 0.003 0.25 F 0.020
0.20+0.015~ 0.24 & 0.017 0.13 & 0.012 0.01 * 0.004 0.01 + 0,003 0.33 & 0.024
“Branch length measured by d, is significantly longer than that measured by d,at P co.01 level.
tutions per site were estimated by the Jukes and Cantor’s (1969) method, which assumes equal substitution rates among the four types of nucleotides. We also computed the d value by using other formulae (Kimura, 1981; Takahata & Kimura, 1981; Gojobori et al., 19821, but the values obtained were not much different from each other. Figure 5 shows the phylogenetic tree constructed by using the neighbor-joining (NJ) method based on the numbers of nucleotide substitutions at all positions, where Rh, was taken as the outgroup because it is more conserved than the human rhodopsin gene. The identical tree topology was obtained by using the UPGMA method. As expected, Gf is more closely related to the human red (RH) and green (GH) than to blue (8,) genes. Interestingly, the two branches leading to GF (A - GF and B - GF) are significantly longer than the corresponding branches (A -B, and B - R, or B - GH), showing a significantly larger number of nucleotide substitutions in G,, The numbers of nucleotide substitutions at all nucleotide sites for branches B - Gf and B - RH (or G,,) are 0.24 and 0.14, respectively {Table 2). If we take the divergence time between fish and human lineages as 400 Myr ago, then the rates of nucleotide substitution for G, and RH (or GH) are 0.6 x 1O-9 and 0.35 x lo-’ per site per year, respectively. Thus, G, has almost twice the rate of nucleotide substitutions as the human red and green genes. If this accelerated evolution of G, is due to the loss of eyesight, then the rate of nucleotide substitution in G, would have to be IO-’ per site per year during the last 1 Myr. Since the evolutionary rate of pseudogenes is about 5 x lo-’ per site per year (Li, Gojobori & Nei, 19811, this is an unreasonably high rate. Therefore, the higher evolutionary rate of Gf must be mostty due to substitutions over the entire 400 Myr of fish evolution.
Color
visual pigment
gene in Asiyanax Jasciarus
The number of nucleotide substitutions within the past one Myr in G, of blind cave fish is expected to be rather small. For a total length of 1.5 kb of coding and 5’- and 3’flanking regions, we expect 0.9 (= 0.6 x 10m9x IO6 x 1.5 x 103) substitutions using the evolutionary rate of G,, whereas 7.5 (= 5 x 1O-9 x lo6 x 1.5 x IO’) substitutions are expected using the evolutionary rate of pseudogenes. The actual number will probably lie between these two values. Since nucleotide substitutions which change an amino acid (nonsynonymous) could change the physico-chemical properties of a protein, it is important to partition nucleotide substitutions into synonymous and nonsynonymous changes. The proportions of different nucleotides per synonymous and nonsynonymous sites were estimated by the method of Miyata and Yasunaga (1980) for each pair of genes and the latter values are given in Table 1. The average numbers of synonymous (d,) and nonsynonymous (d,) substitutions for each branch in Fig. 5 were evaluated by using the NJ method (Table 2). Table 2 shows that all branches, except C - R, and C - GH, have significantly larger numbers of synonymous to nonsynonymous substitutions. Interestingly, although the three branches leading from B to R,, G, and G, have similar d, values, the d, value for G, (0.20) is significantly larger than those for R, and G, (both with 0.07) (Table 2). Thus, the larger number of total nucleotide substitutions in G, is attributed
to the higher number
of nonsynony-
815
evolutionary changes of visual pigment genes. In particular, the effect of the loss of eyesight on the pattern of nucleotide substitutions remains to be evaluated by comparing the multigene family members between the river fish with those of cave fish. Acknowledgemenrs-We thank J. Nathans for providing clones bd20, hs7, and hs37. Comments by P. Thomas, G. S. Whitt and anonymous reviewers were greatly appreciated. This research was supported by grants from the National Institutes of Health and the National Science Foundation.
REFERENCES Avise, J. C. & Selander, R. K. (1972). Evolutionary genetics of cave-dwelling fishes of the genus Asfyanax. Euolufion, 26, l-19. Benton, W. D. & Davis, R. W. (1977). Screening igt recombinant clones by hybridization to single plaques in situ. Science, New York, 196, 180-182. Blin, N. & Stafford, D. W. (1976). A general method for isolation of high molecular weight DNA from eukaryotes. Nucleic Acids Research, 3, 2303-2308. Chakraborty, R. & Nei, M. (1974). Dynamics of gene differentiation between incompletely isolated populations of unequal sizes. Theoretical Population Biology, 5, 460-469. Gojobori, T.. Ishii, K. & Nei, M. (1982). Estimation of average number of nucleotide substitutions when the rate of substitution varies with nucleotide. Journal of Molecular Evolution 18, 414423. Hattori, M., Hidaka, S. & Sakaki, Y. (1985). Sequence analysis of a Kpn I family member near the 3’ end of human P-globin gene. Nucleic Acids Research, 13, 7813-7827. Jukes, T. H. & Cantor, C. H. (1969). Evolution of protein molecules. In Munro, H. N. (Ed.), Mainmalian protein metabolism, (pp. 21-123). New York: Academic Press. Kimura, M. (1981). Estimation of evolutionary distances between homologous nucleotide sequences. Proceedings of [he National Academy of Science, U.S.A., 78, 454458. Levine, J. S. & MacNichol, F. (I 982). Color vision in fishes. Scientific American, 246, 140-149.
mous substitutions, suggesting a functional adaptation of the G, gene. Table 2 also implies that the rates of synonymous and nonsynonymous substitutions in G, are 0.87 (=0.35/ Lewontin, R. C. (1989). Infering the number of evolutionary 400 x 106) and 0.5 x 10m9 (=0.20,‘400 x 106) events from DNA coding sequence differences. Molecular Biology and Evolution, 6, 15-32. per site per year, respectively. The respective Li, W.-H., Gojobori, T. & Nei, M. (1981). Pseudogenes as values for R,, (or GH) after its divergence from a paradigm of neutral evolution. Narure, London, 292, G, are 0.92 x 1O-9 and 0.17 x 10m9per site per 237-239. year. Miyata, T. & Yasunaga, T. (1980). Molecular evolution Here, the DNA sequence of a color visual of mRNA: A method for estimating evolutionary rates of synonymous and amino acid substitutions from pigment gene from the blind cave fish Astyanax homologous nucleotide sequences and its application, fusciurus is compared to human genes, which Journal of Molecular Evolution, 16, 23-36. are the only other vertebrate color visual Nathans, J. (1987). Molecular biology of visual pigments, pigment genes characterized. The comparison Annual Reviews in Neuroscience, IO, 163-194. shows that the rate of nonsynonymous nucleoNathans, J. & Hogness, D. S. (1983). Isolation, sequence analysis, and intron-exon arrangement of the gene entide substitutions in this fish gene is high, coding bovine rhodopsin. Ceil, 34, 807-814. being twice that of the human red and green Nathans, J. & Hogness, D. S. (1984). Isolation and nucleopigment genes. Undoubtedly, molecular genetic tide sequence of the gene encoding human rhodopsin. analyses of different visual pigment genes Proceedings of the National Academy of Science, U.S.A., within and between species will further elucidate 81, 48514855.
816
RUTHYOKOYAMA and Snozo YOWYAMA
Nathans, J., Thomas, D. B Hogness, D. S. (1986). Molecular genetics of human color vision: The genes encoding blue. green, and red pigments. Science, New York, 232, 193-202. Nei, M. (1987). Molecular evolutionary genetics. New York: Columbia University Press. Nei, M. & Gojobori, T. (1986). Simple methods for estimating the numbers of synonymous and nonsynonymous nucleotide substitutions. Molecular Biology and Evolution. 3. 418-426.
Rigby, P. W., Dieckmann, J. M., Rhodes, G. & Berg, P. (1977). Labelhng deoxy~bonucleic acid to high specific activity in vitro by nick translation with DNA polymerase I. Journal of Molecular Biology, 113, 237-25 1. Saitou, N. & Nei, M. (1987). The neighbor-joining method: A new method for reconstructing phylogenetic trees. Molecular Biology and Evolution, 4. 406425.
Sanger, F., Nicklens, S. & Coulson, A. R. (1977). DNA sequencing with chain-te~jnating inhibitors. Proceedings of the National Acudemy of Science, U.S.A., 74,%63-5467. Southern, E. (1975). Detection of specific sequences among DNA fragments separated by gel electrophoresis. Journal of Molecular Biology, 98, 503-517.
Tabata, M. (1982). Persistence of pineal photosensory function in blind cave fish. Astwnax mexicanus Comparative 127.
Biochemistry
and Phy.sioiagy,
7.3,~.
12%
Takahata. N. & Kimura, M. (198f). A model ofevolut~onar~ base substitutions and its application with special reference to rapid change of pseudogenes. Genetics. 98, 641-6.57.
Takao. M., Yasui. A. & Tokunaga, F. (1988). Isolation and sequence determination of the chicken rhodopsin gene. Vision Research, 28, 471-480.
Wilbur, W. J. & Lipman, D. J. (1983). Rapid similarity searches of nucleic acid and protein data banks. Proceedings of the Nurional Academy 75 730.
of Science,
U.S.A.
RO.
Wilkens, H. (1988). Evolution and genetics of epigean cave Astyunas fasciatus (Characidae, Pisces): Support for the neutral mutation theory. ~vo~ut~onar,~f Biology, 23, 271-398.
Yokoyama, S. & Yokoyama, R. (1988). Molecular evolution of human visual pigment genes. Molecular Biology and Evnlution, 6, 186-197.