temperature of 155 ~ Equilibrium molalities ranged up to 21 mol-kg 1. MgCl2(aq) was chosen as the reference electrolyte. The apparatus used for the isopiestic ...
Journal of Solution Chemistry, Vol. 23, No. 10, 1994
Isopiestic Measurements at High Temperatures: !. Aqueous Solutions of LiCI, CsCI, and CaCI2 at 155~ V. Brendler 1 and W. Voigt 2 Received October 25, 1993; Revised May 2, 1994 Isopiestic measurements have been made for LiCI (aq) and CsCl (aq) at a temperature of 155 ~ Equilibrium molalities ranged up to 21 mol-kg 1. MgCl2(aq) was chosen as the reference electrolyte. The apparatus used for the isopiestic experiments is an enhanced version of that developed by Grjotheim and co-workers. To test its precision osmotic coefficients o f CaCI2 (aq) have also been determined and compared with previously reported vapor pressure measurements at high concentrations. The results show a very good coincidence. The data can be described by the ion interaction model of Pitzer. The resulting set of parameters allows a fit of the experimental osmotic coefficients with a standard error of 0.0078 and 0.0114 for LiCl(aq) and CsCl (aq), respectively. The osmotic coefficients of LiCI are consistent with data at lower moIalities, but there are discrepancies for the CsCl solutions. KEY WORDS: Osmotic coefficients; isopiestic; Pitzer model;
LiCI; CsCI. 1.
INTRODUCTION
Many processes in the chemical industry and the generation of power demand a broad knowledge about the thermodynamic properties of mixtures of aqueous salt solutions. Whereas the data base at room temperature is rather extensive, there is a lack of information about ternary water-salt systems, especially at high concentrations and temperatures. The systems MgC12-ACI-H20 (with A = Li, K, Cs) are of special interest for both technical and theoretical reasons. There have already been investigations of the system MgC12-KC1-H20 at a tern!FZ Rossendorf, Institut fiir Radiochemie, D-01314 Dresden, PSF 510119, Germany. 2Freiberg University of Mining and Technology, D-09596 Freiberg, Germany. 1061 0095-9782/94/1000-1061507.00/0 @1994PIenumPablishingCorporation
1062
Brendler and Voigt
perature of 100~ and there are also some vapor pressure measurements (2,3) above this temperature. The solubility diagram of this system was thoroughly investigated by Fanghaenel. (4-6) For the two other systems of interest only a few data at elevated temperatures have been published by Urusova et al.(7) Due to solubility limitations it is necessary to extend these measurements to even higher temperatures in order to obtain higher concentrations. It would then be possible to gather more detailed information about the interactions between Mg ++ and C1- ions and the reactions in the solvation shells of the cations under conditions of a deficiency of solvent. The above mentioned systems should also be suitable test examples thus enabling the checking of the validity and limitations of thermodynamic models for electrolyte solutions. The analysis of mixed-electrolyte systems requires knowledge of the related binary electrolyte solutions. There have been several thorough investigations of the system MgC12-HzO and also some compilations of the water activity,~S,9) which will be discussed later in more detail. In the case of KC1-H20, LiC1-HzO and CsC1-H20 the compilations of Holmes and Mesmer(1~ give access to the binary data. However, both LiC1 and CsC1 exhibit a very high solubility, widely exceeding the validity range of these compilations which are limited to molalities of about 8 molal. Therefore it was necessary to measure osmotic coefficients of the systems LiC1-H20 and CsC1-HzO at high molalities. The results for 155~ are given in the present article, together with equations based on the Pitzer model(11,12) to calculate water activities and osmotic coefficients. The results for the ternary systems will be presented in following papers. 2.
EXPERIMENTAL
Most of the reliable activity data are based upon water activities or osmotic coefficients obtained by the isopiestic method. This method provides some important advantages: it is fairly insensitive to small quantities of gases other than water vapor, it provides activities of several solutions within one run, the construction and handling of the apparatus is straightforward. Probably the best overview to the isopiestic method is given by Rard and Platford. ~I3~ The apparatus used for all the experiments is an updated version of the one described io an earlier paper.(14) Therefore only the main differences between these two isopiestic facilities are specified here. The material of the following parts of the apparatus were changed from aluminium to a stainless steel alloy: the body of the
Isopiestic Measurements at High Temperatures
1063
autoclave, the lids and their supports, their springs, and the block for the crucibles. The sealing ring between the upper and the lower part of the autoclave is now made of PTFE. To improve the tightness of the autoclave the closing mechanism and the valve were substituted by more sophisticated parts. Only vitreous carbon crucibles were used for all experiments. The new autoclave is designed for a temperature up to 250~ and a pressure up to 2 MPa. The equilibrium was established in a cylindrical oven, which contains an additional inner aluminium cylinder to reduce temperature gradients. The autoclave is pIaced on a plate within the inner cylinder. To avoid concentration gradients in the sample liquids, this plate can be rocked slowly. The temperature is controlled by means of two platinum resistance thermometers with a precision of 0.025 K. These thermometers each control an independent heating circuit to minimize local temperature gradients. The measurement of temperature is performed by means of an additional third resistance thermometer placed inside the aluminium cylinder. The procedure of measurements is the same as given by Grjotheim e t a/. (14) In brief, 12 vitreous carbon cups were filled with solution, three of them being solutions of the reference electrolyte. These cups were inserted in the holes of the steel block inside the autoclave. The autoclave was then closed and evacuated till the pressure dropped to under 2 kPa. Over a period of 48 hours the isopiestic apparatus was gradually heated to the desired temperature. Following this it was placed into the isopiestic oven and equilibrated for another 48 hours. This time has proved to be long enough to establish equilibrium. Some preliminary runs, involving only solutions either of MgC12 or CaC12, were performed with all cups starting from different molalities. In each case the same final concentration was approached from both the higher and the lower starting values after 48 hours. When equilibrium had been reached, all cups were closed simultaneously with the help of a special mechanism, the autoclave was cooled to room temperature and opened, and the cups were transferred to a balance. There finally all cups were carefully opened and weighed to determine the change in water content. Corrections were calculated using a computer program to take into consideration the amount of water in vapor state under equilibrium conditions, later being condensed to become part of the solution during weighing. Salts used in the present study were MgCI2.6H20 (zur Analyse), CaC12-4H20 (suprapur), LiC1 (zur Analyse), and CsC1 (suprapur), all from Merck. In all cases stock solutions were prepared using deion-
1064
Brendler and Voigt
ized and bidistilled water, the salts were used as received without additional purification. The stock solutions were analyzed by precipitation of the chloride as AgC1 (argentometric titration). Furthermore, in the case of the earth alkaline metal chlorides the concentrations of the cations were determined by titration with EDTA. Moreover, the water content of the LiC1 solution was determined by the Karl-Fischer method. All analyses were performed fivefold, agreeing to within +_0.07%. The stock solutions were stored in plastic bottles inside fight glass flasks. After periods of 3 months, samples of the LiC1 and CsC1 stock solutions were dried at approximately 127~ The water content changed only within the analytical uncertainties of about 0.07%. 3.
ISOPIESTIC
REFERENCE
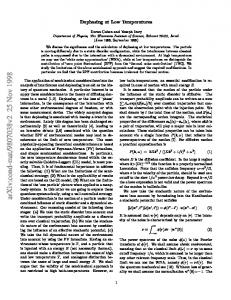
Since the aim of the experiments was to investigate very concentrated solutions with expected water activities in the range from 0.7 to 0.2, combined with high temperatures, the usually recommended reference electrolytes (NaC1, H2SO4) are not suitable in this case. The only thoroughly measured electrolyte with water activity and temperature in the desired area is MgC12. Certainly, MgC12 is not an ideal choice for an isopiestic reference, a better choice would be the system CaClz-H20, but unfortunately there are no precise data available for that system above 100~ and the evaluation of our own measurements(22) is still not finished. One problem with MgC12 is that hydrolysis can occur at elevated temperatures. For that reason the pH of the MgCI2 solutions were checked before and after the experiments. There was no indication for hydrolysis. Besides, no evidence was found for the formation of hydrolysis products such as oxychlorides or hydroxides. This situation will deteriorate of course at still higher temperatures. But up to now no better alternative is available. To allow later recomputation in case of more accurate reference data the equilibrium molalities are given as the primary experimental data set. There are two compilations of the water activities of aqueous solutions of MgC12 available in the literature: from Valyashko e t al. (8) and from Pabalan and Pitzer. (9) They both use the ion interaction model of Pitzer, (lxaz~ but they are based on very different original data sets and, unfortunately, differ widely in their predicted water activities and osmotic coefficients at higher molalities (see Fig. 1). The compilation of Pabalan and Pitzer utilizes only isopiestically determined osmotic coefficients, these are the data of Rard and Miller(xS) at
Isopiestic Measurements at High Temperatures 4
i
' i
1065 s
i
i o
s o
3.5 o o o
3 o o El
2.5
Q [3
+
+
+
+ +
+ +
§
+
+
+
2
0
1.5 O
O +
§
+
! ql
0.5 0
| 2
I 4
f 6
I 8
I0
1
m in rmfl/kg
Fig. 1. Osmotic coefficients ~ for MgC12-H20 at 155~ calculated with the Pitzer model using different parameter sets: a, Ref. 8 and +, Ref. 9.
25~ and the sets obtained by Holmes et al. (16~ at 109, 140, 172 and 201~ All data are limited to a maximum molality of 9 molal and though there was an additional adjustment to some solubility data it is not recommended to extrapolate the equations to concentrations above 9 molal. Valyashko et al. (s) rejected in their compilation (which is an extension of the work done by Emons et al.O7l) the data from Holmes et al., (1~) because there were serious discrepancies regarding almost all other available data at high concentrations. The authors included in their fit not only isopiestic measurements but also direct vapor pressure measurements and calorimetric data. Thus the overall data base covers temperatures between 25 and 350~ and concentrations from dilute solutions to saturation. For that reason it became a task to compare the reliability and accuracy of the two compilations. To decide this, recently determined osmotic coefficients, (1,3,~s-21) which were not incorporated into either of the compilations, were compared with calculated values from the models. The mean differences between experimental and calculated osmotic coefficients are given in Table I. Only three data sets have mean differences smaller than 0.1, the other sets seem to be of lower precision in general and should be excluded from further considerations. The remaining measurements clearly favor the model given by Valyashko et al. and consequently their compilation is used for all the necessary calculations of reference data.
1066
Brendler and Voigt
Table I. Mean Deviations Aq~ Between Calculated and Recently Measured Osmotic Coefficients PabalanPitzer"
0.0661 0.3010 0.0570 0.1010 0.1123 0.3162
Valyashko et al. b
T (C)
0.0300 0.0395 0.0496 0.1064 0.1810 0.3176
373 409 - 524 323 - 343 339 - 398 412 - 521 323 - 353
m 0.92 9.25 1.05 1.05 0.29 0.82
- 6.4 - 9.3 - 4.8 - 4.1 - 4.6 - 5.1
Ref. 1 3 18 19 20~ 21
a Ref. 9. b Ref. 8. c Original data extend to 350~
4.
RESULTS
The reproducibility of our method was determined by comparing the final concentrations of the triplicate reference solutions. The maximum deviation of each run did not exceed 0.10% in molality, the mean deviation was 0.04% for MgC12-H20. The mean deviations for duplicate samples of CaCla-H20 and of LiC1-H20 were 0.06% and 0.03%, but for the CsC1 solution the mean deviation was 0.17%. At first, measurements were performed to check the accuracy and reproducibility of our isopiestic apparatus. The system CaC12H20 has been chosen for this purpose because there are new precise vapor pressure data of this system recently measured by Hoffmann.m) In each run, 3 cups of reference solution and 9 cups containing test solution were equilibrated. Table II summarizes the isopiestic molalities of all runs, they are mean values of at least two parallel measurements. The isopiestic ratios R according to q~x R
=
~)ref-
Vref mref
(1)
Vxmx
obtained from the data in Table II for aqueous MgC12- and CaC1Esolutions are shown in Fig. 2. These R values are compared with calculated ones based upon the compilation of Valyashko et al. (8~ and the vapor pressure data of Hoffmann (22) for MgCla-HEO and CaC12H20, respectively. In Table II also the mean isopiestic molalities for the systems LiC1-H20 and CsC1-HEO are listed together with the corresponding values of the reference solution. Error estimations for the molalities give an accuracy of better than 0.2%. With the help of the above rec
Isopiestic Measurements at High Temperatures
1067
Table II. Experimental Isopiestic Molalities a m(MgC12)
m(CaC12)
2.7563 2.9509 3.1304 3.3342 3.3784 3.8572 4.1167 4.2350 4.3217 4.4433 4.4677 4.6159 4.6645 4.8282 4.8531 4.8812 5.0110 5.1524 5.1705 5.2779 5.2814 5.4799 5.5393 5.5879 5.6852 5.7801 5.8370 5.8389 5.8801 5.9874 6.2994 6.2988 6.3276 6.3721 6.3819 6.5199 6.5757
2.9874
m(LiC1)
m(CsC1)
6.6736 7.1736 3.6947 3.7506 4.7219 4.9449 5.0954 5.2084 5.2251 5.4842 5.6570 5.8402 5.9514 6.0111 6.2400
7.4195
9.7740 10.7837
8.1592 8.2211 8.5665
12.3383 12.5200 13.1189
9.0805
14.0700
15.9348 16.0382 6.7469 6.7616 7.1420 7.2592
10.6375 10.7796 10.9434
7.5784 11.4564 7.9057 11.6243 7.9997 12.0691 13.0344 9.0053 9.0588 9.1837 9.2204 13.7933 9.6995
18.0875 18.4976
T (K) 428.65 428.67 428.65 428.68 428.73 428.65 428.65 428.60 428.51 428.65 428.65 428.70 428.54 428.67 428.60 428,70 428.65 428.59 428.59 428.60 428.70 428.67 428.70 428.25 428.70 428.62 428.59 428.59 428.65 428.67 428.62 428.62 428.60 428.73 428.57 428.57 428.65
1068
Brendler and Voigt
Table II. Continued m(MgC12)
m(CaC12)
7.0475 7.1498 7.1969 7.7754 7.8753 8.2645
11.0063 11.2527
m(LiC1)
m(CsC1)
T (K) 428.65 428.76 428.68 428.65 428.70 428.57
16.2437 18.6478 13.3808 20.9490
a m, tool salt per kg H20.
ommended compilation for aqueous MgC12-solutions, (8) osmotic coefficients for both alkali chloride solutions were computed. In Fig. 3 these results are compared with the osmotic coefficients obtained from Pitzer's equations using the coefficients published by Holmes and Mesmer.(10) In the case of LiC1-H20 the experimental values are in good agreement with the calculated ones, but for CsC1-HaO there is a significant shift between the two sets, which will be discussed later. Following Ananthaswamy and Atkinson(23) an extension of Pitzer's equation was used to represent the osmotic coefficients of the systems investigated in this work. The given equations reduce in the case of l:l-electrolytes to the form (~ - 1 = f + m B * + m2C r + m3DO + m4E O0 (2) where f = A0 ~
/ (1 + b ~-m)
(2a)
B(~ = [3(o)+ [3(1)exp(-x) x = a'vr-m,
b = 1.2,
(2b) a = 2.0
(2c)
The Debye-Htickel parameter A* was calculated using the pVT-data for water according to the equations of Saul and Wagner (24) and the dielectric constants compiled by Bradley and Pitzer. (25) The numerical values of the adjustable parameters I3(o) to Er are given in Table III together with the standard deviations (~r In both least-squares fits also additional osmotic coefficients were used, calculated by means of the compilation from Holmes and Mesmer(1~ to represent the region of lower concentration, which has not been investigated in this
Isopiestic Measurements at High Temperatures R I 0.95 O,9
~+
O.85
~+
0.8 0.75
%
0.7
+~ 0_65
~'++ ~.
0.6
4-
0.55 0,5
I 3
I 4
I 5
I 6
! 7
I ...... g
9
rn in moFkg
Fig. 2. Isopiestic ratio R for CaC12-H20 with MgC12-H20 as reference solution at 155~ +, this work and A, calculated from Refs. 8 and 22.
work. These additional points were calculated for molalities from 0.5 to 8 with distances of 0.5 molal. 5.
DISCUSSION
The results show that MgC12 is suitable as a reference standard electrolyte for isopiestic measurements in the field of low water activities and at temperatures up to 155~ It would be an advantage to have CaClz as another reference to allow the comparison and checking of osmotic coefficients. Furthermore, at still higher temperatures CaC12 solutions are more stable and less corrosive than MgC12 solutions, which tend to release small amounts of HC1 gas. The scattering of the osmotic coefficients measured in the system CsC1-HzO is approximately 5 times as high that for LiC1-H20. One reason for this is the higher molar mass of CsC1 (168.358 gmo1-1) in comparison to LiC1 (42.394 g-tool-I), which causes a considerably higher sensitivity of the osmotic coefficient to small uncertainties in the concentration of the electrolyte solutions. Second, the stock solution of CsC1 was not as concentrated as the others, requiring a greater amount of water to be vaporized from the solution during the equilibration process. Error simulations show that the extent of change in the water content is directly correlated to the size of the error in the final concentration and thus the osmotic coefficient. As a third point, highly concentrated aqueous solutions of CsC1 are difficult to handle because they tend to oversaturate, and even worse, to
Brendler and Voigt
1070
Table III. Regression Coefficients of Eq. (2) and c~(~
~(o~ 13(1/ C0 103 D0 103 E0 105 (~0
LiC1
CsC1
0.09736 0.55620 10.26 -1.1126 2.6102 0.0078
0.06354 0.16848 -2.1004
0.0114
"creep" out of the cups, which means loss of substance. The contribution of the slight temperature variation (428.25 K to 428.78 K) to the overall data scattering can be neglected, the relation A(~(AT) _< 0.0006 is always valid. As shown in Fig. 3 the divergence between the experimental osmotic coefficients from this work and the calculated values according to Holmes and Mesmer (10~ is larger than one should expect when considering the lower reproducibility of the CsCl-data. This is also the main reason for the rather large standard deviation of the osmotic coefficients for CsC1 (cf. Table III) obtained by describing both data sets with one equation. It should be mentioned here that the data base of that compilation includes only 3 points in the area of interest with a temperature around 155~ and molalities higher than 6 molal. So their osmotic coefficients close to and beyond the upper concentration limit of validity are inter- and extrapolations on a very narrow base in comparison with this work. The results given in this work show that the osmotic coefficient is not the best choice to represent the properties of water in highly concentrated solutions with molalities above 10 molal. In accordance to Eq. (3), # depends on a division of two strongly increasing numbers - the molality m and the logarithm of the water activity ln(aw). (~ -
-lnaw
55.51
m
v
(3)
Thus the osmotic coefficient becomes almost constant, or slightly decreasing at very high concentrations, in the case of many simple electrolytes. This behavior is documented in Fig. 4. That is why one should prefer to use directly the values of the water activity as a vari-
Isopiestic M e a s u r e m e n t s at High T e m p e r a t u r e s
2
I
1071
i
i
x x
~•
x
x
-~-
++
i
x
1.8 X
X 1.6 A 1.4
A zx
1.2 z~ l
+
zx
+
,.~,. +
+
§
~
QOrat-O
"10000
I
0.8
I0'
5
I '5
20'
m in mol/kg
Fig. 3. Osmotic coefficients ~ for LiC1-H20 and CsC1-H20 at 155~ +, CsCI (this work); o, CsC1 (Ref. 10); x, LiC1 (this work); and A, LiC1 (Ref. 10). q~ 2
I
O000O(~O00DOEIO00 ~ u
I
1,8
O O00C~
0 1,6
0
0
0 0 o a
1.4
o o o
o
1.2
0 0
| ~
~A~ ~
++++++++++-+-+
o~ ~z~ ~' O ~ A z~ ~;~ ~ u
++++++++
+++++
. / ~ + +x_x + 0,8 | +
0
I 5
,
,
! 10 m in tool kg
9 15
I 20
Fig. 4. Osmotic coefficients ~ of alkaline chloride solutions at 155~ calculated with the Pitzer model: o, LiC1 (this work); A, NaC1 (Ref. 26); x, KCt (Ref.10); and +, CsC1 (this work).
able which is more sensitive to small changes in molality and composition in the area of high concentrations.
1072
Brendler and Voigt
REFERENCES
1. T. Fangh~inel, K. Grjotheim, B. Haugsdal, and W. Voigt, Acta Chem. Scand. 45, 30 (199I). 2. F. -W. Wolkny, Ph.D. Thesis (Bergakademie Freiberg, 1984). 3. A. Dittrich, Ph.D. Thesis (Bergakademie Freiberg, 1986). 4. T. Fanghanel, Ph.D. Thesis (Bergakademie Freiberg, 1984). 5. T. Fanghanel and H. H. Emons, Z. Anorg. Allg. Chem. 562, 165 (1988). 6. T. Fangh~inel, H. H. Emons, and K. Koehnke, Z. Anorg. Allg. Chem. 576, 99 (1989). 7. M. A. Urusova and V. M. Valyashko, Zh. Neorg. Khim. 32, 44 (1987). 8. V. M. Valyashko, M. A. Urusova, W. Voigt, and H. H. Emons, Zh. Neorg. Khim. 33, 228 (1988). 9. R. T. Pabalan and K. S. Pitzer, J. Chem. Eng. Data 33, 354 (1988). 10. H. F. Holmes and R. E. Mesmer, J. Phys. Chem. 87, 1242 (1983). 11. K. S. Pitzer, J. Phys. Chem. 77, 268 (1973). 12. K. S. Pitzer and J. J. Kim, J. Am. Chem. Soc. 96, 5701 (1974). 13. J. A. Rard and R. F. Platford, Activity Coefficients in Electrolyte Solutions, 2 nd edn., K. S. Pitzer, ed., (CRC Press Inc., Boca Raton, Florida, 1991). 14. K. Grjotheim, W. Voigt, B. Haugsdal, and A. Dittrich, Acta Chem. Scand. A42, 470 (1988). 15. J. A. Rard and D. G. Miller, J. Chem. Eng. Data 26, 38 (1981). 16. H. F. Holmes, C. F. Baes, and R. E. Mesmer, J. Chem. Thermodyn. 10, 983 (1978). 17. H. -H. Emons, W. Voigt, and F. -W. Wollny, J. Electroanal. Chem. 180, 57 (1984). 18. K. R. Patil, A. D. Tripathi, G. Pathak, and S. S. Katti, J. Chem. Eng. Data 36, 225 (1991). 19. T. Sako, T. Hakuta, and H. Yoshitome, J. Chem. Eng. Data 30, 224 (1985). 20. M. Yu. Matuzenko, V. I. Zarembo, and L. V. Puchkov, Zh. Obshch. Khim. 54, 2414 (1984). 21. Z. Adamcova and J. Farkova, Sb. Vys. Sk. Chem. - Technol. Praze, Fys. Chem. N7, 69 (1986). 22. F. Hoffmann, Ph.D. Thesis (Bergakademie Freiberg, 1993). 23. J. Ananthaswamy and G. Atkinson, J. Chem. Eng. Data 30, 120 (1985). 24. A. Saul and W. Wagner, J. Phys. Chem. Ref. Data 16, 893 (1987). 25. D. J. Bradley and K. S. Pitzer, J. Phys. Chem. 83, 1599 (1979). 26. K. S. Pitzer, J. C. Peiper, and R. H. Busey, J. Phys. Chem. Ref. Data 13, 1 (1984).