Chamot et al. BMC Neurology 2014, 14:192 http://www.biomedcentral.com/1471-2377/14/192
RESEARCH ARTICLE
Open Access
Item response theory-based measure of global disability in multiple sclerosis derived from the Performance Scales and related items Eric Chamot1*, Ilya Kister2 and Gary R Cutter3
Abstract Background: The eight Performance Scales and three assimilated scales (PS) used in North American Research Committee on Multiple Sclerosis (NARCOMS) registry surveys cover a broad range of neurologic domains commonly affected by multiple sclerosis (mobility, hand function, vision, fatigue, cognition, bladder/bowel, sensory, spasticity, pain, depression, and tremor/coordination). Each scale consists of a single 6-to-7-point Likert item with response categories ranging from “normal” to “total disability”. Relatively little is known about the performances of the summary index of disability derived from these scales (the Performance Scales Sum or PSS). In this study, we demonstrate the value of a combination of classical and modern methods recently proposed by the Patient-Reported Outcome Measurement Information System (PROMIS) network to evaluate the psychometric properties of the PSS and derive an improved measure of global disability from the PS. Methods: The study sample included 7,851adults with MS who completed a NARCOMS intake questionnaire between 2003 and 2011. Factor analysis, bifactor modeling, and item response theory (IRT) analysis were used to evaluate the dimension(s) of disability underlying the PS; calibrate the 11 scales; and generate three alternative summary scores of global disability corresponding to different model assumptions and practical priorities. The construct validity of the three scores was compared by examining the magnitude of their associations with participant’s background characteristics, including unemployment. Results: We derived structurally valid measures of global disability from the PS through the proposed methodology that were superior to the PSS. The measure most applicable to clinical practice gives similar weight to physical and mental disability. Overall reliability of the new measure is acceptable for individual comparisons (0.87). Higher scores of global disability were significantly associated with older age at assessment, longer disease duration, male gender, Native-American ethnicity, not receiving disease modifying therapy, unemployment, and higher scores on the Patient Determined Disease Steps (PDDS). Conclusion: Promising, interpretable and easily-obtainable IRT scores of global disability were generated from the PS by using a sequence of traditional and modern psychometric methods based on PROMIS recommendations. Our analyses shed new light on the construct of global disability in MS. Keywords: Multiple sclerosis, Disability evaluation, Patient-reported outcome measure, North American Research Committee on Multiple Sclerosis (NARCOMS) registry, Factor analysis, Bifactor model, Item response theory
* Correspondence:
[email protected] 1 Department of Epidemiology, University of Alabama at Birmingham School of Public Health, 1665 University Blvd. Suite 217H, Birmingham, AL 35294-0022, USA Full list of author information is available at the end of the article © 2014 Chamot et al.; licensee BioMed Central Ltd. This is an Open Access article distributed under the terms of the Creative Commons Attribution License (http://creativecommons.org/licenses/by/4.0), which permits unrestricted use, distribution, and reproduction in any medium, provided the original work is properly credited. The Creative Commons Public Domain Dedication waiver (http://creativecommons.org/publicdomain/zero/1.0/) applies to the data made available in this article, unless otherwise stated.
Chamot et al. BMC Neurology 2014, 14:192 http://www.biomedcentral.com/1471-2377/14/192
Background There is an acute need for a reliable and valid quantitative outcome measure of “global disability” in multiple sclerosis (MS) from the patient’s perspective. The North American Research Committee on Multiple Sclerosis (NARCOMS) registry, a volunteer registry that represents approximately 10% of the U.S. MS population affords a unique opportunity to develop and validate such a measure. Since 1998, the NARCOMS registry has employed the Performances Scales (PS) to assess perceived disability in adults living with MS [1]. Single-item PS were originally developed for eight domains of function (mobility, hand function, vision, fatigue, cognition, bladder/bowel, sensory, and spasticity) [1]. To increase content validity [2,3], three more measures were added in 2001 to assess disability associated with pain [4], depression [5], and tremor/coordination [6]. Responses are recorded on a 6-point ordinal scale (0 normal, 1 minimal, 2 mild, 3 moderate, 4 severe, and 5 total disability) except for the mobility PS which is scored from 0 to 6. The measurement properties of each individual PS are generally excellent. Non-response rates are low (1%-5%) and test-retest reliability high (median, 0.82, range 0.650.91) [1]. Evidence of criterion and construct validity is strong for virtually all the scales (Additional file 1) [4-9]. Although the PS have generally been analyzed separately, several authors have added raw scores on the eight original PS to form an ordinal summary index of disability, referred to as Performance Scales Sum (PSS-8) [1,7,10-12]. The PSS-8, has shown favorable properties in terms of internal consistency (Cronbach’s alpha, 0.78), test-retest reliability (intraclass coefficient of correlation, 0.89), and criterion validity (correlation with EDDS, 0.62-0.64; correlation with MSFC, 0.58) [1,7]. Growing evidence also supports its discriminant and incremental validity [1,10]. Furthermore only minimal response shift has been detected when administering the PS repetitively over a 1year period [11]. An important unresolved question about the PS is that of whether a single sum score, such as the PSS-8, adequately reflects underlying global disability or whether two or more summary scores are needed to validly capture information on disability domains assessed by the PS. For instance, recent factor analysis of 7 of the original 8 PS (vision scale excluded, PSS-7) suggested that a better representation of a patient’s disability might be obtained with two separate scores─one combining the mobility, spasticity and bladder/bowel PS, and the other combining the hand function, fatigue, sensory, and cognition PS [11]. We and others have described how categorical factor analysis and bifactor analysis could help uncover the fine structure of disability in MS [13,14]. In this article, we apply these methods and related techniques put forward
Page 2 of 12
by the Patient-Reported Outcome Measurement Information System (PROMIS) network [15] to the evaluation of the measurement structure of the 11 PS in a large cross-sectional sample of NARCOMS registrants. We explain how results from these analyses informed the Item Response Theory (IRT) calibration of the PS on a single scale of self-assessed global disability. Finally we compare the construct validity of three summary scores of global disability derived using assumptions and calculation methods of varying practicality and accuracy. To appeal to a wide readership, methodological details are presented in Additional file 2.
Methods Study sample
Study data included NARCOMS recruitment surveys collected in 2003–2011. Analyses were restricted to participants who completed the pain, depression and tremor PS, which were not consistently included in each intake survey, and to patients who indicated whether or not they had a confirmed diagnosis of MS. Disability items consisted of the 11 PS and the Patient Determined Disease Steps (PDDS)─a patient-assessed single-item measure of perceived disability that correlates as high as 0.78 with the Expanded Disability Status Scale (EDSS) [16]. Other variables available included calendar year of survey completion, gender, race/ethnicity, age at first symptoms, disease duration, employment status, whether the respondent was on disease modifying therapy (DMT) at enrollment, and year of MS diagnosis. The total sample was randomly split into a development sample (exploratory analyses) and a validation sample (main analyses). The NARCOMS Registry is approved by the Institutional Review Board of the University of Alabama at Birmingham. Preliminary analyses
After performing traditional descriptive statistics for the 11 PS, we conducted exploratory factor analysis (EFA) in the development sample to obtain initial information as to whether the PS should be aggregated into one or more than one disability measures (Additional file 2) [17,18]. Then, based on EFA results and the literature [19], we used confirmatory factor analysis (CFA) to test the fit of the most promising models to the data of the validation sample (Additional file 2). Item calibration and measurement
Although IRT and CFA models belong to the same family of latent variable models, IRT models provide more detailed information about the functioning of each item. IRT methods also present several advantages for rigorous scale development and score interpretation [20].
Chamot et al. BMC Neurology 2014, 14:192 http://www.biomedcentral.com/1471-2377/14/192
We performed iterative IRT analysis to accomplish the following: examine whether respondents reliably distinguished between adjacent PS categories (Additional file 2); calibrate the PS according to the assumptions of two closely-related, and similarly plausible, CFA models; and generate corresponding IRT-based scores of disability (Additional file 2) [21]. To facilitate interpretation, all IRT scores were transformed to have mean 50 and SD 15 so that >99% of scores in the NARCOMS sample would range between 5 and 95. Construct validity
Construct validity was assessed using known-group comparisons, that is, analysis was performed to compare the means of IRT scores generated in the previous step across the categories of key patient characteristics including PDDS score, age, gender, race/ethnicity, disease duration, and year of assessment. We also assessed the associations of IRT score estimates with unemployment, controlling for other potential predictors of unemployment. We used Mplus 6.1 for general psychometric analyses, IRTPRO 2.1 for IRT calibration and IRT scale score estimation, and Stata 12.1 for the other analyses.
Results Of the 12,563 persons who filled a NARCOMS intake questionnaire between 2003 and 2011, 7,851registrants with self-reported diagnosis of MS completed all 11 PS. Nearly 80% of participants were women; 93% were white, and 53% completed their intake questionnaire in 2007 or later. Mean age was 46 years (SD, 11.1); mean age at diagnosis 39 years (SD, 10), and mean disease duration 15 years (SD, 11.3). Two-third of respondents were on disease-modifying therapy; 51% were unemployed. Except if stated otherwise, all the results below were obtained from the validation sample after revision of PS response options as described in Additional file 2 (i.e., after a first round of analysis indicated that response options should be reduced from 7 to 6 for the mobility PS and from 6 to 5 for all the other PS except the fatigue PS). PSS-11 scores, (i.e., traditional raw summed scores) ranged from 0 to 43 out of a revised maximum total of 46. Preliminary analyses
EFA suggested that one or two factors (i.e., underlying dimensions of disability) might satisfactorily explain covariations among PS (Additional file 2) [22]. As a follow-up, we fitted three CFA models to the data (Additional file 2): (1) a unidimensional model, where the 11 PS represented a single construct of global disability; (2) a two-dimensional model composed of two correlated factors that we loosely referred to as “physical disability” (mobility, hand, bladder/bowel, spasticity and tremor PS) and “mental disability” (cognition, fatigue,
Page 3 of 12
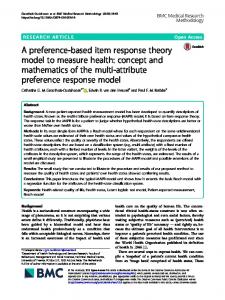
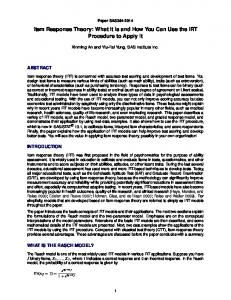
pain, sensory, depression, vision PS); and (3) a hybrid bifactor model [18,23], where the variability common to all 11 PS was captured by a general factor of global disability, and residual fractions of PS variability not accounted for by the general factor were captured by two auxiliary factors of “physical” and “mental” disability. In this latter model, a strong general factor and weak auxiliary factors would suggest that the structure of the data is “almost” unidimensional, and therefore that Model 1 might be preferred over Model 2 (we refer the readers to our article [14] for a general discussion of Models 1–3). The unidimensional model had a mediocre fit, but the PS-factor correlations were all moderate to large (mean, 0.65; range, 0.50-0.77; Figure 1). The fit of the two-dimensional model was only marginally better than that of the unidimensional model. Individual PS correlated 0.52-to-0.80 with their respective factor (means, 0.69 for the physical disability factor and 0.67 for the mental disability factor). Correlation between the two factors was high (0.83). Misfit was primarily due to the sensory PS substantially contributing to both the physical factor and the mental factor. The bifactor CFA model was specified so that the sensory PS contributed only to the general factor (i.e., to what the physical and mental PS measured in common; Figure 2). The fit of this model was excellent. Correlations between the PS and the factor of global disability were very similar to their counterpart in the unidimensional model. The largest differences in factor-PS correlations were observed for the mobility PS (correlation of 0.55 in the bifactor model vs. 0.66 in the unidimensional model) and the cognition PS (correlation of 0.56 in the bifactor model vs. 0.65 in the unidimensional model) . Both differences matched the accepted standard of ≤0.15 for a small difference [24]. This suggested that the mobility and cognitive PS would be only slightly overrepresented in scores of global disability obtained from the parsimonious, unidimensional, IRT model compared to scores of global disability obtained from the more complex bifactor IRT model. Furthermore, the variance of PS sum scores was decomposed into a large fraction explained by the factor of global disability (79%), a small fraction explained by the two auxiliary factors (11%), and a small fraction of residual error (10%) [25]. Expressed differently, 87.8% of reliable variance in the sum score represented global disability as opposed to domain-specific disability. This result was in line with the finding that only two PS had salient correlations with the factor of residual physical disability (mobility, 0.81 and tremor/coordination, 0.33) and three with the factor of residual mental disability (cognition, 0.56; depression, 0.39; and vision, 0.32). Since the auxiliary factors of a bifactor model are considered to be minor and ill-defined if they include less than three items with item-factor
Chamot et al. BMC Neurology 2014, 14:192 http://www.biomedcentral.com/1471-2377/14/192
Residual variances
Page 4 of 12
PS-factor correlations
0.56
MOBILITY
0.50
0.66
0.43
0.71
DEXTERITY
SPASTICITY
0.76 0.62
BOWEL/BLADDER 0.62
0.72
0.53
TREMOR/COORDINATION
0.68
SENSORY
DISABILITY 0.54
0.65 0.58
COGNITION 0.77
0.42
FATIGUE 0.72
0.48
0.69
0.75
0.56
PAIN
0.50
DEPRESSION
VISION
Figure 1 Unidimensional CFA model of self-assessed neurological disability in NARCOMS registrants. Note: “Disability” represents a latent factor, i.e., a not directly observable continuous variable whose scale is inferred from the variability and correlations among PS. “PS-factor correlations” are estimates of the correlations between PS and factor scores. “Residual variances” represent the fractions of PS score variability that are not explained by the factor.
correlations ≥ 0.40-0.50 [26], we concluded that scores of residual physical and mental disability might not be estimated with sufficient accuracy to be of practical importance in less than very large studies. IRT calibration and measurement
We fitted both a unidimensional- and a bifactor IRT model to the data. The bifactor IRT model replicated the measurement structure of the bifactor CFA model. The fit of both models was acceptable (Additional file 2), but neither supported the validity of a raw summed score such as the PSS-11 [27]. IRT models indicated in particular that the level of disability corresponding to a given PSS-11 summed score varied as a function of the pattern of responses to PS items. This is illustrated in Figure 3 which describes the relations between IRT scale of global disability from the unidimensional model, raw PSS-11 scores, and standing of PS categories on the IRT scale. The figure, for instance, indicates that a minimum level of fatigue disability contributed less to global disability on the IRT scale than a minimum level of mobility disability. The figure also shows that the distance between two consecutive raw PSS-11 scores varied along the IRT scale
continuum. In this situation IRT modeling offered two options. The simplest, but more approximate option was to directly convert raw PSS-11 scores into IRT summed scores by aligning the former on the more linear IRT scale. The more rigorous, but less practical option was to estimate IRT pattern scores that account for the fact that combinations of PS responses corresponding to distinct true levels of disability may yield the same raw summed score [28,29]. For each PSS raw summed score, one IRT summed score would be generated versus several IRT pattern scores. IRT summed scores would maintain the simplicity of PSS-11 scores, but at the cost of some loss of accuracy. Pattern scores would be more accurate, but too cumbersome to be calculated without a computer application. To examine the trade-offs among the most promising alternatives, we calculated IRT summed scores and IRT pattern scores of global disability from the unidimensional model, and IRT pattern scores of global disability, residual physical disability, and residual mental disability from the bifactor model. Unless stated otherwise, in what follows “summed scores” and “pattern scores” will refer to IRT scores generated from the unidimensional model, and “bifactor scores” to IRT scores generated from the bifactor model.
Chamot et al. BMC Neurology 2014, 14:192 http://www.biomedcentral.com/1471-2377/14/192
Residual variances
Page 5 of 12
PS-factor correlations
PS-factor correlations
0.04
MOBILITY
0.81 0.48
DEXTERITY
0.55
0.14 0.71
0.40
SPASTICITY
0.24
PHYSICAL
0.16
0.73 0.57
BOWEL/BLADDER 0.33
0.55 0.71
0.52
TREMOR/COORDINATION
0.72
SENSORY
GLOBAL 0.48
0.56 0.37
COGNITION 0.74
0.37
0.56 FATIGUE 0.28
0.71
0.48
0.61
0.49
PAIN
0.19
MENTAL
0.39
0.45 DEPRESSION
0.32 0.69
VISION
Figure 2 Bifactor CFA model of self-assessed neurological disability in NARCOMS registrants. Note: “Global” represents the general factor of global disability; “Physical” and “Mental” represent the auxiliary factors of “physical” and “mental” disability. Correlations among the three factors are all forced to be zero. Thus, the physical and mental factors each explain a fraction of the variability in PS scores left unexplained by the general factor. Comparisons of “Residual variances” in Figure 2 and Figure 1, provide information about the fraction of variability in PS scores that the two auxiliary factors explain above and beyond the general factor.
A graphical comparison of PSS-11 summed score levels to corresponding IRT summed score levels provided further evidence of the shortcomings of the PSS-11 summed scale─low raw PSS-11 scores (0-to-15) were shown to underestimate corresponding IRT summed scores, while high raw PSS-11 scores (21-to-46) overestimated them. (Figure 4). Therefore, in Additional file 3, we provide a conversion table that appropriately translates raw PSS-11 scores into IRT summed scores of global disability [28,29]. In contrast, differences between IRT summed and IRT pattern scores of global disability were generally small (mean, −0.07; SD, 2.1) and so were differences between pattern scores and bifactor scores of global disability (mean, 0.0; SD, 2.3). In both cases differences were near zero in the 20-to-80 IRT-score range. These results suggested that the IRT summed score approximation was unlikely to lead to clinically-relevant measurement bias.
Overall reliability of the IRT summed scores of global disability was 0.87. Construct validity
We observed positive and statistically significant associations between mean IRT scores of global disability and PDDS scores (P < 0.001; Figure 5A). Increases in IRT scores of global disability were sharper over the lower portion of the PDSS scale (0-to-2) than over its higher portion (3-to-8). Differences between summed-, pattern, and bifactor score estimates of global disability were generally minimal (standardized differences 66.7
546 (13.9)
2.74 (2.33, 3.22)
3.66 (3.12, 4.30)
3.79 (3.24, 4.43)
S ≤ 33.3
257 (6.5)
1.0c,d
33.3 < S ≤ 50
1876 (47.8)
1.17 (.99, 1.38)
50 < S ≤ 66.7
1339 (34.1)
1.56 (1.32, 1.84)
S > 66.7
454 (11.6)
2.02 (1.70, 2.40)
236 (6.0)
1.0c,d
Global disability (scaled score, S)
b
b
Residual physical disability (scaled score, S)
b
Residual mental disability (scaled score, S) S ≤ 33.3 33.3 < S ≤ 50
1678 (42.7)
1.11 (.98, 1.26)
50 < S ≤ 66.7
1783 (45.5)
1.35 (1.19, 1.52)
S > 66.7
229 (5.8)
1.53 (1.32, 1.78)
≤ 10
1713 (43.6)
1.0c
1.0c
1.0c
11 – 20
1109 (28.3)
1.06 (.98, 1.14)
1.10 (1.02, 1.19)
1.09 (1.01, 1.18)
≥ 21
1104 (28.1)
1.21 (1.13, 1.30)
1.27 (1.18, 1.37)
1.25 (1.16, 1.34)
≤ 35
749 (19.1)
1.0c
1.0c
1.0c
36 – 55
1760 (44.8)
1.01 (.91, 1.11)
1.03 (.93, 1.14)
1.02 (.92, 1.13)
≥ 56
1417 (36.1)
1.22 (1.10, 1.35)
1.31 (1.18, 1.45)
1.28 (1.16, 1.42)
Female
3102 (79.4)
1.0c
1.0c
1.0c
Male
803 (20.6)
1.04 (.98, 1.10)
1.08 (1.02, 1.15)
1.08 (1.01, 1.14)
White
3491 (90.2)
1.0c
1.0c
1.0c
African American
132 (3.4)
1.14 (.99, 1.31)
1.16 (1.00, 1.33)
1.14 (.99, 1.31)
Hispanic/Latino
120 (3.1)
1.14 (.97, 1.34)
1.11 (.95, 1.31)
1.12 (.94, 1.31)
Native American
76 (2.0)
1.11 (.95, 1.30)
1.10 (.95, 1.28)
1.09 (.94, 1.25)
Other
49 (1.3)
1.23 (1.00, 1.52)
1.24 (1.00, 1.52)
1.16 (.94, 1.43)
Yes
2614 (66.6)
1.0c
1.0c
1.0c
No
1312 (33.4)
1.05 (.99, 1.11)
1.08 (1.02, 1.14)
1.06 (1.01, 1.13)
2003-2005
1640 (41.8)
1.0c
1.0c
1.0c
2006-2008
957 (24.4)
1.01 (.94, 1.08)
1.01 (.94, 1.09)
1.02 (.95, 1.09)
2009-2011
1329 (33.8)
1.04 (.98, 1.11)
1.01 (.94, 1.07)
1.01 (.95, 1.08)
Disease duration (y.)
Age at assessment (y.)
Gender
Race/Ethnicity
Disease modifying therapy
Year of assessment
PR stands for “prevalence ratio”. Because prevalence of unemployment was high, we performed Poisson regression with robust variance estimation instead of logistic regression to obtain unbiased prevalence ratio estimates [30]. IRT scores scaled to have mean 50 and SD 15 in the NARCOMS sample. c Reference category. d Bayesian Expected a posteriori (EAP) estimates of disability (i.e., “IRT pattern scores”). e EAP summed-score estimates of disability (i.e., “IRT summed scores”). a
b
Chamot et al. BMC Neurology 2014, 14:192 http://www.biomedcentral.com/1471-2377/14/192
It is crucial for NARCOMS to make full use of the voluminous amount of self-assessed disability data collected during the past decade. For majority of respondents only the 8 original PS are available. One appealing property of IRT is that it will theoretically be possible to use our final IRT model to generate comparable summed and pattern scores of global disability from different subsets of the 11 PS, including the 8 original PS [37]. Future work will be needed to establish how reliable these scores are [35]. Equally important will be the need to determine the longitudinal validity of the IRT scales. Because the IRT framework allows one to model the effects of multiple sources of bias, it will be essential to conduct validation studies not only with IRT score estimates and conventional statistical methods, but also using latent variable methods such as multidimensional IRT modeling and IRT modeling for longitudinal data.
Conclusion In summary, our work suggests that ‘global disability’ due to MS is a statistically validated construct that may be readily assessed with the simple and quick-toadminister patient-rated PS. Although, this work was concerned with methodological issues involved in deriving such a score of global disability, it has implications for our understanding of the disease. We showed that self-assessed disability in MS can be conceptualized as a multifaceted construct encompassing elements of both physical and mental disability. Although all the elements considered were closely correlated, the balance between them varied among patients with identical global disability score. This result, derived based on statistical grounds, challenges the traditional view implicit in accepted disability scales (e.g. EDSS), that ‘physical’ disability is of primary import in MS. Additional files Additional file 1: Criterion validity of Performance Scale Sum (PSS, raw total score) and individual Performance Scales in cross-sectional studies. Additional file 2: Methodological details. Additional file 3: Performance Scales Sum (PSS-11) score to IRT summed score of global disability conversion table.
Abbreviations CI: Confidence interval; CFA: Confirmatory factor analysis; DMT: Disease modifying therapy; EAP: Bayesian expected a posteriori; EDSS: Expanded disability status scale; EFA: Exploratory factor analysis; IRT: Item response theory; MS: Multiple sclerosis; NARCOMS: North American Research Committee on Multiple Sclerosis; PDDS: Patient Determined Disease Steps; PROMIS: Patient-Reported Outcome Measurement Information System; PS: Performance Scales; PSS-7 (8: 11), Performance Scales Sum, 7-, 8-, and 11-item versions respectively; SD: Standard deviation.
Page 11 of 12
Competing interest EC serves on the NMSS Task Force on Clinical Disability Measures. IK is the recipient of a 1-year research contract from Biogen-Idec. GRC is employed by the University of Alabama at Birmingham and President of Pythagoras, Inc. a private consulting company located in Birmingham AL. He has participated in Data and Safety Monitoring Committees for the following organizations focusing on medical research: Apotek, Ascendis, Biogen-Idec, Cleveland Clinic, Glaxo Smith Klein Pharmaceuticals, Gilead Pharmaceuticals, Modigenetech/ Prolor, Merck/Ono Pharmaceuticals, Merck, Neuren, PCT Bio, Revalesio, SanofiAventis, Teva, Vivus, NHLBI (Protocol Review Committee), NINDS, NMSS, NICHD (OPRU oversight committee). He has also received consulting/speaking fees, or been on advisory boards, for Alexion, Allozyne, Bayer, Consortium of MS Centers (grant), Klein-Buendel Incorporated, Genzyme, Medimmune, Novartis, Nuron Biotech, Receptos, Revalesio, Sanofi- Aventis, Spiniflex Pharmaceuticals, Somahlution, Teva pharmaceuticals, and Xenoport. Authors’ contributions EC designed the study, conceived the statistical methodology, analyzed the data, and prepared the manuscript. IK contributed to the conception of the paper, helped in result interpretation, and provided substantive revisions. GRC helped conceive the research idea, directed data collection, advised on specific statistical issues, and contributed to the final writing of the paper. All authors read and approved the final manuscript. EC had final responsibility for the decision to submit the manuscript for publication. Acknowledgement This work was supported by the National Multiple Sclerosis Society [award number HCO127]. The funding agency played no role in study design, analysis, results interpretation, or report writing. Author details 1 Department of Epidemiology, University of Alabama at Birmingham School of Public Health, 1665 University Blvd. Suite 217H, Birmingham, AL 35294-0022, USA. 2New York University-Multiple Sclerosis Care Center, Department of Neurology, New York University School of Medicine, 240 East 38th Street, New York, NY 10016, USA. 3Department of Biostatistics, University of Alabama at Birmingham School of Public Health, 1665 University Blvd. Suite 410B, Birmingham, AL 35294-0022, USA. Received: 16 April 2014 Accepted: 23 September 2014
References 1. Schwartz CE, Vollmer T, Lee H: Reliability and validity of two self-report measures of impairment and disability for MS. North American Research Consortium on Multiple Sclerosis Outcomes Study Group. Neurology 1999, 52:63–70. 2. Gruenewald DA, Higginson IJ, Vivat B, Edmonds P, Burman RE: Quality of life measures for the palliative care of people severely affected by multiple sclerosis: a systematic review. Mult Scler 2004, 10:690–704. 3. Mitchell AJ, Benito-León J, González J-MM, Rivera-Navarro J: Quality of life and its assessment in multiple sclerosis: integrating physical and psychological components of wellbeing. Lancet Neurol 2005, 4:556–566. 4. Marrie RA, Cutter G, Tyry T, Hadjimichael O, Vollmer T: Validation of the NARCOMS Registry: pain assessment. Mult Scler 2005, 11:338–342. 5. Marrie RA, Cutter G, Tyry T, Campagnolo D, Vollmer T: Validation of NARCOMS Depression Scale. Int J MS Care 2008, 10:81–84. 6. Marrie RA, Goldman M: Validation of the NARCOMS Registry: Tremor and Coordination Scale. Int J MS Care 2011, 13:114–120. 7. Marrie RA, Goldman M: Validity of performance scales for disability assessment in multiple sclerosis. Mult Scler 2007, 13:1176–1182. 8. Marrie RA, Cutter G, Tyry T, Hadjimichael O, Campagnolo D, Vollmer T: Validation of the NARCOMS registry: fatigue assessment. Mult Scler 2005, 11:583–584. 9. Salter AR, Tyry T, Vollmer T, Cutter GR, Marrie RA: “Seeing” in NARCOMS: a look at vision-related quality of life in the NARCOMS registry. Mult Scler 2013, 19:953–960. 10. Motl RW, Schwartz CE, Vollmer T: Continued validation of the Symptom Inventory in multiple sclerosis. J Neurol Sci 2009, 285:134–136. 11. King-Kallimanis BL, Oort FJ, Nolte S, Schwartz CE, Sprangers MA: Using structural equation modeling to detect response shift in performance
Chamot et al. BMC Neurology 2014, 14:192 http://www.biomedcentral.com/1471-2377/14/192
12.
13.
14. 15.
16.
17.
18.
19.
20. 21.
22.
23. 24.
25.
26.
27. 28.
29.
30. 31. 32.
33.
34.
and health-related quality of life scores of multiple sclerosis patients. Qual Life Res 2011, 20:1527–1540. Schwartz CE, Snook E, Quaranto B, Benedict RH, Vollmer T: Cognitive reserve and patient-reported outcomes in multiple sclerosis. Mult Scler 2013, 19:87–105. Mokkink L, Knol D, Uitdehaag B: Factor structure of Guy’s neurological disability scale in a sample of Dutch patients with multiple sclerosis. Mult Scler 2011, 17:1498–1503. Chamot E, Kister I, Cutter GR: Bifactor structure of clinical disability in relapsing multiple sclerosis. Mult Scler Rel Disord 2014, 3:176–185. Cella D, Yount S, Rothrock N, Gershon R, Cook K, Reeve B, Ader D, Fries JF, Bruce B, Rose M, on behalf of the PROMIS Cooperative Group: The PatientReported Outcomes Measurement Information System (PROMIS): progress of an NIH Roadmap cooperative group during its first two years. Med Care 2007, 45(5 Suppl 1):3–11. Learmonth YC, Motl RW, Sandroff BM, Pula JH, Cadavid D: Validation of patient determined disease steps (PDDS) scale scores in persons with multiple sclerosis. BMC Neurol 2013, 13(1):37. Muthen B, Kaplan D: A comparison of some methodologies for the factor analysis of non‐normal Likert variables. Br J Math Stat Psychol 1985, 38:171–189. Reise SP, Morizot J, Hays RD: The role of the bifactor model in resolving dimensionality issues in health outcomes measures. Qual Life Res 2007, 16:19–31. Ahmed S, Mayo N, Scott S, Kuspinar A, Schwartz C: Using latent trajectory analysis of residuals to detect response shift in general health among patients with multiple sclerosis article. Qual Life Res 2011, 20:1555–1560. Hays RD, Morales LS, Reise SP: Item response theory and health outcomes measurement in the 21st century. Med Care 2000, 38(Suppl 9):28–42. Bjorner JB, Kosinski M, Ware JE Jr: Calibration of an item pool for assessing the burden of headaches: An application of item response theory to the Headache Impact Test (HIT™). Qual Life Res 2003, 12:913–933. Reeve BB, Hays RD, Bjorner JB, Cook KF, Crane PK, Teresi JA, Thissen D, Revicki DA, Weiss DJ, Hambleton RK, Liu H, Gershon R, Reise SP, Lai JS, Cella D, on behalf of the PROMIS Cooperative Group: Psychometric evaluation and calibration of health-related quality of life item banks: plans for the Patient-Reported Outcomes Measurement Information System (PROMIS). Med Care 2007, 45(Suppl 1):22–31. Reise SP: Invited Paper: The rediscovery of bifactor measurement models. Multivariate Behav Res 2012, 47:667–696. Muthén B, Asparouhov T: BSEM measurement invariance analysis. Mplus Web Notes 2013, 17:1–48 [https://www.statmodel.com/examples/webnotes/ webnote17.pdf] Reise SP, Moore TM, Haviland MG: Bifactor models and rotations: Exploring the extent to which multidimensional data yield univocal scale scores. J Pers Assess 2010, 92:544–559. Reise SP, Horan WP, Blanchard JJ: The challenges of fitting an item response theory model to the Social Anhedonia Scale. J Pers Assess 2011, 93:213–224. Andrich D: Rasch Models for Measurement. Beverly Hills, CA: Sage Publications; 1988. Thissen D, Pommerich M, Billeaud K, Williams VS: Item response theory for scores on tests including polytomous items with ordered responses. Applied Psychol Meas 1995, 19:39–49. Orlando M, Sherbourne CD, Thissen D: Summed-score linking using item response theory: Application to depression measurement. Psychol Assess 2000, 12:354–359. Zou G: A modified poisson regression approach to prospective studies with binary data. Am J Epidemiol 2004, 159:702–706. Andrich D: Controversy and the Rasch model: A characteristic of incompatible paradigms? Med Care 2004, 42(Suppl 1):7–16. Hobart JC, Cano SJ, Zajicek JP, Thompson AJ: Rating scales as outcome measures for clinical trials in neurology: problems, solutions, and recommendations. Lancet Neurol 2007, 6:1094–1095. Edelen MO, Reeve BB: Applying item response theory (IRT) modeling to questionnaire development, evaluation, and refinement. Qual Life Res 2007, 16:5–18. McHorney CA, Monahan PO: Postscript: Applications of Rasch analysis in health care. Med Care 2004, 42(Suppl 1):73–78.
Page 12 of 12
35. Reise SP, Bonifay WE, Haviland MG: Scoring and modeling psychological measures in the presence of multidimensionality. J Pers Assess 2013, 95:129–140. doi:10.1080/00223891.2012.725437. 36. Herrmann A, Pfister HR: Simple measures and complex structures: Is it worth employing a more complex model of personality in Big Five inventories? J Res Pers 2013, 47:599–608. 37. Embretson S, Reise S: Item Response Theory for Psychologists. Mahwah, NJ: Lawrence Earlboum Associates; 2000. doi:10.1186/s12883-014-0192-1 Cite this article as: Chamot et al.: Item response theory-based measure of global disability in multiple sclerosis derived from the Performance Scales and related items. BMC Neurology 2014 14:192.
Submit your next manuscript to BioMed Central and take full advantage of: • Convenient online submission • Thorough peer review • No space constraints or color figure charges • Immediate publication on acceptance • Inclusion in PubMed, CAS, Scopus and Google Scholar • Research which is freely available for redistribution Submit your manuscript at www.biomedcentral.com/submit