Iterative fuzzy clustering for detecting regions of interest in skin lesions R. Cucchiara1, C. Grana1, M. Piccardi2 1
D.S.I. University of Modena - Via Vignolese, 905 - 41100 Modena, Italy {rita,grana}@dsi.unimo.it 2 D.I. University of Ferrara - Via Saragat, 1 - 44100 Ferrara, Italy
[email protected]
Abstract. Image analysis tools are spreading in dermatology since the introduction of dermoscopy (epiluminescence microscopy), in the effort of algorithmically reproducing clinical evaluations. Color-based region segmentation of skin lesions is one of the key steps for correctly collecting statistics that can help clinicians in their diagnosis. Nevertheless, an efficient and accurate region segmentation algorithm has not been proposed in the literature yet. This work proposes an iterative fuzzy c-means clustering algorithm based on PCA with the Karhunen-Loève transform of the color space. A topological tree is provided to store the mutual inclusions of the regions and then used to summarize the structural properties of the skin lesion. Preliminary experimental results are presented and discussed.
1 Introduction Skin melanoma is a malignant pigmented skin lesion which needs particular medical attention. Its incidence as well as its associated mortality rate is rapidly increasing in developed countries. The consequences of a late diagnosis of malignant melanoma (MM) are very significant in terms of personal health, medical procedures and costs. Since it is not always easy for clinicians to distinguish between benign lesions and early MM, techniques like dermoscopy (DS, also called epiluminescence microscopy, ELM) have been developed to improve the diagnosis of pigmented skin lesions. DS is now a well recognised and established method to improve the clinical diagnosis of MM when used by dermatologists [1]. ELM is a non-invasive, in vivo technique which reveals features that are not perceivable by the dermatologist during his clinical observation. It renders the skin partially translucent and reveals the lower layers of the epidermis. Systems for computer image analysis for melanoma diagnosis that use segmentation-based shape features have been developed [6]. However, as noted in [4], these features often do not correspond to known biological phenomena and do not model human interpretation of dermatoscopic imagery. Most works in the literature concentrated on the separation of lesion from background, since it is obviously a critical preliminar step in any analytic procedure. Grayscale thresholding [7], color clustering [13], edge-finding [14] and non-linear
diffusion [4] have been proposed, while a metric for performance evaluation of the various techniques has been developed in [8]. Recently, it has been pointed out [4] that a segmentation stage should consider not only color similarity, but also spatial information. Feature extraction has mostly focused on geometrical aspects of the lesion, and only a few works deal with other characteristics such as pigmented network [4,11] or border cut-off [3]. Even if color is a key feature in dermatoscopic diagnosis (the third of the ABCD criteria presented in [1]), not much effort was provided to adequately exploit color information. In this paper we aim to provide an analysis of color regions, focusing our attention on their inclusion properties as suggested by the dermatologists’ approach, and organize them in a structured representation based on a tree whose branches represent the inclusion property while nodes contain region informations.
2 Method Our proposal is based on the work of P. Schmid [12] that proposed a fuzzy c-means segmentation over the two dimensional histogram of the first two components of the Karhunen-Loève transform of the color space. The only drawback of Schmid’s proposal is that, lacking spatial information, the number of classes is automatically obtained by a statistical evaluation of the histogram and fails to identify small color areas in the original image, being their pixels included in larger surrounding clusters in the histogram. In this section, we shortly describe the whole process, focusing on our application. The algorithm has been tested on ELM images, obtained by the use of an off-theshelf dermatoscopic microscope and directly digitized to 640x480, 16 bit per pixel color images. The application software was developed with Microsoft Visual C++ on a standard Windows PC. 2.1 Preprocessing In order to obtain a smoother outline for regions and to suppress details that are useless for the color area segmentation and sometimes only introduced by the acquisition process, we first convolve the image with a Gaussian kernel with standard deviation of one pixel. Then, since we want to obtain results similar to the dermatologist perception of color, we transform our images from the original RGB color coordinates into CIE L*a*b* color coordinates [9], a uniform color space in which equal distances mean, almost equal perceived chromatic difference. Working in a uniform color space gives us a more reliable metric for the clustering phase. 2.2 Karhunen-Loève transform The diagnosis of pigmented skin lesions, regarding color properties, relies on no more then a dozen color classes, and this hints that a color reduction method can be
used having no worries about masking relevant properties. A common way used for the reduction of data, is to discard components with less discriminating power by projecting data onto principal components with the Karhunen-Loève transform, also called Hotelling transform or Principal Component Analysis [5]. This transform consists of the projection of the vectors to be reduced on the eigenvectors of their covariance matrix, computed using the following equations:
mx = Cx =
1 M
1 M
∑ (x M
k =1
k
M
∑x k =1
(1)
k
⋅ xTk − m x ⋅ mTx
)
(2)
where M is the number of data samples and m x is the mean vector of the image. We define a matrix A whose rows are the eigenvectors of matrix C ordered by decreasing eigenvalue. The Karhunen-Loève transform of vector x is then defined by
y = A ⋅ (x − m x ) .
(3)
In our case the three components (L*,a*,b*) are to be reduced to just two components and the samples are the image pixels. Processing with the KarhunenLoève transform does not change the uniformity of the chosen color space [12]. We then discard the third component of the transform and rescale and quantize the first two components to 256 levels in order to store each transformed pixel in a bytetype variable. From this two components a 2D histogram is computed and used for the next steps.
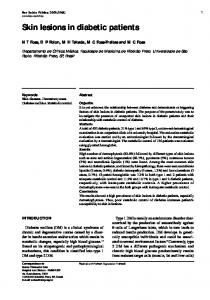
Fig. 1. Example melanocitic lesion, after the Gaussian filter preprocessing.
Fig. 2. 2D Histogram of the two KL components. Origin is top-left, the 1st component grows horizontally, the 2nd vertically. Pseudo color scale is shown on the right side of the image.
2.3 Fuzzy c-means clustering The fuzzy c-means (FCM) algorithm is a robust clustering technique, especially efficient for the cluster center computation. c being the number of classes, we use the following two recurrent equations [12]:
c x − vi U ik = 1 + ∑ k j =1 x − v k j j ≠i M
vi =
∑ (U )
m
k =1 M
ik
−1
(4)
⋅ xk
∑ (U ) k =1
2
2
1 m −1
(5)
m
ik
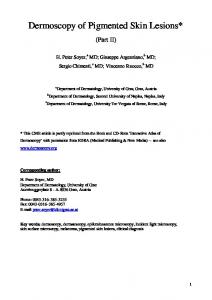
where U ik is the fuzzy membership of x k to class i and v i is the i th class center. The weighting exponent m defines the fuzziness of the membership values and in our application has always been set to 3. Details of characteristics and properties of the FCM algorithm can be found in [10] and in [2]. 2.4 Topological tree The main idea behind structuring the region decomposition of the lesion in a tree derives from the observation that the pixels group easily into two clusters, one brighter, corresponding to the healthy skin and the other darker, corresponding to the lesion. Iterating the same concept on the lesions’s interior could provide us with an informative view of the internal structure. Color is evidently the main clinical criterion in this type of analysis; however, a blind segmentation in multiple, differently colored areas could lead to segmentation into areas of poor interest (see Fig. 3, where the area corresponding to the healthy skin has been improperly split into two parts).
Fig. 3. Example of multiple-region color segmentation with no spatial constraints
We then should formally define two main concepts that will be used in the rest of the text. Def. 1: we define skin region of interest (skin ROI) a set of pixels of the skin image exhibiting three properties: uniform color, connected pixels and significant area. Given this definition, we must operatively define acceptance thresholds for the color uniformity, computed in the 2D histogram color space, for the area size and also for the degree of connectivity. About this aspect, some morphological operations can be exploited in order to obtain closure of regions with missing pixel and, at the same time, to disjoint loosely connected regions. Def. 2: a Topological Tree (TT) is a tree whose nodes are skin ROIs and the arcs topological inclusion relationships between skin ROIs. The tree construction follows a recursive procedure that starts with the analysis of the KL transform components to compute the 2D histogram relative to the region. By using fuzzy membership, it is possible to select two zones with strong belonging either to one or the other of two clusters ( U ik > TU ), and an intermediate region of non assigned pixels. We then consider the two “reliable” regions and their reciprocal position in order to select the next step of the algorithm. If it is possible to select an outer region, this is added to the tree while the other is further processed together with the non assigned pixels;otherwise, both regions are further processed. The intermediate area is added in turn to the region that will be analyzed at the next step. By iteratively applying the FCM, a topological tree of the regions is obtained, which can contain an overlapping segmentation (because of the unclassified area) and that can be used to summarize the topological properties of the lesion itself.
A pseudo-code of the algorithm follows. AnalyzeRegion (region R, node N) { if (not StopCondition (R)) { [C1,C2] = FCM (R); [Cint,Cext] = VerifyInclusion ([C1,C2]); if (exists([Cint,Cext])) { Cres = R-Cint-Cext; Nnew = AddNodeToTree (Cext,N); for each C in ConnectedComponents(Cint) AnalyzeRegion (C+Cres,Nnew); } else { AnalyzeRegion (R-C1,N); AnalyzeRegion (R-C2,N); } } else AddNodeToTree (R,N); }
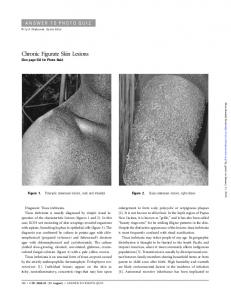
3 Results To evaluate the performance of our system, we randomly chose 16 lesions from a dermatologist’s database (8 lesions are benign and 8 lesions are malignant melanoma), as shown in Fig. 4.
Fig. 4. Example lesions extracted from a dermatologist’s database
Lesions were automatically segmented with 10 sets of thresholds for size, fuzzy membership and connectivity range and the best overall result was selected evaluating region significance by a dermatologist. Results are shown in Fig. 5.
Fig. 5. Best automatic segmentation results
Overall performance was considered quite good based on dermatologist’s opinion, finding it a useful hint about regions of interest. Cases of wrong segmentation were produced by usatisfactory evaluation of region inclusion, since regions should be considered included in some cases, even if they’re not perfectly included from a topological point of view; different topologial crtieria are under evaluation. However, minor manual correction on the selection path often produces satisfactory results.
4 Conclusions The main goal of this work was to present an iterative fuzzy clustering for segmenting significant color regions in skin lesion images. The proposed algorithm aims to extract the skin ROIs by creating a topological tree (TT), whose nodes are skin ROIs and the arcs are topological inclusion relationships between skin ROIs. The proposed technique presents some interesting novelties and is able to provide the user with a view of the lesion’s structure. However, some preliminary tests show that the algorithm should still be refined; in particular, the topological inclusion definition and its use for building the TT, though flexible and promising, must be further investigated to prevent erroneous classification in some limit cases. An interesting future direction is the study of a reliable metric to evaluate the results, starting from the metric presented in [8] and integrating dermatology’s suggestions and knowledge.
Acknowledgements The authors would like to thank Prof. Stefania Seidenari and Dr. Giovanni Pellacani from the Dipartimento di Scienze Neuropsicosensoriali of University of Modena for their help and for providing the test images.
References 1. Z. B. Argenyi, “Dermatoscopy (epiluminescence microscopy) of pigmented skin lesions,” Dermatologic Clinics, vol. 15, no. 1, pp. 79-95, Jan. 1997. 2. R.N. Dave, “Boundary Detection through Fuzzy Clustering,” Invited Paper, IEEE International Conference on Fuzzy Systems, San Diego, California, March 8-12, pp. 127134,1992 3. G.R. Day, “How blurry is that border? An investigation into algorithmic reproduction of skin lesion border cut-off,” Computerized Medical Imaging and Graphics, 24 (2000), pp.69-72 4. Matthew G. Fleming, Carsten Steger, Jun Zhang, Jianbo Gao, Armand B. Cognetta, Ilya Pollak, and Charles R. Dyer. “Techniques for a structural analysis of dermatoscopic imagery.” Computerized Medical Imaging and Graphics, 22(5):375-389, 1998. 5. R.C. Gonzales and P.A. Wintz, Digital Image Processing. Reading, MA: Addison-Wesley, 1992. 6. A. Green, N. Martin, J. Pfitzner, M. O'Rourke, and N. Knight. “Computer image analysis in the diagnosis of melanoma”. Journal of the American Academy of Dermatology, Vol. 31, pp. 958-964, December 1994. 7. Gutkowicz-Krusin D, Elbaum M, Szwaykowski P, Kopf AW. Can early malignant melanoma be differentiated from atypical melanocytic nevus by in vivo techniques? Part II. Automatic machine vision classification. Skin Res Technol 1997;3(1):15-22. 8. G.A. Hance, S.E. Umbaugh, R.H. Moss, W.V. Stoecker, “Unsupervised Color Image Segmentation with Application to Skin Tumor Borders,” IEEE Engineering in Medicine and Biology, Vol. 15, No. 1, 1996, pp. 104-111. 9. J.K. Kasson, W. Plouffe, An analysis of selected computer inter-change color spaces, ACM Trans. Graphics 11 (4) (1992) 373–405. 10. Y. W. Lim and S. U. Lee. “On the color image segmentation algorithm based on the thresholding and the fuzzy c-means techniques”. Pattern Recognition, Vol. 23, No. 9, pp. 935-952, 1990. 11. Ph. Schmid and S. Fischer. "Colour Segmentation for the Analysis of Pigmented Skin Lesions". In Proceedings of the Sixth International Conference on Image Processing and its Applications (IPA'97), vol. 2, pp. 688-692. The Institution of Electrical Engineers, Dublin, July 1997. 12. P. Schmid. "Segmentation of Digitized Dermatoscopic Images by Two-Dimensional Color Clustering". IEEE Transactions on Medical Imaging, 18(2):164-171, February 1999. 13. S.E. Umbaugh, R.H. Moss, W.V. Stoecker, G.A. Hance, “Automatic Color Segmentation Algorithms: With Application to Skin Tumor Feature Identification”, IEEE Engineering in Medicine and Biology, Volume 12, Number 3, September 1993, pp. 75-82. 14. L. Xu, M. Jackowski, A. Goshtasby, C. Yu, D. Roseman, S. Bines, A. Dhawan, A. Huntley, “Segmentation of Skin Cancer Images,” Image and Vision Computing, vol. 17, no. 1, 1999, 65-74.