Feb 15, 1985 - of different pairs (a 23 , a34, d23, and d34) an average of. 0=7.4". 0.207. 0.113. 928 the two "best" values was taken for the final results quot-.
ITIC FILE COM PHYSICAL REVIEW B
VOLUME 31, NUMBER 4
15 FEBRUARY 1985
Multilayer relaxation of the Fet 2101 surface
oDepartment
J. Sokolov* and F. Jona of MaterialsScience and Engineering, State University of New York, Stony Brook, New York 11794
In
P. M. Marcus IBM Thomas J. Watson Research Center, PO Box 218, Yorktown Heights, New York 10598 (Received 3 August 1984) The surface structure of body-centered-cubic Fef2101 has been determined by low-energy-
electron-diffraction intensity analysis. Substantial relaxations from bulklike structure in directions
)w
both perpendicular and parallel to the surface were found. The 12101 surface is the moqt open of the six Fe surfaces that have been studied, shows the largest perpendicular relaxation, involves the
ris- W'
most structural parameters (8), and has been determined to the greatest depth (down to the fifth layer). The observed structure is as follows: spacing between first and second layer d, 2 =0.50±0.03 (bulk spacing is 0.641 A), in similar notation d23 =0.57±0.03 A,
!11
1i
0
.
d3 =0.75±0.03 A, d45=0.61±0.03 A; change of registry shift between first and second layer Aa 12 =0.14±0.05 A,
in
similar
notation
Aa 23 =0.03±0.05
A, Aa 3 =0.00±0.05 A, Aa4 ,
=0.08±0.05 A.
~I.
INTRODUCTION
here provide valuable information for further develop-
Much recent work by 1o gy-electron diffraction (LEED) intensity analysis has established accurately and reliably the relaxations of the surface layers of a number of clean metal surfaces, where the term relaxation refers to rigid translations of the surface layers from their bulk positions without change of the unit cell of the surface mesh. Our work4*on higheindex, less symmetrical, more open surfaces of bcc iron, i.e., Fe12111, Fe[3101, and Fe[2101, has demonstrated the occurrence of parallel as well as perpendicular relaxations, both of which have damped oscillatory magnitudes, extend deep into the surface, and increase in magnituqe with surface . openness or roughness..rc Ut, The present work gives details of the analysis of the Fe{2101 surface, which is the most open of the six surfaces of Fe that have been studied, involves the largest number of structural parameters, and is found to have the largest perpendicular relaxation (22% contraction) of any of these surfaces. This large perpendicular relaxation is in qualitative agreement with the idea of a relaxation driven by a surface Madelung fowe arising from the flattening of the electron density at the surface, hence a Madelung force which is larger for more open surfaces. 6 The Madelung force model has been developed 7 by making simple assumptions about the electron density and the electron response and then allowing the lattice to relax so as to minimize the total energy. These models have led to interesting qualitative features of the relaxation to compare with measured relaxations, as will be noted later. However deduction of the ground state from first principles by relaxation to self-consistency of both the electron density and the nuclear positions has not yet been achieved, even for a simple metal; a transition metal like Fe would be still more difficult. Hence the results found 31
ment of the fundamental theory of metal surfaces. In addition, we note that structural changes of the magnitude found here can no longer be regarded as small and it is clearly necessary to fix the atom positions in the surface layers before quantitative theories of surface properties, e.g., vibrational models and electronicstates, are possible. The Fe[2101 surface was found to have relaxation effects down to at least the fifth layer including displacements both parallel and perpendicular to the surface. Section II gives experimental details; Secs. III and IV describe the calculations and structure analysis, respectively. II. EXPERIMENTAL The methods for preparing an oriented single-crystal Fel 2101 sample and the procedure for cleaning the crystal in uacuo were the same as for Fef3101. 5 Thirty-five LEED intensity-versus-energy spectra (31 nondegenerate) were collected with a spot photometer: sixteen spectra at normal incidence (01, 10, 11, 11, 10, 20, 11, 1-1, 20, 30, 21, 21, 02, 30, 21, and 2 1), tenspectraat 0= 7.4%,€ = 90' (00, 10, 10, 11, 11, 11, 2 1, 21, 20, and 30) and nine spectra at 0= 13 . 2 , 0= 9 0 (00, 10, 20, 30, 3 1, 12, 21, -1-, and 32). All data were collected with the crystal at room ternture and the angles and beam indices follow the convention of Zanazzi et al.8 A schematic drawing of the LEED pattern is shown in Fig. 1. III. CALCULATIONS LEED intensity spectra were calculated with the cornputer program CHANGE. 9' 1 0 The very small interlayer spacing of Fe1 2101 (db~k = 0.641 A) and the correspondingly large surface unit cell (2.87 A 6.41 ;) necessitated 1929
/~10
©1985 The American Physical Society
-
-
_4
31
J. SOKOLOV, F. JONA, AND P. M. MARCUS
1930 031
30
021
020
02
oil
010
OIT
03i
0 off
010
OTT
021
020
021
031
030
031
0surface
TABLE I. Surface lattice vector &I,and a 2, parallel component cpa of the interlayer translation vector, interlayer distance d, and mirror plane m for the bulklike Fe{2101 surface. 'I and I are directed along (210) and (100), respectively, as labeled in the top view of Fif. 2; 1 is directed along the inward normal. a =2.866 A.
LEED GUN
az Cr,
aq 3a'kV5/l0+a91/2
,m d
/2v' a(fl j
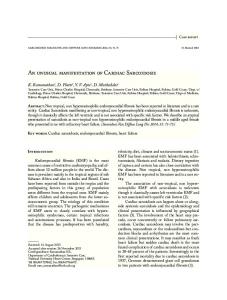
FIG. 1. Schematic LEED pattern of Fel2101 for 0=(r,
0= 9(r. IV. STRUCTURE ANALYSIS The bulklike Fe 1210
1 surface
is stepped and consists of
the use of up to 123 plane waves, or beams, to represent the wave function accurately for calculating interlayer scattering. Up to five planes of atoms were bunched together into composite layers, among which the scattering was calculated in the spherical wave basis, rather than the beam basis, and hence was not restricted to widely spaced
ic I110 steps. Top- and side-view diagrams of the surface are shown in Fig. 2; Table I gives the structural parameters. The unit cell is a rectangle with lattice vectors a, directed along a (210) axis and of length 6.41 A and
layers. The Fe potential was the same as used for previous iron work."1 Eight phase shifts were used to represent ion core scattering and the mean vibrational amplitude 115 A. The complex inner po1/=0. 1) was taken as (u tential V = Vo-ii was taken as energy independent, 6 was set up to 4 eV, and V0 was left to be determined from the intensity analysis with the initial value fixed at - 11.5
a2 along a (100) axis and of length 2.87 A. The interlayer translation vector c is in a (closed-packed) ( Ill ) direction with Ie I = 2.48 1. The interlayer spacing is 0.641 ,.and the bulklike registry of successive layers is described by the relation: cp.r=3a,/l0+a 2/2, where cp,. is the projection of c onto the 1210) plane. The surface is very open, with a packing fraction of 0.2634 (the most
I110 terraces four atomic rows wide joined by monatom-
eV.
C100>
0.641
TOPVYIW
SIDEVIEO(20
FIG. 2. Top and side views of the undistorted Fe1 2101 surface. Circles of equal thickness represent coplanar atoms, for the top view circles of decreasing thickness indicate progressively deeper layers. All distances are in A.
31
MULTILAYER RELAXATION OF THE Fe 1 21 0 1 SURFACE
1931
0608-
03
0
(.1165)
0 582
0
(.1126)
(.1119)
(.1152)
(.1136)
(.108
(.1(073) (.11061
A
(.11861
.1042.1033 (.1139)
0.556
0.439
0.460
0.482
.1044 (.088)
0503
(.1169)
0524
d12(A)
FIG. 4. Variation of the r factor for the 6=0" data set as a function of d 12 and d23 with d,.=0.748 A (0.735A), d45
'210>
FIG. 3. Schematic of the top four layers of the Fe 2101 surface. Circles, first layer; triangles, second layer; squares, third
=0.606 &(0.621 A), al 2=2.056 A, a 23=1.958 A (1.921 A), 1.995 A, and V0 = -11.5 eV. a34=1.942 1 (1.979 A), a ,= 4
layer; hexagons, fourth layer.
densely packed bcc surface, I110), has a packing fraction of 0.8330). Six layers are visible at the surface in a touching hard-sphere model and fourth-layer atoms are at a nearest-neighbor distance (2.48 A) from their closest neighbors in the top layer (see Fig. 3). Hence, there are many nonequivalent atoms which can be legitimately described as surface atoms, a fact which makes the 12101 face both interesting and complex. For example, numerous different adsorption sites exist on the surface for chemisorbed monolayers. We have performed experi-
ments studying oxygen and sulfur structures. Both oxygen and sulfur form (2 X ) overlayers but as yet the structures of these systems remain unsolved. The structural models considered included variations of the first four interlayer spacings, d12, d 23, d 34 , and d 45 (dbIlk=0.641 A), and the first four registry shifts, a12, a 23, a4, and a 45 (the registry shift between successive layers i and j is defined by cp.r=a2/ 2 +ajj, the bulk value of aj is 1.923 A). The first series of calculations involved independent variations of the first three interlayer spacings and the top-layer registry, by relatively large amounts, in order to
TABLE II. Results of calculations for 0=0" of various structural models: d12, d2 3, and d4 are the first three interlayer spacings, a12and a 23 are the first two interlayer registry parameters (see text). The agreement between theory experiment is given by the reliability factor r. All distances are in A. Run
d12
d23
1(bulk) 2 3 4
0.641 0.561 0.587 0.561
0.641 0.641 0.614 0.614
5
0.561
6 7 8 9 10 11 12 13 14 15 16 17 18 19 20 21 22 23 24 25
0.561 0.534 0.534 0.561 0.561 0.534 0.534 0.540 0.518 0.518 0.518 0.518 0.508
U.4!7 0.503 0.503 0.503 0.503 0.496 0.496
a12
a23
a4
r
0.641 0.641 0.641 0.641
1.923 2.188 2.320 2.452
1.923 1.923 1.923 1.923
1.923 1.923 1.923 1.923
0.293 0.216 0.236 0.249
0.667
0.641
2.188
1.923
1.923
0.226
0.640 0.587 0.587 0.587 0.693 0.640 0.693 0.667 0.667 0.614 0.614 0.598 0.598 0.598 0.598 0.598 0.598 0.598 0.581 0.581
0.667 0.641 0.641 0.641 0.641 0.641 0.641 0.640 0.640 0.640 0.667 0.693 0.693 0.693 0.730 0.730 0.730 0.704 0.708 0.708
2.320 2.188 2,055 2.055 2.188 2.188 2.188 2.188 2.188 2.188 2.188 2.188 2.1O 2.108 2.108 2.108 2.108 2.055 2.056 2.056
1.923 1.923 1.923 1.923 1.923 1.923 1.923 1.923 1.923 1.923 1.923 1.923 1.923 1.923 1.923 1.976 2.029 1.997 1.995 1.995
1.923 1.923 1.923 1.923 1.923 1.923 1.923 1.923 1.923 1.923 1.923 1.923 1.923 1.923 1.923 1.923 1.923 1.923 1.923 1.976
0.235 0.208 0.185 0.194 0.270 0.187 0.270 0.179 0.164 0.154 0.144 0.142 0.138 0.132 0.127 0.127 0.128 0.124 0.118 0.115
r
1932
J. SOKOLOV, F. JONA, AND P. M. MARCUS
TABLE III. r factors for the bulklike and fully relaxed models for data collected at three angles of incidence. Data set
r factors Relaxed Bulldike
0=-0
Energy range (eV)
0=7.4" =90
0.293 0.207 0.0.32ed
0.103 0.113
1958 928
0= 13.2 *
0.347
0.125
716
Total
0.282
0.110
3602
31
certainties (for a discussion of uncertainties in LEED, see Sokolov et al.4), the analysis was considered finished. An example of the sensitivity of the r factor to the parameter values is given in Fig. 4 for the pair (d 12 ,d23). For the variables whose best values were determined as members of different pairs (a 23 , a34, d 23 , and d34) an average of the two "best" values was taken for the final results quotbelow. In all cases, the difference between the two best values were 0.01 A or less. The results of the analysis (with estimated errors following Sokolov et al. 4) were as follows: (bulk interlayer spacing 0.641 A, bulk layer-tolayer registry shift 1.923 A) d 12 =0.50±0.03 A (22.0±4.7% contraction), d 23 =0.57±0.03 , (11.1±4.7% contraction),
get a general idea of what the optimum structure might be. Agreement between theory and experimental spectra was measured using the numerical reliability factor of Zanazzi and Jona. 12 For each calculation, the value of the nonstructural parameter V0 , the real part of the inner potential, was allowed to vary independently from -7.5 to -15.5 eV; the best value was always close to -11.5 eV. A sampling of the first set of calculations (about - of the
d4=0.75±0.03 A (17.0±4.7% expansion), d45=0.61+0.03 k (4.8±4.7% expansion),
total number of calculations) is shown in Table II labeled with run numbers 1-20. Next, preliminary calculations were made varying the second and third registry shifts, a 23 and a34 (runs 21-25 of Table 11 are a sampling). At
a 45 =2.00±0.05 A (4.0±2.6% increase), Vo=-1.5+1.0eV
al 2 =2.06±0.05 A (7.1±1.6% increase), a 23 = 1.95±0.05 A (1.4±2.6% increase), a.=1.92±0.05 A (0±2.6%),
r.i n =0.103 (r factor of Zanazzi and Jona' 2for 16
this stage, the calculations indicated that the best models were those with d 1 2 contracted ( -20%), d 2 3 contracted (C-10%), d34 increased ( 11%), a 12 , a 23 , and a34 increased by approximately 7%, 4%, and 3%, respectively, compared to the bulk values. The next series of calculations fixed all but two of the structural parameters (set near to the corresponding values found above) and then allowed the remaining two parameters to vary independently until a two-dimensional minimum of the reliability factor was located. The best values of the two variables were determined by fitting the r (reliability) factors to a quadratic function (elliptic paraboloid) near the minimum. With the best values thus obtained, a new pair of variables was chosen and the process repeated. Over-
beams at 0=0).
lapping of pairs was considered, for example (d, 2 ,d23 ), (d 34 ,d45 ), and (d 23,d34); when the consistency among optimum values determined as members of different pairs was as good or better than the estimated experimental un-
al problem, involving eight structural parameters, is notably more difficult than any other attempted so far for metal surfaces. Thus. the optimization process carried out in this work is not exhaustive, and further refinement would be expected to improve the agreement between theory and experiment (partirilarly for spectra like the 2 1 beam at 0 =0' and the 30 beam at 0 = 7.4, =90 ). To summarize, the loosely packed Fe{ 2101 surface was
(1.92) 200 045
9Z.92) 1.92 034
M
K) (M (192) 2.06 EXP.
023
012
SEX OLK) .210, .
0,50 (0.640) (0.6411
0.57
•
e
34 d45
0.75 0.61
(0.640 (0.641)
The percentage changes are with respect to the bulk values. Figure 5 shows a schematic representation of the optimized structure. Calculations were then made with the above optimum values for the data sets taken at off-normal incidence. Because of the extreme length of the calculations (about 4 h of CPU time on an IBM 3081 computer), it was not possible to repeat the 0=0' analysis for the other data sets. Table III gives the r factors for both the bulklike and fully relaxed models for all 35 I-vs- V spectra and Figs. 6-8 show the plots of the corresponding curves. It should be emphasized at this point that this structur-
parallel found to have large relaxations, both normalind to the surface plane. 1he pattern of contraction, contraction, expansion, and contraction for d12 , d 23 , d34, and
d 45, respectively, is in agreement with the form predicted for bcc Na1210J.' However, our results for the parallel relaxations (all parallel motions in the same direction) do not agree with the results of Barnett et al.7 The calcula-
)SIE
VEW OF Fe (210)
FIG. 5. Schematic of relaxed Fe{2101 surface with optimized structural parameters. All distances are in A.
tions did not include the effects of screening of the ions by valence electrons and so it is an open question as to whether a more refined theory would give results closer to the observed Fet 2101 structure or differences between the
31
MULTILAYER RELAXATION OF THE Fel2101 SURFACE (a)
1933
8-0-()F(1)80
1'{21
0.058
HIRLXD
THRIRELAXED)
-.
3
OTEXP
iEP
M (SU
-,21
12THRRIOLXE) -012
*ORLXE)-.050
TN(RELAXED)
IOEP
30 £XP.
..
,-.92T(OM.KI
s
IR(LK
I
L
(
(W r-0,114
2
THRfRELAXED)
TIIR(RELAXEO)
,ou 2 EP
IIEXP 'iEXP r.
3C
/\T /\71(BLLK) 70
50
21EXP
.427P
90
110
130
150
..
170
30
I90
THRMILK)
0.220
50
90
T0
ENERGY (.V)
It0o
3 ISO15
fo
190
ENERGY (ev)--
Cd)
j
I
(I
~*O218F420} 0
,0.092
THR (RELAXED)
THR (RELAXED)I
02 EXP I0 E. '0 545
Ce)!(k
j
NIULI
THR(BMJK)
-*0506
rI.4
IHfELX0I.0
::::LAED)
ZOEXPP
h
-0.094
V
T(RELAXED)
50
70
,-O076 I 1 I 90 110 15) ENERGYWev
(BULK) TIIR
-0266 I.
170
190
I
2I
TNR(BULK) ISO
IEXE
-0.0?0
IEXP
1fFX
30
THR(RELAIIEO)
I
iXX
30
I 2 s0 70
90
110 130 ENERGYWVY)
150
ITO
190
FIG. 6. Experimental and calculated LEEI) spectra for 0=O . Theoretical curves are shown for both the bulklike and fully relaxed models.
1934
1. SOKOLOV, F. JONA, AND P. M. MARCUS
31
THR(RELAXED)
.063
YR(RELAXIO
iIEIP
TTHRIEII
(b
.. in
T 111011
RIEAE(()(h)
WRLXD
'.0105.0-
N (H RELAXED)2
X
II EXP.
Ir0402
THR(IRAN
THRIRULK)
TH0I NNELAWDI
(c)) '.0.093
~
THTNE(RELA ED)
I
ioEXP ,-0,103
THRIRELAXED)
I..07 I I
iOExP
~IIEXP
~
T~S~
''
L
Tor IWAKe)
30
ENRG (@
90
130
?0
S
110
(.V(
150
70 ITO
10EWG 190
(00I10
ENERGY
-0 178
BO
50
'o
so
0
Io
30
Io
N
FIG. 7. Same as for Fig. 6 but for 0 =7.4%490r.
Td Iq)
(a)
I
Fe(210) 8 13 2.
I
I
I
I
Ie20
90'()
11(1)81.2,#.o()
*20
RLAXEG -0185 03-
90
THR(RE'LAXED;
EXP.
XP.0
-0EXP
TKRI1111M)
'.0 574
(e) TR)EAXO
4
15
-020TR(LK-0256
(b)
g13
TR(RELAXEOI
III
TMR(SULRI
(hI.0' '-
.019e
IR
257
IEXP
TRRLXD
(RELAXED)
3EP
R1RLK)
-0,667
1.63
PX
1((R
TRAILAE RELAXED)
0)-,054
INRIRELAXEOMI
i~aIMIEXP
50
70
90
.10
.30
7(1
-11
'.0036 30
]so
(70
190
30
50
70
90
ENERGY l@V)
to0
(30
130
(70
I90
ENERGY1W)
30
50
TO
90
((0
(30
(5
0 T
190
ENERGY(W)
FIG. 8. Same as for Fig. 6 but for 0= 13.2, 46= 90.
electronic structure of Na (a simple metal) and Fe (a transition metal) are important. ACKNOWLEDGMENTS Two of the authors (J.S. and F.J.) gratefully acknowledge partial support of this work by the Office of
Naval Research. J.S. also acknowledges financial support from the American Vacuum Society. The iron crystals used in this study were grown from ultrapure material provided by the American Iron and Steel Institute through Dr. C. A. Beiser of the National Steel Corporation and Dr. J. D. Myers of the Battelle Columbus Laboratories.
31
MULTILAYER RELAXATION OF THE Fe1 210) SURFACE
*Present address: Weizman Institute of Science, Rehovot, Israel. 1H. L. Davis, J.R. Noonan, and L. H. Jenkins, Surf. Sci. 83, 559(1979). 2 D. L. Adams, H. B. Nielsen, J.N. Andersen, I. Stensgaard, R. Feidenhans'l, and J.E. Sorensen, Phys. Rev. Lett. 49, 669 (1982). 3 H. B. .N1esen, J.N Andersen, L. Petersen, and D. L. Adams, j.Phys. C 15, L1113 (1982). 4j.Sokolov, H. D. Shih, U. Bardi, F. Jona, and P. M. Marcus, J. Phys. C 17, 371 (1983). 5J. Sokolov, F. Jona, P. M. Marcus, Phys. Rev. B 29, 5402
Accession For
NTIS
GRA&I
'
DTIC TAB
Unannounced Justification,.
Dlot .ibuto/ Avatlability Codes
Dist
vafl and/or Spooi4
COPY
1935
(1984); Solid State Commun. 49, 307 (1984). M. W. Finnis and V. Heine, J.Phys. F 4, L37 (1974). 7R. N. Barnett, U. Landman, and C. L. Cleveland, Phys. Rev. Lett. 51, 1359 (1983). 8 E. Zanazzi, F. Jona, D. W. Jepsen, and P. M. Marcus, Phys. Rev. B 14, 432 (1976). 9 D. W. Jepsen, Phys. Rev. B 22, 5701 (1980). 10D. W. Jepsen, H. D. Shih, F. Jona, and P. M. Marcus, Phys. Rev. B 22, 814 (1980). "K. 0. Legg, F. Jona, D. W. 3opsen, and P. M. Marcus, J. Phys. C 10, 937 (1977). 12 E. Zanazzi and F. Jona, Surf. Sci. 62, 61 (1977). 6