Andrei Serafimovich*, Thomas Foken. University of ... (USA-1 Metek GmbH, CSAT3 Campbell Scientific, ..... Thomas, C., T. Foken, 2007a: Flux contribution of.
J2.4 IMPACT OF GRAVITY WAVES ON THE TURBULENT EXCHANGE ABOVE A FOREST SITE Andrei Serafimovich*, Thomas Foken University of Bayreuth, BayCEER, Department of Micrometeorology, Bayreuth, Germany
Carmen J. Nappo CJN Research Meteorology, Knoxville, TN, 37919, USA
1. INTRODUCTION Gravity waves are an essential part of the dynamics of the atmosphere on a wide band of meteorological scales. Their importance as a source for energy and momentum transport is widely accepted. Due to their wide range of wavelengths and periods, phase and group speeds, propagation of gravity waves affect a wide range of atmospheric phenomena on large synoptic to micrometeorological scales. The energy and momentum transported by gravity waves is transferred to the mean flow (Nappo, 2002) or dissipated in the form of turbulence (Einaudi and Finnigan, 1993; Smedman et al., 1995) enhancing turbulent transport when the wave becomes unstable and brakes. Another important phenomenon in the atmospheric boundary layer is that of coherent structures. Over the past few decades coherent structures have become a key point of many studies in the turbulence research of flow dynamics in laboratory flows and the atmospheric boundary layer (Raupach and Thom, 1981; Bergström and Högström, 1989; Gao et al., 1989; Shaw et al., 1989; PawU et al., 1992; Raupach et al., 1996; Brunet and Irvine, 2000; Thomas and Foken, 2007b). Coherent structures appear in measurements of wind, temperature, or scalar concentration as approximate periodic ramps connected with the ejection-sweep cycles (Katul et al., 1997; Finnigan, 2000; Foster et al., 2006) and contribute significantly to the turbulent transport above and within the canopy (Maitani and Shaw, 1990; Katul et al., 1997; Thomas and Foken, 2007a). However, interactions between coherent structures and waves are still poorly understood, and a generalized theory regarding turbulent mixing and turbulent flux exchange in the presence of periodic atmospheric wave motions is missing. On the other hand, there is a relative lack of studies dealing with the local effects produced by gravity waves propagating along a specific site.
The main objective of this work is to study a gravity wave in connection with a strong wind shear event and to develop a comprehensive analysis of the wave characteristics using linear theory. The effects of the wave propagation close to the surface and their impact on coherent structures and turbulent exchange in the vicinity of a tall canopy will be examined.
2. EXPERIMENT SETUP The results presented here are obtained in the frame of the EGER project (ExchanGE processes in mountainous Regions). This project is focused on the detailed investigation of interaction processes among different scales and their role in the budgets of energy and matter within the soilvegetation-atmosphere system. The overview of the project can be found in Foken et al. (2010). Data were obtained in the period of June-July 2008 during the second intensive measuring campaign (IOP-2) of the project. The experiment was carried out at the FLUXNET site Weidenbrunnen Waldstein (DE-Bay, 50°08'N, 11°52'E). The site is located at an altitude 775 m a.s.l. in the Fichtelgebirge Mountains in NorthEastern Bavaria, Germany. The coniferous canopy mainly consists from spruce trees with mean canopy height hc=25 m. A detailed description of the site is given in Gerstberger et al. (2004) and the reference data can be found in Staudt and Foken (2007). The experimental design of the second intensive observation period almost repeats the design of the first campaign Serafimovich et al. (2010). High frequency measurements (20 Hz) of wind components (u,v,w), sound temperature Ts, density of carbon dioxide CO2 and water vapor H2O were performed. Six ultrasonic anemometers (USA-1 Metek GmbH, CSAT3 Campbell Scientific, Inc., Solent R2 Gill Instruments Ltd.) and six fastresponse gas analyzers (LI-7000 and LI-7500, LICOR Biosciences) were installed on the 36 m tall tower at 0.09, 0.22, 0.52, 0.72, 0.92, 1.44 hc levels
and one ultrasonic anemometer and fast-response gas analyzer were installed at 1.28 hc level on the second 32 m tall tower standing 60 m away from the above one. The atmospheric boundary layer was profiled with an acoustic and radioacoustic radar remote sensing system SODAR-RASS. The measurements were performed with a system consisting of a phase array Doppler SODAR DSDPA.90-64 with a 1290-MHz-RASS extension by Metek GmbH. The acoustic sounding system was located at a distance of approximately 250 m from the towers in a forest clearing. Two operating modes were used. Vertical wind speed and temperature were measured using the first mode for 25 minutes. The vertical range of measurements was from 20 m to 200 m a.g.l. In the second mode the atmospheric boundary layer was profiled for a period of 5 min up to an observational level of 900 m, using a vertical resolution of 30 m. This gave a mean profile of the wind vector. A second SODAR (referred to as miniSODAR) without a RASSextension was installed 500 m away and provided 5 minute mean wind profiles up to 200 m a.g.l.
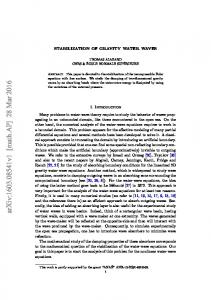
3. METEOROLOGICAL SITUATION West and south-east winds prevail over the canopy at the Waldstein site. Such a west wind was observed during the day time from 9:00 to 20:00 on 30 June, 2008 (Figure 1). The wind speed rose up to reach the maximum 4 m/s at noon and then fell to 1.2 m/s. At 20:00 wind started to change its direction, increasing the
amplitude. This effect lasted for 4 hours till 24:00. During this period the wind speed increased to 3.7 m/s with wind gusts up to 6.8 m/s and then decreased to 2.1 m/s, and the wind changed its direction from west to south-east. Figure 2 shows height-time cross-sections of the zonal, meridional and vertical wind components observed by the SODAR/RASS system over Waldstein site. During the day time on June 30 in the atmospheric boundary layer the meridional wind was weak, whereas a strong zonal wind component on the order of 8 m/s indicates an westerly wind. As mentioned above the situation changes at 20:00 CET. The zonal wind component decreases until 01:00 CET and reaches -8 m/s, and meridional wind component increases until 01:00 CET and reaches a clear maximum on the order of 8 m/s between 250 and 350 m at 05:00 CET. The vertical wind component is mostly positive during the day time on June 30, then falls to small values around zero at 24:00 and reaches the negative maximum at 04:00 CET. The situation observed describes the evaluation of the low level jet with a strong shear effect. Unfortunately, due to the effect of environmental noise the SODAR/RASS data contain a lot of gaps during the period of the wind rotation (dark blue area on Fig. 2). Therefore, for the analysis the wind measurements observed with the miniSODAR system will be used. In the following section the generation of a gravity wave under meteorlogical conditions described above will be proved and the wave impact on the turbulent transport will be discussed.
Figure 1: Mean wind speed (line) and wind direction (dots) averaged for 30 min at the 32 m height for the period June 30 to July 01, 2008 during IOP-2.
Figure 2: Zonal (a), meridional (b), vertical (c) velocities measured with SODAR/RASS for the period 10:00 June 30 to 10:00 July 01, 2008 during IOP-2. Dark blue color correspond s to gaps.
4. RESULTS AND DISCUSSION To examine background wind fields and localize wave motions in time and height a wavelet transform has been applied to miniSODAR wind measurements. Figure 3 shows wavelet power spectra of zonal and meridional winds. The bold cyan line outlines the region with 95% significance level. The area above the green line (Fig. 3 a, c) and on the right hand-side from the green line (Fig. 3 b, d) indicates the cone of influence. The wavelet power spectra of time series (Fig. 3 a, c) show significant wave periods between 0.6 - 1.1 hours. The remarkable feature is that initially the wave motion is observed in the meridional wind between 20:00 - 22:00 CET on July 30 and then in the zonal wind between 22:00 - 24:00 CET on July 30. Furthermore, the significant vertical wavelength on the order of 30 - 70 m at the altitudes between 40 - 140 m was
found in the wavelet power spectra of zonal and meridional wind profiles (Fig. 3 b, d). In evaluating the results of the wavelet transform for the frequency content, bandpass filter parameters can be defined to filter out a gravity wave from the background wind flow. In this study the bandpass filter was constructed with a bandwidth of 0.6 - 1.6 h in the time and 20 - 90 m in the height. Fast Fourier transform (FFT) was used to filter out the gravity wave with dominant observed frequency 64 min and wavelength 53 m. To avoid the sidelob effects and unwanted responses the signal was multiplied by the Hanning window. First, the FFT was applied to the time series and a mean contribution of each frequency was derived. By the removal of unwanted harmonics the range of interest (0.6 - 1.6 h) was selected and wind perturbations were obtained through a reconstruction using the inverse FFT and devision by the Hanning window. The same principle was applied to vertical profiles
of horizontal winds to derive wind perturbations in the range of interest of 20 - 90 m. The resulting wind perturbations are shown in Fig. 4. The dashed lines indicate lines of constant phase with preferred downward phase propagation. The vertical and temporal distances between the phase lines correspond to vertical wavelength and observed period detected with the wavelet transform (Fig. 3), respectively. The analysis of the rotary spectrum (Thompson, 1978; Guest et al., 2000) reveals the presence of an inertia-gravity wave and its dominant vertical energy propagation. Figure 5 shows the rotary spectrum applied to wind perturbation after bandpass filtering with bandwidth of 0.6 - 1.6 h in time and 20 - 90 m in height. The spectra were averaged for the period of wind rotation effect from 20:00 CET to
24:00 CET on June 30. The spectrum maximum indicates the presence of the gravity wave with the vertical period 53 m. The rotary spectrum shows in its negative part the weaker clockwise rotational power corresponding to upward energy propagation and in its positive part the stronger counterclockwise rotational power corresponding to a dominant downward energy propagation, respectively. The spectrum is significant except at the peak in the negative part due to the variability for averaged period. The hodograph analysis (Gill, 1982) applied to the horizontal wind profile measured at 22:30 CET on June 30 (Fig. 6) reveals downward energy propagation from the counterclockwise rotational sense. The ratio of the fitted ellipse is 0.42 and major axis is directed to 7° from the north.
Figure 3: Wavelet spectra of zonal (a,b) and meridional (c,d) winds. The left panel (a,c) shows wavelet spectra of the time series, the right panel (b,d) shows wavelet spectra of the height profiles.
Figure 4: Zonal (a) and meridional (b) wind perturbations on 30 June 2008 from 20:00 to 24:00 after band pass filtering with bandwidth of 0.6 - 16 h in time and 20 - 90 m in height.
Figure 5: Rotary spectrum averaged for 4 hours from 20:00 CET to 24:00 CET on 30 June 2008. Circles and diamonds correspond to 95%, and 99.9% significance levels, respectively.
Figure 6: Hodograph of the wind perturbations measured at 22:30 CET on 30 June 2008 (solid line measured profile, dashed line - fitted ellipse, circle starting point of the hodograph, labels correspond to height above the ground).
The full turn of the hodograph corresponds to the vertical wavelength on the order of 70 m and the intrinsic period of the gravity wave derived from the axes ratio of the fitted ellipse was found to be on the order of 6.6 h. To receive a more statistical description of the gravity wave field, the Stokes parameter technique was applied (Eckermann and Vincent, 1989). The Stokes parameters derived from miniSODAR measurements and averaged over the period 20:00 - 24:00 June 30 are presented in Table 1. The ratio of the polarization ellipse was found to be on the order of 0.65 and the major axis is directed to 31.2° from the north. Table 1: Stokes parameters derived from miniSODAR measurements on 30 June 2008.
Filter band (time, height) Averaged time (CET)
0.6-1.6 h,20-90 m 20:00 - 24:00 30 June, 2008
Degree of polarisation, dm1,m2
0.28
Major axis orientation, Θm1,m2
31.2°
Phase difference, δm1,m2
-68.8
Ellipse axial ratio, Rm1,m2
0.65
To derive the gravity wave characteristics a solution of three equations was used: the dispersion relation, the polarization relation, and the Doppler equation. The equations and their solution can be found in Serafimovich et al. (2005). The ellipse ratio Rm1,m2 was obtained by the Stokes parameter analysis, the vertical wavenumber m is given by the evaluation of the wavelet or Fast Fourier transforms (Fig. 3 b, d and Fig. 5). The coordinate system was rotated to the direction of the wave propagation Θm1,m2 obtained by the Stokes parameter technique. In this system the mean horizontal wind component U is oriented in the wave propagation direction and the mean horizontal wind component V is oriented to the direction which is perpendicular to the direction of the wave propagation Θm1,m2. The Brunt-Väisälä frequency N was derived from temperature measurements with SODAR/RASS system and Coriolis parameter f is a constant for a given location (the value over Waldstein site is 11.2*105 rad s-1). The dispersion relation and the polarization relation were then solved to obtain the intrinsic frequency ωin and the horizontal wavenumber k. The derived gravity wave characteristics are presented in Table 2.
The results indicate that a gravity wave with a horizontal wavelength on the order of 3.4 km, intrinsic period 7.6 h and vertical wavelength 53 m occurs over the measuring site. Due to the Doppler effect the observed period of the wave relative to the fixed position was found in the order of 1.06 h. It should be noted, that the Doppler relation between intrinsic and observed periods of the detected gravity wave is sensitive to the background wind speed, but the equation is fulfilled only if the propagation from south-west to north-east is selected resulting in the negative horizontal wavenumber. Table 2: Gravity wave parameters derived from analysis of Stokes parameter sprectra.
, m/s Mean horizontal wind, U (in the wave propagation direction) Wind shear component,
∂ V /∂ z , s-1
-1.8 2.9 10-3
Brunt-Väisälä frequency, N, s-1
11.9 10-3
Coriolis parameter, f, rad s-1
11.2 10-3
Intrinsic period, 2π/ωin, h
7.3
Observed period, 2π/ωob, h
1.06
Horizontal wavelength, 2π/kh, km
-3.4
Vertical wavelength, 2π/m, m
53.3
Horizontal phase velocity, vph, m/s
-13.0 10-2
Vertical phase velocity, vpz, m/s
0.2 10-2
Horizontal group velocity, cgh, m/s
-9.0 10-2
Vertical group velocity, cgz, m/s
-0.14 10-2
To extract coherent structures and estimate coherent transport and Reynolds fluxes the eddy covariance measurements of wind, sonic temperature, CO2 and H2O concentrations were used (Thomas and Foken, 2005). A clear impact of gravity wave propagation over a measuring site was found in the turbulent momentum exchange. As shown in Fig. 7 (black line) the estimated Reynolds-averaged momentum flux reaches the first maximum on the order of 1.1 m2/s2 around noon and the second maximum is observed between 20:00 and 24:00 when the gravity wave occurs. During this period the momentum transport by coherent structures is higher as well (Fig. 7 grey points) and reaches 20% of the Reynolds flux. The sensible heat, latent heat and carbon dioxide fluxes are not affected by the gravity wave (not shown here).
Partitioning the momentum flux transported by coherent structures during ejection and sweep phases (Fig. 8 black line and gray points, respectively) one can see that before the gravity wave appears momentum above the canopy is transported mostly by “sweep” events reaching almost 100% at 20:00, whereas after that the contribution of the “ejection” phases is higher to the momentum transport. This suggests that turbulent exchange by sweep motions is suppressed by downward propagated gravity waves whereas the ejections are compensating for this effect.
Figure 8: Ratio of the momentum flux transported during the “ejection” phase (black line) and the “sweep” phase (gray line) to the total momentum flux transported by coherent structures measured at the height 36 m for the period June 29 to July 01, 2008 during IOP-2.
5. CONCLUSIONS In this work, a complete study of the gravity wave characteristics and wave effects on the coherent momentum exchange above the canopy
level has been presented .The gravity wave, detected during the second intensive observation period of the EGER project, was connected to the wind rotation and wind shear event in the upcoming low-level jet observed in the Fichtelgebirge mountains, North-Eastern Bavaria, Germany. To filter out the wind perturbations associated with the gravity wave the wavelet transform of the mean wind measurements was used. The wave characteristics were analyzed using the rotary spectrum, hodograph, and Stokes-parameter spectral analysis. Evaluation of the equations of the linear theory showed that the wave propagates from south-west to north-east and has the intrinsic period 7.3 h which due to the Doppler shift corresponds to the observed period of about 64 min. The horizontal and vertical wavelengths were derived on the order of -3.4 km and 53 m, respectively. During the wave event the analysis revealed stronger counterclockwise rotational power corresponding to the downward energy at the height range between of 40-120 m. In connection with the downward wave energy propagation the impact on the turbulent momentum exchange above the forest measuring site was found. The occurrence of a gravity wave in the vicinity of the canopy leads to a higher transport of the momentum and an increase of the turbulent exchange by coherent structures. The partitioning of the momentum transport between the sweep and ejection phases of coherent structures shows a higher activity of sweeps in the turbulent momentum exchange before the gravity wave event and higher momentum transport by the ejection phases when the gravity wave is observed. Moreover, Foken et al. (2010) found the strong inflow of fresh air with low NO2 and high O3 connected with this gravity wave event.
Figure 7: Reynolds momentum flux (black line), momentum flux transported by coherent structures (gray dots) measured at the height 36 m for the period June 29 to July 1, 2008 during IOP-2.
6. ACKNOWLEDGMENTS The project was funded by the German Science Foundation (FO 226/16-1, ME 2100/4-1, ZE 792/4-1). The authors wish to acknowledge the technical support given by the staff of the Bayreuth Center for Ecology and Environmental Research (BayCEER) of the University of Bayreuth. The authors also wish to gratefully acknowledge all those who supported the field measurements, especially Lukas Siebicke, Katharina Staudt, Stephanie Schier, Johannes Lüers and Johannes Olesch for advice, comments and technical assistance.
7. REFERENCES Bergström, H., U. Högström, 1989: Turbulent exchange above a pine forest II. Organized structures. Boundary-Layer Meteorology, 49, 231–263. Brunet, Y., M. R. Irvine, 2000: The control of coherent eddies in vegetation canopies: streamwise structure spacing, canopy shear scale and atmospheric stability. BoundaryLayer Meteorology, 94, 139– 163. Eckermann, S., R. Vincent, 1989: Falling sphere observations gravity waves motions in the upper stratosphere over Australia. Pure and Applied Geophysics, 130, 509–532. Einaudi, F., J. J. Finnigan, 1993: Wave-turbulence dynamics in the stably stratified boundary layer. Journal of the Atmospheric Sciences, 50, 1841–1864. Finnigan, J., 2000: Turbulence in plant canopies. Annual Review of Fluid Mechanics, 32, 519– 571. Foken, T., F. Meixner, E. Falge, C. Zetzsch, A. Serafimovich, A. Bargsten, T. Behrendt, T. Biermann, C. Breuninger, T. Gerken, M. Hunner, L. Lehmann-Pape, K. Hens, G. Jocher, J. Kesselmeier, J. Lüers, J.-C. Mayer, A. Moravek, D. Plake, M. Riederer, F. Rütz, S. Schier, L. Siebicke, M. Sörgel, K. Staudt, I. Trebs, A. Tsokankunku, V. Wolff, Z. Zhu, 2010: Atmospheric transport and chemistry in forest ecosystems - Overview of the EGER-project. Agricultural and Forest Meteorology, to be submitted. Foster, R. C., F. Vianey, P. Drobinski, P. Carlotti, 2006: Near-surface coherent structures and the vertical momentum flux in a large-eddy simulation of the neutrally-stratified boundary
layer. Boundary-Layer Meteorology, 120, 229– 255. Gao, W., R. H. Shaw, K. T. PawU, 1989: Observation of organized structure in turbulent flow within and above a forest canopy. Boundary-Layer Meteorology, 47, 349–377. Gerstberger, P., T. Foken, K. Kalbitz, 2004: The Lehstenbach and Steinkreuz chatchments in NE Bavaria, Germany. Biogeochemistry of forested catchments in a changing environment: Ecological Studies, 172, Springer, Heidelberg, 15–41. Gill, A. E., 1982: Atmosphere-Ocean Dynamics. Academic Press. Guest, F. M., M. J. Reeder, C. J. Marks, D. J. Karoly, 2000: Inertia-gravity waves observed in the lower stratosphere over Macquarie Island. Journal of the Atmospheric Sciences, 57, 737– 752. Katul, G., G. Kuhn, J. Schieldge, C.-I. Hsieh, 1997: The ejection-sweep character of scalar fluxes in the unstable surface layer. Boundary-Layer Meteorology, 83, 1–26. Maitani, T., R. H. Shaw, 1990: Joint probability analysis of momentum and heat fluxes at a deciduous forest. Boundary-Layer Meteorology, 52, 283–300. Nappo, C. J., 2002: An introduction to atmospheric gravity waves. Vol. 85 of International Geophysics Series. Academic Press, San Diego. Paw U, K. T., Y. Brunet, S. Collineau, R. H. Shaw, T. Maitani, J. Qiu, L. Hipps, 1992: Evidence of turbulent coherent structures in and above agricultural plant canopies. Agricultural and Forest Meteorology, 61, 55–68. Raupach, M. R., A. S. Thom, 1981: Turbulence in and above plant canopies. Annual Review of Fluid Mechanics, 13, 97–129. Raupach, M. R., J. J. Finnigan, Y. Brunet, 1996: Coherent eddies and turbulence in vegetation canopies: the mixing-layer analogy. BoundaryLayer Meteorology, 78, 351–382. Serafimovich, A., P. Hoffmann, D. Peters, and V. Lehmann, 2005: Investigation of inertia-gravity waves in the upper troposphere / lower stratosphere over Northern Germany observed with collocated VHF/UHF radars, Atmospheric Chemistry and Physics, 5, 295–310. Serafimovich, A., C. Thomas, T. Foken, 2010: Vertical and horizontal transport of energy and matter by coherent motions in a tall spruce canopy. Boundary-Layer Meteorology, submitted.
Shaw, R. H., K. T. Paw U, W. Gao, 1989: Detection of temperature ramps and flow structures at a deciduous forest site. Agricultural and Forest Meteorology, 47, 123– 138. Smedman, A.-S., H. Bergström, U. Högström, 1995: Spectra, variances and length scales in a marine stable boundary layer dominated by a low level jet. Boundary-Layer Meteorology, 76, 211–232. Staudt, K., T. Foken, 2007: Documentation of reference data for the experimental areas of the Bayreuth Centre for Ecology and Environmental Research (BayCEER) at the Waldstein site. Arbeitsergebnisse, University of Bayreuth, Dep. Micrometeorology, Print, ISSN 1614-8916 35, 37.
Thomas, C., T. Foken, 2005: Detection of longterm coherent exchange over spruce forest using wavelet analysis. Theoretical and Applied Climatology, 80, 91–104. Thomas, C., T. Foken, 2007a: Flux contribution of coherent structures and its implications for the exchange of energy and matter in a tall spruce canopy. Boundary-Layer Meteorology, 123, 317–337. Thomas, C., T. Foken, 2007b: Organised motion in a tall spruce canopy: temporal scales, structure spacing and terrain effects. Boundary-Layer Meteorology, 122, 123–147. Thompson, R. O. R. Y., 1978: Observation of inertial waves in the stratosphere. Quarterly Journal of the Royal Meteeorological Society, 104, 691–698.