j2eeprof - a tool for testing multitier applications Pawei Ktaczewski and Jacek Wytr^bowicz Institute of Computer Science of Warsaw University of Technology
[email protected],
[email protected]
Abstract. Quality assurance of multitier application is still a challenge. Especially difficult is testing big, distributed applications written by several programmers, with the use of components from different sources. Due to multi threaded and distributed architecture, their ability to be observed and their profiling are extremely difficult. Jleeprof is a new tool developed for testing and profiling multitier applications that run in the J2EE environment. The tool is based on the paradigm of aspect insertion. The main goal of jleeprof is to help in fixing of integration errors and efficiency errors. This paper presents the concept of jleeprof and gives some insides of jleeprof development. On the beginning we give some introduction to the methods of software profiling, and a brief characteristic of existing profilers, i.e., JFluid, Iron Track Sql, Optimizelt Server Trace and JXInsight. Next we present the architecture of jleeprof, and we describe how it collects data, what protocols it uses, and what kind of analysis it supports. On the end we demonstrate how jleeprof works in practice. In conclusions we list the strong and weak points of this tool, which is still in a beta version. Jleeprof is planned to be offered as an open source for the programmer community.
1
Introduction
Softvi'are testing and software profiling are time consuming tasks, especially during development of multitier, distributed applications. Sometimes these tasks take more time than coding. They are crucial when the target application is safety or business critical. We mean by testing the process of defect discovery in a developed code. We mean by profiling the process of performance analysis of an application. Because Java Platform Enterprise Edition (J2EE) is a widely used programming platform for developing and running distributed multitier architecture applications, we have focused our attention on testing and profiling applications that run in the J2EE environment. The result is jleeprof [7] - a new tool to help in fixing of integration errors and efliiciency errors. Integration testing and profiling need very similar methods and tools. We shortly describe them. To make not frequent or exceptional conditions testable we have to extend the tested application to make controllable its execution flow. During an execution flow a programmer collects selected data for subsequent analysis. Selection of the data depends on programmer aim, it could be; remote function checking, bottleneck discovery, time consumption of selected functions and memory consumption. In general, there are two methods of data gathering: sampling and tracing oo. The advantage of sampling is that this method slightly influences the tested application in contradiction to the tracing Please use the following format when citing this chapter: Klaczewski, P., Wytr^bowicz, J., 2006, in IFIP International Federation for Information Processing, Volimie 227, Software Engineering Techniques; Design for Quality, ed. K. Sacha, (Boston: Springer), pp. 199-210.
200
Pawet Ktaczewski, Jacek Wytr^bowicz
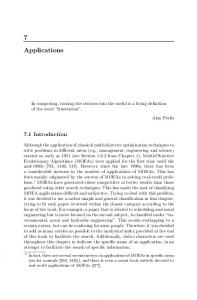
method. The advantage of tracing is the possibility to achieve very high accuracy but when accuracy is higher - the execution time is more and more disturbed. Extensions that make the execution flow controllable are included in the application code by a programmer. Sampling can be performed without any modification of the appKcation code. Tracing can be achieved by altering the code or by modification of its environment, or both. The Java Platform Debugger Architecture (JPDA), which is a collection of APIs to debug Java code, is a good example of a tool for envii-onment modification. A disadvantage of JPDA is the limited set of low-level events that the programmer can observe. The abstraction level of virtual Java machine is not suitable for J2EE application analysis. The programmer gets too much low level data, which are difficult to analyze. Altering of the application code can be done by hand, can be processed by a compiler (e.g., as for gprof Unix tool), or after compilation. There are Java libraries, e.g., BCEL^ ASM [3], which allow altering a Java bytecode during loading. The progranamer has to point where and how the automatic code altering should be performed. The amount of data collected during an application run is usually huge. Sometime some compression or aggregation methods have to be used for their collection. A programmer needs to have some tools for filtering the collected data and for their visualization in an interactive manner. G. Ammons, T. Ball and J. R. Laius [1] have proposed to build a structure called Calling Context Tree (CCT) - as an aggregation method. Every tree node keeps some measurements of an executed function. Any path in the tree represents a possible execution sequence of modules (the module can be a method, a component, a layer, or a node belonging to a distributed system). Figure 1 depicts an exemplary execution path of a function X that executes 6 modules (AB notation means that A module calls B module). A tree representation is more expressive. A—•B
B—*c B—*D D—*E (a)
l-D—]
(b)
Fig. 1. Execution path visualization a) sequential, b) context free It helps to find bottlenecks related to different load of data or user connections. There are more ways of execution path visualization as Fig 2 shows. Nowadays profilers generate a layered representation of full tree of execution calls (Fig 2b). The width of every rectangle may depict execution time of relating module. Complex applications give very big trees. To make them more readable reduced graphs can be generated (Fig. 2c, 2d). Most profilers allow for simple filtering of presented data with predefined set of views. However there are exceptions: a programmer using ejp^ can implement own filters. XDSE profiler [2] stores full execution trace in an XML database. Next a programmer can define filtering by XQuery language and select a visualization form. ' http://jakarta.apache.org/bcel ^ http;//ejp. sourceforge.net
jleeprof- a tool for testing multitier applications
201
M(A(BOCO)D(C())A(B()C())D(CO)A(BOB()C()C())) (a) M M
/
\
A
B
C
D
/ \ / B C A
(c)
\ C
(d)
M (e)
Fig. 2. Execution path visuaKzation a) layered representation, b) Ml tree of execution calls, c) reduced call graph, d) context call tree, e) trace graph Profiling of a distributed system is difficult. Every distinct element has to be observed independently. Next, a profiler has to correlate collected data before filtering and presentation. A correlation method based on independent clocks is not accurate and leads to interpretation errors. Much efficient is to include tracing into a communication mechanism used by separate instances. Authors of [8] describe a tool that traces TCP messages. For better efficiency, a profiler could use some marking of messages that concern the analyzed application/purpose. Pinpoint project [6] is based on modification of Jboss^ application server - in this way a distributed application, which works on Jboss servers, can be easily and efficiently traced. When a programmer uses CORBA, then we can take advantage of built in interceptor mechanism for message marking. The interceptor is a function written by the programmer and called during conmiunication. There are several cormnercial profilers addressed to J2EE environment, but we do not know any such a tool from public domain. Profilers created for Java programmers, not only for those who use J2EE, are more numerous. Let take a look on some of them - the most interesting in our opinion. JFluid profiler [5], from Sun Microsystems, works only with the NetBeans programmer framework. It provides some means for analysis of: memory consumption, execution time and execution flow. Programmer can point some Java methods for analysis. JFluid process the code statically to discover all methods, which could be executed by those selected. Next it alters them to make them traceable. It visualizes only the traces that belong to the execution context of selected methods. The altered code has constant time overhead, that allows subtracting it from measured values, and present more accurate data. Because JFluid co-works with extended (tuned for it) virtual Java machine it is a fast and efficient tool. Iron Track Sql^ is a free tool for performance monitoring of Java applications that interact with databases. It builds a log of every database query, its time and duration. It allows for some filtering, e.g., to register only these queries whose duration overcomes ' http://www.jboss.org * http://www.irongrid.com/catalog/product_info.php?products_id=32
202
Pawel Ktaczewski, Jacek Wytr^bowicz
a defined threshold. It is based on a database proxy, which makes all required logs. The programmer has to use the p6spy driver (an element of Iron Track Sql) in place of standard jdbc driver. Optimizelt Server Trace is a Borland profiler addressed to J2EE. It can gather data using probing or tracing. It can monitor memory consumption. With this tool the programmer can visualize execution paths as a context tree or as a full tree of execution calls. Optimizelt presents j2ee services trace using sets of abstract words. In example word "ejb load" stands for ejb load life cycle method. Tool hides application server internal implementation of ejb load and presents it to user in simplified form. Profiling statistics ai-e then more readable and free of unnecessary information. This feature makes Optimizelt much more effective tool for J2EE application tracing than standai-d profiler. Optimizelt can point hot spots, can display execution time of every layer, e.g.: JDBC 23,68%, JNDI 15.31%, servlets and jsp 57.84%, EJB 3,17%. It can even register and visualize RMI communication. JInspired company offers the JXInsight profiler. This tool is very similar to Optimizelt Server Trace. The difference is that JXInsight has more functions for monitoring of database queries. It can display correlations between distributed events using CORBA interceptors. Both Optimizelt and JXInsight are very complex and powerful tools, which allow multitier visualization of execution paths. There are many other profilers but most of them suit only development of standard Java programs running on a single machine. They are inefficient for development of J2EE applications, which are distributed and use a server code. Usually the programmer does not know the server code (it is a black box for him). And the server code is a significant part of the application. The only corrections and optimizations, the programmer can make, are inside his code. Hence only tools like Optimizelt and JXInsight can really help to profile J2EE appHcations.
2 j2eeprof insides Jleeprof is profiler designed for applications running in J2EE environment. J2EE provides variety of services. Programs work in a container i.e., servlet container or ejb container. Container provides services, can manage component life cycle and enhance program behavior. The way program uses services can be specified in code or configuration descriptor. When configuration is used it is impossible to inspect program behavior only by reading its code. This makes testing more difficult to the programmer. Another problem arises, when J2EE appHcation is profiled using standard Java profiler. There is huge amount of container implementation code execution registered together with program code. The performance impact is large and results contain plenty of superfluous information. In order to capture accurate view of executionflow,j'2eeprof uses tracing. Jleeprof comes with ability of selective program tracing. It registers J2EE services and program execution at high level of detail. By inspecting trace programmer can find out all the interactions of J2EE services with program. The tool has significant ability to shape profiling scope, Jleeprof addresses also distributed nature of ejb components. It is able
jleeprof - a tool for testing multitier applications
203
to track communication between remote ejb components and deliver distributed system trace, Jleeprof is designed for profiling applications that run in a distributed environment. Thus tool itself is distributed as well. There are three major modules oi jleeprof: data collection module, transport module and visualization module. The data collection is installed on distributed system nodes and acts as client in the client-server jleeprof architecture. Visualization module is responsible for trace analysis and visualizations. The data is transported from remote data collections modules to visualization module by transport module. 2.1
Data collection
Data collection module uses tracing method to collect profile data. Its implementation is based on the aspect oriented programming (AOP). Aspect is a program module that implements some common functionality and has no dependencies on other program modules. AOP consists of two elements: aspect weaver and composition language. Aspect weaver is responsible for composition of aspects and other modules into final application. Composition language controls the weaver. Jleeprof uses Aspectwerkz^, open source AOP library, as a basis for data collection module. Aspectwerkz weaver is capable of dynamic aspect insertion. This feature enables profiler to temporarily modify tested code and change profihng scope on every program execution. Aspectwerkz uses AspectJ^ composition language. The point of program code, where aspect can be inserted, is called join point. It can be i.e., a method or a construction invocation. Pointcut is AspectJ definition that pick out a set of join points. AspectJ gives jleeprof capability to define profiling scope with detail. Important feature in J2EE environment is that a join point can define interface and polymorphic execution. J2EE is specified by a set of interfaces. Jleeprof can profile application server standard services by tracing them at the interface level. This method provides the right level of abstraction. Tracing implementation details of application server not only has negative performance impact, but also has no value for the application developer, as he cannot modify server code. Still the appUcation code can be traced with much greater detail - up to every method call. Data collection module implements a set of aspects. Data collection aspect is responsible for registering information on program execution. AOP composition language allows mixing of aspects in order to register traces on different detail level. Data trace representation (see Fig. 3) in jleeprof consists of 4 elements. PathNode is a node of trace path. PathNode can contain other PathNode in the way it make call tree. PathNode is a base class for a concrete node, which may represent method execution or distributed call. Nodes belong to an execution thread, which is represented by ThreadNode. SystemNode is a node of distributed system. System abstracts whole observed system. The representation can describe nodes on different level of abstraction. There are 2 generic aspects that trace method executions: MainAspect that registers only method signatures and Parameters Aspect that registers also parameter values. An aspect collects information about several attributes: start and end time, information on ^ http://aspectwerkz.codehaus.org * http://www.eclipse.org/aspectj
Pawet Kiaczewski, Jacek Wytr^bowicz
204
System 1
0..*
SvstemNode id name
1
0..*
ThreadNode -name -group
Path Node 1
0..1
0..* 0..*
Fig. 3. Trace model exception, path node name (e.g. method signature) and execution thread. There is also one additional attribute - category that is specified in aspect definition, and it is used later for data analysis. 2.2 Data transport Gathered data are transmitted by transport module. The module consists of three parts: data sender, transport protocol and data receiver. Data transport module can write data to file or send over TCP/IP. The most important element is the protocol. Jleeprof uses binary protocol that is built in a way to keep network traffic low. We have executed several tests to measure j'2ee/7ro/ overhead. The results (Table 1) have shown that the most time consuming is I/O, The more data is sent the more impact on performance is made (see test 3 and 4 in Table 1). During execution of test 3 all gathered data been discarded, during execution of test 4 the same data have been written into a file. I/O slow down factor was about 6. Addition of a simple compression method resulted in better overall performance. J2eeprof uses dictionary compression for most frequently sent data - event labels. MainAspect sends approximately 30 bytes per start method event and 22 bytes per exit method event. Executions with tracing turned off (test 1) and with AspectWerkz (test 2) empty aspect have shown a difference of performance overhead. Encoding overhead (test 3) is 3,232.98 ns but 509.68 ns (test 2) is the effect of using AspectWerkz and cannot be avoided. Write to the file (test 4) slows down by 17,421.38 ns. Jleepwf performs almost twice better as Log4J^ (test 7). The maximum time was taken from jleepwf statistics. It indicates that writing into a file gives more stable efi'ects compared to sending over TCP/IP, however the second choice is much more convenient for a user. Tab. 1. Measured performance overhead no
test
1 2 3 4 5 6 7
no aspects NullAspect MainAspect MainAspect MainAspect MainAspect Log4J (file)
mean time[ns/per call]
(no I/O) (file) (tcp local) (tcp)
31.63 509.68 3,232.98 20,654.36 33,639.00 36,767.00 41,199.31
max time[ms/per call]
58 308 949
2.3 Distributed tracing Jleepwf can profile distributed J2EE systems. Execution path on each distinct node of analyzed system is recorded. But it is also required to match right local paths and http;//logging.apache.org/log4j
jleeprof - a tool for testing multitier applications
205
reconstruct distributed path. Tagging messages exchanged between nodes can do this. This method has top accuracy over others, and is not affected by time differences of the nodes. EJB protocol - RMI/IIOP supports sending additional information in protocol tier, without changing interface on an application tier (Fig. 4). Corba Interceptor documentation [4] describes this feature. J2eepwf tracing mechanism can be enabled in the configuration file of application server, with no need to modify program or server code. The method is protocol dependent; jleeprof comes with implementation for standard EJB protocol RMI/IIOP and Jboss RMI. But this solution is well suited for J2EE environment. J2EE specification requires application servers to provide transaction support and user authentication over remote calls. These services are defined in application configuration descriptors. Thus communication protocols must be able do support rpc-level communicates tagging. Jleeprof inject into EJB communication apart of transaction id and user information his own data. -H server
client
1
D A
application tier
protocol tier
'
D information passed by application A extra tracing information passed by protocol tier Fig. 4. Protocol tracing Distributed paths require trace model to be improved. Model is extended by addition of two new nodes (PathNode subclasses). RPCCallNode (RC) represents an rpc call on the client side. RPCReceiveNode (RR) represents an rpc call on the server side. Figure 5 depicts reconstruction of a distributed path. On rpc call event - jleeprof tags outgoing message with rpcid - auto generated id, unique in jvm scope, and node jc?(specifled in configuration file). On rpc receive event - rpcId tag and node id are added to RR event. Node id attribute is saved in RR.sourceNodeld field. Paths merging is performed by matching RC-RR pairs. Match criteria is: 1. RC.rpcId=RR.rpcId 2. RC is registered on system node defined in RR.sourceNodeld
^-T-B-T-C Lj)—C l-RC
i--RSrp-E—F 1 '
'-H-pF
A-pB-p-C L,D—C "-RC-RRT-E—F
-H^F (a)
(b)
Ki > O X
OS
a
riN
fc
^ ^
ro \r) f i
00 OS
•*
r»l l O
\n
r--
Pi
o
u-i
oo
1—1
in
^
(N
o
\D
r- r-~
on m ^ m
r~
w-i
in
5—4
o
oo i n Tf in
ON
in
^_(
m in
1-^
^ «)
IN U-i ND IN ON i n
m r~
T—