JCHARMING: A Bug Reproduction Approach using Crash Traces and Directed Model Checking Mathieu Nayrolles, Abdelwahab Hamou-Lhadj SBA Research Lab ECE, Concordia University Montréal, Canada
[email protected],
[email protected] Abstract—Due to their inherent complexity, software systems are pledged to be released with bugs. These bugs manifest themselves on client's computers, causing crashes and undesired behaviors. Field crashes, in particular, are challenging to understand and fix as the information provided by the impacted customers are often scarce and inaccurate. To address this issue, there is a need to find ways for automatically reproducing the crash in a lab environment in order to fully understand its root causes. Crash reproduction is also an important step towards developing adequate patches. In this paper, we propose a novel crash reproduction approach, called JCHARMING (Java CrasH Automatic Reproduction by directed Model checkING). JCHARMING uses crash traces and model checking to identify program statements needed to reproduce a crash. Our approach takes advantage of the completeness provided by model checking while ignoring unneeded system states by means of information found in crash traces combined with static slices. We show the effectiveness of JCHARMING by applying it to seven different open source programs cumulating more than one million lines of code scattered in around 7000 classes. Overall, JCHARMING was able to reproduce 85% of the submitted bugs. Keywords—Automatic Bug Reproduction, Dynamic Analysis, Model Checking, Software Maintenance.
I. INTRODUCTION Despite the efforts spent on testing and verification, there is no guarantee that the final releases of a software system are bugfree, resulting in crashes (field failures) and unwanted behavior of the system. Fixing bugs that cause field crashes is known to be an expensive task. Automated techniques that can help identify the cause of crashes in order to reproduce them can save costs and efforts.
Sofiène Tahar
Alf Larsson
ECE Department Concordia University Montréal, Canada
[email protected]
PLF System Management Ericsson, R & D Stockholm, Sweden
[email protected]
crash explanation [5], [6]. The first category relies on instrumenting the system in order to capture objects and other system components at run-time. When a faulty behavior occurs in the field, the stored objects as well as the entire heap are sent to the developers along with the faulty methods to reproduce the crash. These techniques tend to be simple to implement and yield good results, but they suffer from two main limitations. First, code instrumentation comes with a non-negligible overhead on the system. The second limitation is that the collected objects may contain sensitive information causing customer privacy issues. The second category is composed of tools leveraging proprietary data in order to provide hints on potential causes. While these techniques are efficient in improving our comprehension of the bugs, they are not designed with the purpose of reproducing them. In this paper, we propose an approach, called JCHARMING (Java CrasH Automatic Reproduction by directed Model checkING) that uses a combination of crash traces and model checking to automatically reproduce bugs that caused field failures. Unlike existing techniques, JCHARMING does not require instrumentation of the code. It does not need access to the content of the heap either. Instead, JCHARMING uses a list of functions output when an uncaught exception in Java occurs (i.e., the crash trace) to guide a model checking engine to uncover the statements that caused the crash.
Field failures are, however, challenging to reproduce because the data provided by the end users is often scarce. A survey conducted with developers of major open source software systems such as Apache, Mozilla and Eclipse revealed that one of the most valuable piece of information that can help locate and fix the cause of a crash is the one that can help reproduce it [1]. It is therefore important to invest in techniques and tools for automatic bug reproduction to ease the maintenance process and accelerate the rate of bug fixes and patches.
Model checking (also known as property checking) is a formal technique for automatically verifying a set of properties of finite-state systems [7]. More specifically, this technique builds a control flow graph where each node represents one state of the program and the set of properties that need to be verified in each state. For real-world programs, model checking is often computationally impracticable because of the state explosion problem [7]. To address this challenge and apply model checking on large programs, we direct the model checking engine towards the crash using program slicing and the content of the crash trace, and hence, reduce the search space. As we will show in the case study, this directed model checking approach is capable of achieving 85% accuracy when applied to reproducing bugs from seven different open source systems.
Existing techniques can be divided into two categories: (a) On-field record and in-house replay [2]–[4], and (b) In-house
The remainder of this paper is organized as follows: In Section II, we present related work on crash reproduction. In Section
c 2015 IEEE 978-1-4799-8469-5/15
101
SANER 2015, Montréal, Canada
c 2015 IEEE. Personal use of this material is permitted. Permission from IEEE must be obtained for all other uses, in any current or future media, including reprinting/ Accepted for publication by IEEE. republishing this material for advertising or promotional purposes, creating new collective works, for resale or redistribution to servers or lists, or reuse of any copyrighted component of this work in other works.
III, we provide some background information on model checking. JCHARMING is the topic of Section IV. Section V is dedicated to the case study, followed by threats to validity. We conclude the paper and sketch future directions in Section VII. II. RELATED WORK In his Ph.D thesis [8], Chen proposed an approach named STAR (Stack Trace based Automatic crash Reproduction). Using only the crash stack, STAR starts from the crash point and goes backward towards the entry point of the program. During the backward process, STAR computes the required condition to reach the crash point using an SMT (Satisfiability Modulo Theories) solver named Yices [9]. The objects that satisfy the required conditions are generated and orchestrated inside a JUnit test case [10]. The test is run and the resulting crash stack is compared to the original one. If both match, the bug is said to be reproduced. When applied to different systems, STAR achieved 60% accuracy. Jaygarl et al. [4] created OCAT (Object Capture based Automated Testing). The authors’ approach starts by capturing objects created by the program when it runs on-field in order to provide them in an automated test process. Indeed the coverage of automated tests is often low due to the lack of correctly constructed objects. Also, the objects can be mutated by means of evolutionary algorithms. These mutations target primitive fields in order to create even more objects and therefore improve the code coverage once more. While not targeting the reproduction of a bug, OCAT is a well-known approach and was used as the main mechanism for bug reproduction. Narayanasamy et al. [2] proposed BugNet, a tool that continuously records program execution for deterministic replay debugging. According to the authors, the size of the recorded data needed to reproduce a bug with high accuracy is around 10MB. This recording is then sent to the developers and allows the deterministic replay of a bug. The authors argued that, with nowadays Internet bandwidth, the size of the recording is not an issue during the transmission of the recorded data, however, the instrumentation of the system is problematic since it slows down considerably the execution. Jin et al. [11] proposed BugRedux for reproducing field failures for in-house debugging. The tool aims to synthesize in-house executions that mimic field failures. To do so, the authors use several types of data collected in the field such as stack traces, crash stacks, and points of failure. The data that successfully reproduced the field crash is sent to software developers to fix the bug. Based on the success of BugRedux, the authors built F3 (Fault localization for Field Failures) [12]. F3 performs many executions of a program on top of BugRedux in order to cover different paths leading to the fault. It then generates many ‘pass’ and ‘fail’ paths which can lead to a better understanding of the bug. They also use grouping, profiling and filtering, to improve the fault localization process.
While being close to our approach, BugRedux and F3 may require the call sequence and/or the complete execution trace in order to achieve bug reproduction. When using only the crash traces (referred to as call stack at crash time in their paper), the success rate of BugRedux significantly drops to 37.5% (6/16). The call sequence and the complete execution trace required to reach 100% of bug reproduction can only be obtained through instrumentation and with an overhead ranging from 1% to 1066%. Clause et al. [13] proposed a technique for enabling and supporting debugging of field failures. They record the execution of the program on the client side and propose to compress the generated data to the minimal required size to ensure that the reproduction is feasible. This compression is also performed on the client side. Moreover, the authors keep traces of all accessed documents in the operating system and also compress/reduce them to the minimal. Overall, they are able to reproduce on-field bug using a file weighting ≈70Kb. The minimal execution paths triggering the failure are then sent to the developers who can replay the execution on a sandbox, simulating the client’s environment. While efficient, this approach suffers from severe security and privacy issues. RECORE (REconstructing CORE dumps) is a tool proposed by Rößler et al. [14]. It instruments Java bytecode to wrap every method in a try and catch block while keeping a quasinull overhead. The tool starts from the core dump and tries (with evolutionary algorithms) to reproduce the same dump by executing the programs many times. The set of inputs responsible for the failure is generated when the generated dump matches the collected one. ReCrash [3] is a tool that aims to make software failures reproducible by preserving object states. It uses an in-memory stack, which contains every argument and object clone of the real execution in order to reproduce a crash via the automatic generation of unit test cases. Unit test cases are used to provide hints to the developers on the buggy code. This approach suffers from overhead when they record everything (between 13% to 64% in some cases). The authors also propose an alternative in which they record only the methods surrounding the crash. For this to work, the crash has to occur at least once so they could use the information causing the crash to identify the methods surrounding it when (and if) it appears. JRapture [15] is a capture/replay tool for observation-based testing. The tool captures execution of Java programs to replay it in-house. To capture the execution of a Java program, the authors used their own version of the Java Virtual Machine (JVM) and employ a lightweight, transparent capture process. Using their own JVM allows one to capture any interactions between a Java program and the system, including GUI, file, and console inputs, and on replay, it presents each thread with exactly the same input sequence it saw during capture. Unfortunately, they have to make their customer use their own JVM in order to support their approach, which limits the generalization of the approach to mass-market software.
102
Finally, Zamfir et al. [16] proposed ESD, an execution synthesis approach which automatically synthesizes failure execution using only the stack trace information. However, this stack trace is extracted from the core dump and may not always contain the components that caused the crash. Except for STAR, approaches targeting the reproduction of field crashes require the instrumentation of the code or the running platform in order to save the stack call or the objects to successfully reproduce bugs. As we discussed earlier, instrumentation can cause a massive overhead (1% to 1066%) while running the system. In addition, data generated at runtime using instrumentation may contain sensitive information. The approach proposed in this paper takes a different path by avoiding the instrumentation of the code and only uses stack traces resulting from an exception. While we do not filter any personal information that may appear in the crash trace, JCHARMING still raises less privacy concerns than a tool recording every call. III.
Fig 1a. Testing view
PRELIMINARIES
Model checking (also known as property checking) will, given a system (that could be software [17] or hardware based [18]), check if the system meets a specification Spec by testing exhaustively all the states of the system under test (SUT), which can be represented by a Kripke [19] structure:
Fig 1b. Model Checking view
𝑆𝑈𝑇 = < 𝑆, 𝑇, 𝑃 > where S is the set of states, T ⊆ S × S represents the transitions between the states and P is the set of properties that each state satisfies. The SUT is said to satisfy a set of properties p when there exists a sequence of states transition x leading towards these properties. This can be written as:
Fig 1c. Directed model Checking view
(𝑆𝑈𝑇, 𝑥) ⊨ 𝑝 However, this only ensures that ∃𝑥 such that 𝑝 is reached at some point in the execution of the program and not that 𝑝 holds nor that ∀𝑥 , 𝑝 is satisfiable. In this paper, SUTs are bound to a simple specification: they must not crash under a fair environment. In the framework of this study, we consider a fair environment as any environment where the transitions between the states represent the functionalities offered by the program. For example, in a fair environment, the program heap or other memory spaces cannot be modified. Without this fairness constraint, all programs could be tagged as buggy since we could, for example, destroy objects in memory while the program continues its execution. As we are interested in verifying the absence of unhandled exceptions in the SUT, we aim to verify that for all possible combinations of states and transitions there is no path leading towards a crash 𝑐. That is: ∀𝑥. (𝑆𝑈𝑇, 𝑥) ⊨ ¬𝑐 If such a path exists (i.e., ∃x such that (SUT, x) ⊨ c) then the model checker engine will output the path x (known as the counter-example) which can then be executed. The resulting Java exception crash trace is compared with the original crash trace to assess if the bug is reproduced. While being accurate
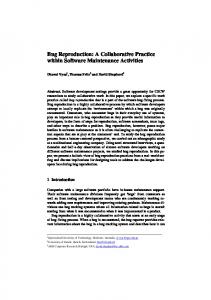
Fig1. From top to bottom, a toy-program composed of two loops, under testing, model checking and directed model checking. The dotted lines represent removed states for the sake of clarity
and exhaustive in finding counter-examples, model checking suffers from the state explosion problem, which hinders its applicability to large software systems. To show the contrast between testing and model checking, we use the hypothetical example of Figure 1 to sketch the possible results of each approach. This figure depicts a toy program where from the entry point, unknown calls are made (dotted points) and, at some points, two methods are called. These methods, called Foo.Bar and Bar.Foo, implement a for loop from 0 to loopCount. The only difference between these two methods is that the Bar.Foo method throws an exception if i becomes larger than two. Hereafter, we denote this property as 𝑐𝑖>2 . Figure 1a shows the program statements that could be covered using testing approaches. Testing software is a demanding task where a set of techniques is used to test the SUT according to some input.
103
Fig 2. Overview of JCHARMING
Software testing depends on how well the tester understands the SUT in order to write relevant test cases that are likely to find errors in the program. Program testing is usually insufficient because it is not exhaustive. In our case, using testing would mean that the tester knows what to look for in order to detect the causes of the failure. We do not assume this knowledge in this paper. Model checking, on the other hand, explores each and every state of the program (Figure 1b), which makes it complete, but impractical for real-world and large systems. To overcome the state explosion problem of model checking, directed (or guided) model checking has been introduced [21]. Directed model checking use insights—generally heuristics—about the SUT in order to reduce the number of states that need to be examined. Figure 1c explores only the states that may lead to a specific location, in our case, the location of the fault. The challenge, however, is to design techniques that can guide the model checking engine. As we will describe in the next section, we use crash traces and program slicing to overcome this challenge. IV.
THE JCHARMING APPROACH
Figure 2 shows an overview of JCHARMING. The first step consists of collecting crash traces, which contain raw lines displayed to the standard output when an uncaught exception in Java occurs. In the second step, the crash traces are preprocessed by removing noise (mainly calls to Java standard library methods). The next step is to apply backward slicing using static analysis to expand the information contained in the crash trace while reducing the search space. The resulting slice along with the crash trace are given as input to the model checking engine. The model checker executes statements along the paths from the main function to the first line of the crash trace (i.e., the last method executed at crash time, also called the crash location point). Once the model checker finds inconsistencies in the program leading to a crash, we take the crash stack generated by the model checker and compare it to the original crash trace (after preprocessing). The last step is to build a JUnit test, to be used by software engineers to reproduce the bug in a deterministic way.
included in crash reports and can therefore be automatically retrieved using a simple regular expression. Figure 3 shows an example of a crash trace that contains the exception thrown when executing the program depicted in Figure 1. The crash trace contains a call to the Bar.foo() method—the crash location point—and calls to Java standard library functions (in this case, GUI methods because the program was launched using a GUI). 1.javax.activity.InvalidActivityException:loopTimes should be < 3 2. at Foo.bar(Foo.java:10) 3. at GUI.buttonActionPerformed(GUI.java:88) 4. at GUI.access$0(GUI.java:85) 5. at GUI$1.actionPerformed(GUI.java:57) 6. caused by java.lang.IndexOutOfBoundsException : 3 7. at scam.Foo.buggy(Foo.java:17) 8. and 4 more … Fig. 3. Java InvalidActivityException exception is thrown in the Bar.Foo loop if the control variable is greater than 2.
As shown in Figure 3, we can see that the first line (referred to as frame f0, subsequently the next line is called frame f1, etc.) does not represent the real crash point but it is only the last exception of a chain of exceptions. Indeed, the InvalidActivity has been triggered by an IndexOutOfBoundsException in scam.Foo.buggy. This kind of crash traces reflects several nested try/catch blocks. In addition, it is common in Java to have incomplete crash traces. According to the Java documentation [22], line 8 of Figure 3 should be interpreted as follows: “This line indicates that the remainder of the stack trace for this exception matches the indicated number of frames from the bottom of the stack trace of the exception that was caused by this exception (the "enclosing" exception). This shorthand can greatly reduce the length of the output in the common case where a wrapped exception is thrown from the same method as the "causative exception" is caught.” We are likely to find shortened traces in bug repositories as they are what the user sees without any possibility to expand their content.
A. Collecting Crash Traces
B. Preprocessing
The first step of JCHARMING is to collect the crash trace caused by an uncaught exception. Crash traces are usually
In the preprocessing step, we first reconstruct and reorganize the crash trace in order to address the problem of nested exceptions. Then, with the aim to obtain an optimal guidance
104
for our directed model checking engine, we remove frames that are out of our control. Frames out of our controls refer usually, but are not limited to, Java library methods and third party libraries. In Figure 3, we can see that Java GUI and event management components appear in the crash trace. We assume that these methods are not the cause of the crash; otherwise it means that there is something wrong with the onfield JDK. If this is the case, we will not be able to reproduce the crash. Note that removing these unneeded frames will also reduce the search space of the model checker. C. Building the Backward Static Slice For large systems, a crash trace does not necessary contain all the methods that have been executed starting from the entry point of the program (i.e., the main function) to the crash location point. We need to complete the content of the crash trace by identifying all the statements that have been executed starting from the main function until the last line of the preprocessed crash trace. In Figure 3, this will be the function call Bar.foo(), which happens to be also the crash location point. To achieve this, we turn to static analysis by extracting a backward slice from the main function of the program to the Bar.foo() method. A backward slice contains all possible branches that may lead to a point 𝑛 from a point 𝑚 as well as the definition of the variables that control these branches [23]. In other words, the slice of a program point 𝑛 is the program subset that may influence the reachability of point 𝑛 starting from point 𝑚 . The backward slice containing the branches and the definition of the variables leading to 𝑛 from 𝑚 is noted as 𝑏𝑠𝑙𝑖𝑐𝑒[𝑚 ←𝑛] . We perform a static backward slice between each frame to compensate for possible missing information in the crash trace. More formally, the final static backward slice is represented as follows: 𝑏𝑠𝑙𝑖𝑐𝑒[𝑒𝑛𝑡𝑟𝑦 ←𝑓0] = 𝑏𝑠𝑙𝑖𝑐𝑒[𝑓1 ←𝑓0] ∪ 𝑏𝑠𝑙𝑖𝑐𝑒[𝑓2 ←𝑓1] ∪ … ∪ 𝑏𝑠𝑙𝑖𝑐𝑒[𝑓𝑛 ←𝑓𝑛−1] ∪ 𝑏𝑠𝑙𝑖𝑐𝑒[𝑒𝑛𝑡𝑟𝑦 ←𝑓𝑛] Note that the union of the slices computed between each pair of frames must be a subset of the final slice between 𝑓0 and the 𝑒𝑛𝑡𝑟𝑦 point of the program. More formally: 𝑒𝑛𝑡𝑟𝑦
⋃ 𝑏𝑠𝑙𝑖𝑐𝑒[𝑓𝑖+1 ←𝑓𝑖] ⊆ 𝑏𝑠𝑙𝑖𝑐𝑒[𝑒𝑛𝑡𝑟𝑦 ←𝑓0] 𝑖=0
Indeed, in Figure 4, the set of states allowing to reach 𝑓0 from 𝑓2 is greater than the set of states to reach 𝑓1 from 𝑓2 plus set of states to reach 𝑓0 from 𝑓1 . In this hypothetical example and assuming that 𝑧2 is a prerequisite to 𝑓2 then 𝑏𝑠𝑙𝑖𝑐𝑒[𝑒𝑛𝑡𝑟𝑦 ←𝑓0] = {𝑓0 , 𝑓1 , 𝑓2 , 𝑧0 , 𝑧1 , 𝑧2 , 𝑧3 } while 𝑛 𝑏𝑠𝑙𝑖𝑐𝑒 = {𝑓 , 𝑓 , 𝑓 , 𝑧 }. ⋃𝑖=0 [𝑓𝑖+1 ←𝑓𝑖] 0 1 2 2 In the worst case scenerio where there exists one and only one transition between each frame, which is very unlikely for real and complex systems, then 𝑏𝑠𝑙𝑖𝑐𝑒[𝑒𝑛𝑡𝑟𝑦 ←𝑓0] and ⋃𝑛𝑖=0 𝑏𝑠𝑙𝑖𝑐𝑒[𝑓𝑖+1 ←𝑓𝑖] yield the same set of states with a
comparable computational cost since the number of branches to explore will be the same in both cases. The algorithm presented in Figure 5 is a high level representation of how we compute the backward slice between each frame. The algorithm takes as input the pre-processed call trace, the byte code of the SUT, and the entry point. From line 1 to line 5, we initialize the different variables used by the algorithm. The main loop of the algorithm begins at line 6 and ends at line 15. In this loop, we compute the static slice between the current frame and the next one. If the computed static slice is not empty then we update the final backward slice with the newly computed slice.
Fig 4. Hypothetical example representing 𝒃𝒔𝒍𝒊𝒄𝒆[𝒆𝒏𝒕𝒓𝒚 ←𝒇𝟎] Vs. ⋃𝒏𝒊=𝟎 𝒃𝒔𝒍𝒊𝒄𝒆[𝒇𝒊+𝟏 ←𝒇𝒊] .
If the computed slice is empty, it means that the frame 𝑖 + 1 was corrupted then we try with the frame 𝑖 + 2, and so forth. At the end of the algorithm, we compute the slice between the last frame and the entry point of the program, and update the final slice. In the rare cases where the final slice is empty (this may happen in situations where the content of the crash trace is seriously corrupted) then JCHARMING would simply proceed with non-directed model checking. In order to compute the backward slice, we implement the algorithm in Figure 5 as an add-on to the T. J. Watson Libraries for Analysis (WALA) [24] which provides static analysis capabilities for Java Bytecode and JavaScript. This tool was part of a research project at IBM and donated to the community in 2006. WALA offers a very comprehensive API to perform static backward slicing on Java Bytecode from a specific point to another. At first sight, it may appear that static slicing alone can be used to reproduce the bug since it contains all the functions that lead to the first user-defined method of the crash trace. The problem is that a static slice may also contain many other parts of the program that are not relevant to the failure. A quick solution to this is to prune out the content of the resulting static slice by eliminating the unwanted statements. This can be achieved by defining specific inputs. The result will be a dynamic slice. This assumes that we know in advance which input we need to provide to the program in order to reach the crash, which defeats the purpose of bug reproduction in the first place.
105
In order to direct JPF, we have to modify the ‘generate states’ and the ‘forward’ steps. The generate states is populated with 𝑒𝑛𝑡𝑟𝑦 the states in ⋃𝑖 𝑏𝑠𝑙𝑖𝑐𝑒[𝑓𝑖+1 ←𝑓𝑖] ⊂ 𝑆𝑈𝑇 and we adjust the forward step to explore a state if the target state 𝑠𝑖+1 and the transition 𝑥 to pass from the current state 𝑠𝑖 to 𝑠𝑖+1 are in 𝑒𝑛𝑡𝑟𝑦 𝑏𝑠𝑙𝑖𝑐𝑒[𝑓𝑖+1 ←𝑓𝑖] ⊂ 𝑆𝑈𝑇 and ⋃𝑖 𝑒𝑛𝑡𝑟𝑦 𝑥. ⋃𝑖 𝑏𝑠𝑙𝑖𝑐𝑒[𝑓𝑖+1 ←𝑓𝑖] ⊂ 𝑥. 𝑆𝑈𝑇, respectively. E. Validation
Fig. 5 High level algorithm computing the union of the slices
Using backward slicing, the search space of the model checker that processes the example of Figure 1 is given by the following expression: 𝑒𝑛𝑡𝑟𝑦
⋃ 𝑏𝑠𝑙𝑖𝑐𝑒[𝑓𝑖+1 ←𝑓𝑖] ⊂ 𝑆𝑈𝑇, 𝑖 𝑒𝑛𝑡𝑟𝑦
∃𝑥. (
𝑥. ⋃ 𝑏𝑠𝑙𝑖𝑐𝑒[𝑓𝑖+1 ←𝑓𝑖] ⊂ 𝑥. 𝑆𝑈𝑇 𝑖
⊨ 𝑐𝑖>2 )
That is, there exists a sequence of states transitions 𝑥 that satisfies 𝑐𝑖>2 where both the transitions and the states are 𝑒𝑛𝑡𝑟𝑦 elements of ⋃𝑖 𝑏𝑠𝑙𝑖𝑐𝑒[𝑓𝑖+1 ←𝑓𝑖] . Obviously, 𝑐𝑖>2 also needs to be included for the final static slice to be usable by the model checking engine. Consequently, the only frame that need to be untouched for the backward static slice to be meaningful is 𝑓0 . D. Directed Model Checking The model checking engine we use in this paper is called JPF (Java PathFinder) [17], which is an extensible JVM for Java bytecode verification. This tool was first created as a front-end for the SPIN model checker [20] in 1999 before being opensourced in 2005. JPF is organized around five simple operations: (i) generate states, (ii) forward, (iii) backtrack, (iv) restore state and (v) check. In the forward operation, the model checking engine generates the next state 𝑠𝑡+1 . If 𝑠𝑡+1 has successors then it is saved in a backtrack table to be restored later. The backtrack operation consists of restoring the last state in the backtrack table. The restore operation allows restoring any state and can be used to restore the entire program as it was the last time we choose between two branches. After each, forward, backtrack and restore state operation the check properties operation is triggered.
To validate the result of directed model checking, we modify the ‘check properties’ step that checks if the current sequence of states transitions 𝑥 satisfies a set a property. If the current states transitions 𝑥 can throw an exception, we execute 𝑥 and compare the exception thrown to the original crash trace (after preprocessing). If the two exceptions match, we conclude that the conditions needed to trigger the failure have been met and the bug is reproduced. However, as argued by Kim et al. in [26], the same failure can be reached from different paths of the program. Although the states executed to reach the defect are not exactly the same, they might be useful to enhance the understanding of the bug by software developers, and speed up the deployment of a fix. Therefore, in this paper, we consider a defect to be partially reproduced if the crash trace generated from the model checker matches the original crash trace by a factor of t, where t is a threshold specified by the user. t is the percentage of identical frames between both crash traces. F. Generating Test Cases for Bug Reproduction To help software developers reproduce the crash in a lab environment we automatically produce the JUnit test cases necessary to run the SUT to cause the exercise of the bug. To build a test suite that reproduces a defect, we need to create a set of objects used as arguments for the methods that will enable us to travel from the entry point of the program to the defect location. JPF has the ability to keep track of what happens during model checking in the form of traces containing the visited states and the value of the variables. We leverage this capability to create the required objects and call the methods leading to the failure location. Although we can track back the internal state of objects at a specific time using JPF, it can be too computationally taxing to recreate only the objects needed to generate the bug. To overcome this, we use serialization techniques [27]. We take advantage of features offered by the XStream [28] library which enables the serialization and deserialization of any Java object — even objects that do not implement the Java Serializable interface. We use the serialization when the model checker engine performs too many operations modifying the property of a given object. In such case, we serialize the last state of the object.
106
V. CASE STUDIES
TABLE I. LIST OF TARGET SYSTEMS IN TERMS OF KILO LINE OF CODE (KLOC), NUMBER OF CLASSES (NOC) AND BUG #ID.
In this section, we show the effectiveness of JCHARMING to reproduce bugs in seven open source systems1. The aim of the case study is to answer the following question: Can we use crash traces and directed model checking to reproduce onfield bugs in a reasonable amount of time?
SUT
KLOC
NoC
Bug #ID
Ant
265
1233
38622, 41422
ArgoUML
58
1922
2603, 2558, 311, 1786
A. Targeted Systems Table I shows the systems and their characteristics in terms of Kilo Line of Code (KLoC) and Number of Classes (NoC).
dnsjava
33
182
38
jfreechart
310
990
434, 664, 916
Log4j
70
363
Apache Ant [29] is a popular command-line tool to build make files. While it is mainly known for Java applications, Apache Ant also allows building C and C++ applications. We choose to analyze Apache Ant because it has been used by other researchers in similar studies.
11570, 40212, 41186, 45335, 46271, 47912, 47957
MCT
203
1267
440ed48
pdfbox
201
957
1412, 1359
ArgoUML [30] is one of the major players in the open source UML modeling tools. It has many years of bug management and, similar to Apache Ant, it has been extensively used as a test subject in many studies. Dnsjava [31] is a tool for the implementation of the DNS mechanisms in Java. This tool can be used for queries, zone transfers, and dynamic updates. It is not as large as the other two, but it still makes an interesting case subject because it has been well maintained for the past decade. Also, this tool is used in many other popular tools such as Aspirin, Muffin and Scarab. JfreeChart [32] is a well-known library that enables the creation of professional charts. Similar to dnsjava, it has been maintained over a very long period of time —JfreeChart was created in 2005— and it is a relatively large application. Apache Log4j [33] is a logging library for Java. This is not a very large library, but it is extensively used by thousands of programs. As other Apache projects, this tool is well maintained by a strong open source community and allows developers to submit bugs. The bugs which are in the bug report system of Log4j are, generally speaking, well documented and almost every bug contains a related crash trace and, therefore, it is a tool of interest to us.
B. Bug Selection and Crash Traces In this paper, we have selected the reproduced bugs randomly in order to avoid the introduction of any bias. We selected a random number of bugs ranging from 1 to 10 for each SUT containing the word “exception” and where the description of the bug contains a match to the following regular expression: ^.+Exception[^\n]++(\s+at .++)+. This regular expression is designed to find the pattern of a Java exception. C. Results Table II shows the results of JCHARMING in terms of Bug #ID, reproduction status, and execution time (in minutes) of directed model checking (DMC) and Model Checking (MC). The experiments have been conducted on a Linux machine (8 GB of RAM and using Java 1.7.0_51). The result is noted as “Yes” if the bug has been fully reproduced, meaning that the crash trace generated by the model checker is identical to the crash trace collected during the failure of the system. The result is “Partial” if the similarity between the crash trace generated by the model checker and the original crash trace is above t=80%. Given an 80% similarity threshold, we consider partial reproduction as successful. A different threshold could be used. Finally, the result of the approach is reported as “No” if either the similarity is below t < 80% or the model checker failed to crash the system given the input we provided.
MCT [34] stands for Mission Control technologies and was developed by the NASA Ames Research Center (the creators of JPF) for use in spaceflight mission operation. This tool benefits from two years of history and targets a very critical domain, Spacial Mission Control. Therefore, this tool has to be particularly and carefully tested and, consequently, the remaining bugs should be hard to discover and reproduce. PDFBox [35] is another tool supported by the Apache Software Foundation since 2009 and was created in 2008. PDFBox allows the creation of new PDF documents and the manipulation of existing documents. 1
The bug reports used in this study and the result of the model checker are made available for download from research.mathieunayrolles.com/jcharming/
As we can see in Table II, we were able to reproduce 17 bugs out of 20 bugs either completely or partially (85% success ratio). The average time to reproduce a bug is 16 minutes. This result demonstrates the effectiveness of our approach, more particularly, the use of backward slicing to create a manageable search space that guides adequately the model checking engine. We also believe that our approach is usable in practice since it is also time efficient.
107
TABLE II. EFFECTIVENESS OF JCHARMING USING DIRECTED MODEL CHECKING (DMC) AND MODEL CHECKING (MC) IN MINUTES. (–) MEANS
Among the 20 different bugs we have tested, we will describe one bug (chosen randomly) for each category (successfully reproduced, partially reproduced, and not reproduced) for further analysis.
THAT THE EXECUTION WAS STOPPED BECAUSE IT WAS TAKING TOO LONG WITHOUT APPARENT RESULT.
SUT
1) Successfully reproduced The first bug we describe in this discussion is the bug #311 belonging to ArgoUML. This bug was submitted in an earlier version of ArgoUML. This bug is very simple to manually reproduce thanks to the extensive description provided by the reporter, which reads:
Ant
ArgoUML
Bug #ID
Reprod.
Time DMC
Time MC
38622
Yes
25.4
-
41422
No
-
-
2558
Partial
10.6
-
2603
Partial
9.4
-
311
Yes
11.3
-
1786
Partial
9.9
-
38
Yes
4
23
434
Yes
27.3
-
664
Partial
31.2
-
916
Yes
26.4
-
The reporter also attached the following crash trace that we used as input for JCHARMING:
11570
Yes
12.1
-
40212
Yes
15.8
-
1. java.lang.NullPointerException: 2. at 3. uci.uml.ui.props.PropPanelAttribute .setTargetInternal (PropPanelAttribute.java) 4. at uci.uml.ui.props.PropPanel. setTarget(PropPanel.java) 5. at uci.uml.ui.TabProps.setTarget(TabProps.java) 6. at uci.uml.ui.DetailsPane.setTarget (DetailsPane.java) 7. at uci.uml.ui.ProjectBrowser.select (ProjectBrowser.java) 8. at uci.uml.ui.NavigatorPane.mySingleClick (NavigatorPane.java) 9. at uci.uml.ui.NavigatorPane$Navigator MouseListener.mouse Clicked(NavigatorPane.java) 10.at java.awt.AWTEventMulticaster.mouseClicked (AWTEventMulticaster.java:211) 11. at java.awt.AWTEventMulticaster.mouseClicked (AWTEvent Multicast er.java:210) 12.at java.awt.Component.processMouseEvent (Component.java:3168) […] 19. java.awt.LightweightDispatcher .retargetMouseEvent (Container.java:2068) 22. at java.awt.Container .dispatchEventImp l(Container.java:1046) 23. at java.awt.Window .dispatchEventImpl (Window.java:749) 24. at java.awt.Component .dispatchEvent (Component.java:2312) 25. at java.awt.EventQueue .dispatchEvent (EventQueue.java:301) 28. at java.awt.EventDispatchThread.pumpEvents (EventDispatch Thread.java:90)
41186
Partial
16.7
-
45335
No
-
-
46271
Yes
13.9
-
47912
Yes
12.3
-
47957
No
-
-
440ed48
Yes
18.6
-
1412
Partial
19.7
-
1359
No
-
-
“I open my first project (Untitled Model by default). I choose to draw a Class Diagram. I add a class to the diagram. The class name appears in the left browser panel. I can select the class by clicking on its name. I add an instance variable to the class. The attribute name appears in the left browser panel. I can't select the attribute by clicking on its name. Exception occurred during event dispatching:”
29. at java.awt.EventDispatchThread.run(EventDispatch Thread.java:82) )
The cause of this bug is that the reference to the attribute of the class was lost after being displayed on the left panel of ArgoUML and therefore, selecting it through a mouse click throws a null pointer exception. In the subsequent version, ArgoUML developers added a TargetManager to keep the reference of such object in the program.
Dns java jFreeChart
Log4j
MCT PDFBox
Using the crash trace, JCHARMING's preprocessing step removed the lines between lines 11 and 29 because they belong to the Java standard library and we do not want neither the static slice nor the model checking engine to verify the Java standard library but only the SUT. Then, the third step performs the static analysis following the process described in Section IV.C. The fourth step performs the model checking on the static slice to produce the same crash trace. More specifically, the model checker identifies that the method setTargetInternal(Object o) could receive a null object that will result in a Null pointer exception. 2) Partially reproduced As an example of a partially reproduced bug, we explore the bug #664 of the Jfreechart program. The description provided by the reporter is: “In ChartPanel.mouseMoved there's a line of code which creates a new ChartMouseEvent using as first parameter the object returned by getChart(). For getChart() is legal to return null if the chart is null, but ChartMouseEvent's constructor calls the parent constructor which throws an IllegalArgumentException if the object passed in is null.” The reporter provided the crash trace containing 42 lines and the replaced an unknown number of lines by the following statement “”. While JCHARMING
108
successfully reproduced a crash yielding almost the same trace as the original trace, the “” statement — which was surrounded by calls to the standard java library — was not suppressed and stayed in the crash trace. That is, JCHARMING produced only the 6 (out of 7) first lines and reached 83% similarity, and thus a partial reproduction. 1. java.lang.IllegalArgumentException: null source 2. at java.util.EventObject.( EventObject.java:38) 3. at 4 org.jfree.chart.ChartMouseEvent. (ChartMouseEvent.java:83) 5. at org.jfree.chart.ChartPanel .mouseMoved(ChartPanel.java:1692) 6.
In all bugs that were partially reproduced, we found that the differences between the crash trace generated from the model checker and the original crash trace (after preprocessing) consists of few lines only. 3) Not Reproduced To conclude the discussion on the case study, we present a case where JCHARMING was unable to reproduce the failure. For the bug #47957 belonging to Log4j and reported in late 2009 the reporter wrote: “Configure SyslogAppender with a Layout class that does not exist; it throws a NullPointerException. Following is the exception trace:” and attached the following crash trace: 1. 10052009 01:36:46 ERROR [Default: 1] struts.CPExceptionHandler.execute RID[(null;25KbxlK0voima4h00ZLBQFC;236Al8E60000045C3A 7D74272C4B4A61)] 2. Wrapping Exception in ModuleException 3. java.lang.NullPointerException 4. at org.apache.log4j.net.SyslogAppender .append(SyslogAppender.java:250) 5. at org.apache.log4j.AppenderSkeleton .doAppend(AppenderSkeleton.java:230) 6. at org.apache.log4j.helper.AppenderAttachableImpl .appendLoopOnAppenders(AppenderAttachableImpl .java:65) 7. at org.apache.log4j.Category.callAppenders (Category.java:203) 8. at org.apache.log4j.Category .forcedLog(Category.java:388) 9. at org.apache.log4j.Category.info (Category.java:663)
The first three lines are not produced by the standard execution of the SUT but by an ExceptionHandler belonging to Struts [38]. Struts is an open source MVC (Model View Controller) framework for building Java Web Application. JCHARMING examined the source code of Log4J for the crash location struts.CPExceptionHandle r.execute and did not find it since this method belongs to the source base of Struts — which uses log4j as a logging mechanism. As a result, the backward slice was not produced, and we failed to perform the next steps. It is noteworthy that the bug is marked as duplicate of the bug #46271 which contains a proper crash trace. We believe that JCHARMING could have successfully reproduced the crash, if it was applied to the original bug.
VI. THREATS TO VALIDITY The selection of SUTs is one of the common threats to validity for approaches aiming to improve the understanding of program's behavior. It is possible that the selected programs share common properties that we are not aware of and therefore, invalidate our results. However, the SUTs analyzed by JCHARMING are the same as the ones used in similar studies. Moreover, the SUTs vary in terms of purpose, size and history. Another threat to validity lies in the way we have selected the bugs used in this study. We selected the bugs randomly to avoid any bias. One may argue that a better approach would be to select bugs based on complexity or other criteria (severity, etc.). We believe that a complex bug (if complexity can at all be measured) may perhaps have an impact on the running time of the approach, but we are not convinced that the accuracy of our approach depends on the complexity or the type of bugs we use. Instead, it depends on the quality of the produced crash trace. In addition, we see a threat to validity that stems from the fact that we only used open source systems. The results may not be generalizable to industrial systems. The last author of the paper expressed an interest to apply these techniques to Ericsson systems. We intend to undertake these studies in future work. Field failures can also occur due to the running environment on which the program is executed. For instance, the failure may have been caused by the reception of a network packet or the opening of a given file located on the hard drive of the users. The resulting failures will hardly be reproducible by JCHARMING. Finally, the programs we used in this study are all based on the Java programming language and JCHARMING leverages the crash traces produced by the JVM to reproduce bugs. This can limit the generalization of the results. However, similar to Java, .Net, Python and Ruby languages also produce crash traces. Therefore, JCHARMING could be applied to other object-oriented languages. In conclusion, internal and external validity have both been minimized by choosing a relatively large set of different systems and using input data that can be found in other programming languages. VII. CONCLUSION AND FUTURE WORK We presented JCHARMING (Java CrasH Automatic Reproduction by directed Model checking), an automatic bug reproduction technique that combines crash traces and directed model checking. JCHARMING takes advantage of the completeness provided by model checking while ignoring unwanted states by using the content of crash traces augmented with a backward slice. When applied to twenty
109
bugs from six open source systems, JCHARMING was able to reproduce fully or partially 85% of the bugs. To build on this work, we need to experiment with additional (and more complex) bugs with the dual aim to (a) improve and fine tune the approach, and (b) assess the scalability of our approach when applied to even larger (and proprietary) systems. Finally, we want to test the performance of JCHARMING on bugs due to multi-threading. REFERENCES [1]
[2]
[3]
[4]
[5]
[6]
[7] [8] [9] [10] [11]
[12]
[13]
[14]
[15]
N. Bettenburg, S. Just, A. Schröter, C. Weiss, R. Premraj, and T. Zimmermann, “What makes a good bug report?,” in Proceedings of the 16th ACM SIGSOFT International Symposium on Foundations of software engineering - SIGSOFT ’08/FSE-16, 2008, p. 308. S. Narayanasamy, G. Pokam, and B. Calder, “BugNet: Continuously Recording Program Execution for Deterministic Replay Debugging,” in Proceedings of the 32nd annual international symposium on Computer Architecture, 2005, vol. 33, no. 2, pp. 284–295. S. Artzi, S. Kim, and M. D. Ernst, “Recrash: Making software failures reproducible by preserving object states,” in Proceedings of the 22nd European conference on Object-Oriented Programming, 2008, pp. 542–565. H. Jaygarl, S. Kim, T. Xie, and C. K. Chang, “OCAT: Object Capture based Automated Testing,” in Proceedings of the 19th international symposium on Software testing and analysis, 2010, pp. 159–170. R. Manevich, M. Sridharan, and S. Adams, “PSE: explaining program failures via postmortem static analysis,” in ACM SIGSOFT Software Engineering Notes, 2004, vol. 29, no. 6, p. 63. S. Chandra, S. J. Fink, and M. Sridharan, “Snugglebug: a powerful approach to weakest preconditions,” in ACM Sigplan Notices, 2009, vol. 44, no. 6, pp. 363–374. C. Baier and J. Katoen, Principles of Model Checking. MIT press Cambridge, 2008. N. Chen, “Star: stack trace based automatic crash reproduction,” 2013. B. Dutertre and L. De Moura, “The Yices SMT solver,” 2006. E. Gamma, K. Beck, and J. Report, “JUnit: A Cook’s Tour,” Java Repository, vol. 4, no. 5, pp. 27–38, 1999. W. Jin and A. Orso, “BugRedux: Reproducing field failures for inhouse debugging,” in 34th International Conference on Software Engineering (ICSE), 2012, pp. 474–484. W. Jin and A. Orso, “F3: fault localization for field failures,” in Proceedings of the International Symposium on Software Testing and Analysis - ISSTA 2013, 2013, pp. 213–223. J. Clause and A. Orso, “A Technique for Enabling and Supporting Debugging of Field Failures,” in Proceedings of the 29th international conference on Software Engineering, 2007, pp. 261–270. J. Rößler, A. Zeller, G. Fraser, C. Zamfir, and G. Candea, “Reconstructing Core Dumps,” in Proceedings of the 6th International Conference on Software Testing, Verification and Validation, ser. ICST, 2013, pp. 114-123. J. Steven, P. Chandra, B. Fleck, and A. Podgurski, “jRapture: A Capture/Replay Tool for Observation-Based Testing,” in Proceedings of the International Symposium on Software Testing and Analysis., 2000, no. August, pp. 158–167.
[16] C. Zamfir and G. Candea, “Execution Synthesis: A Technique for Automated Software Debugging,” in Proceeding of EuroSys ’10 Proceedings of the 5th European conference on Computer systems, 2010, pp. 321–334. [17] W. Visser, K. Havelund, G. Brat, S. Park, and F. Lerda, “Model Checking Programs,” in Automated Software Engineering, 2003, vol. 10, no. 2, pp. 203–232. [18] T. Kropf, Introduction to formal hardware verification. Springer, 1999. [19] S. A. Kripke, “Semantical Considerations on Modal Logic,” Acta Philos. Fenn., vol. 16, no. 1963, pp. 83–94, 1963. [20] G. J. Holzmann, “The model checker SPIN,” IEEE Transaction in. Software Engineering., vol. 23, no. 5, pp. 279–295, 1997. [21] N. Rungta and E. G. Mercer, “Guided model checking for programs with polymorphism,” in Proceedings of the ACM SIGPLAN Workshop on Partial evaluation and program manipulation, 2009, p. 21. [22] Oracle, “Throwable (Java Plateform SE6),” 2011. [Online]. Available: http://docs.oracle.com/javase/6/docs/api/java/lang/Throwable.html. [23] A. De Lucia, “Program slicing: Methods and applications,” in International Working Conference on Source Code Analysis and Manipulation, 2001, p. 144. [24] IBM, “T. J. Watson Libraries for Analysis (WALA),” 2006. . [25] NASA, “Choice Generator,” 2007. [Online]. Available: http://babelfish.arc.nasa.gov/trac/jpf/wiki/devel/choicegenerator. [26] S. Kim, T. Zimmermann, and N. Nagappan, “Crash Graphs: An Aggregated View of Multiple Crashes to Improve Crash Triage,” in Proceedings of the International Conference on Dependable Systems and Networks (DSN), 2013, pp. 486–493. [27] L. Opyrchal and A. Prakash, “Efficient Object Serialization in Java Lukasz Opyrchal and Atul Prakash,” in Proceedings. 19th IEEE International Conference on Distributed Computing Systems, 1999, pp. 96–101. [28] Xstream, “Xstream,” 2011. [Online]. Available: http://xstream.codehaus.org/. [29] Apache Software Foundation, “Apache Ant,” 2007. [Online]. Available: http://ant.apache.org/. [30] CollabNet, “Tigris.org: Open Source Software Engineering,” 2002. [Online]. Available: http://www.tigris.org/. [31] B. Wellington, “dnsjava,” 2013. [Online]. Available: http://www.dnsjava.org/. [32] Object Refinery Limited, “JFreeChart,” 2005. [Online]. Available: http://jfree.org/jfreechart/. [33] The Apache Software Foundation, “Log4j 2 Guide - Apache Log4j 2,” 1999. [Online]. Available: http://logging.apache.org/log4j/2.x/. [34] NASA, “Open Mission Control Technologies,” 2009. [Online]. Available: https://sites.google.com/site/openmct/. [35] Apache Software Foundation, “Apache PDFBox | A Java PDF Library,” 2014. [Online]. Available: http://pdfbox.apache.org/. [36] RedHat, “JBoss Developer,” 2005. [Online]. Available: http://www.jboss.org/. [37] C. Weiß, T. Zimmermann, and A. Zeller, “How Long will it Take to Fix This Bug ?,” in Proceedings of the Fourth International Workshop on Mining Software Repositories, 2007, p. 1. [38] Apache Software Foundation, “Apache Struts Project,” 2000. [Online]. Available: http://struts.apache.org/.
110