MATEC Web of Conferences 79, 01022 (2016)
DOI: 10.1051/ matecconf/201679010 22
IME&T 2016
JITTER IN GEOLOCATION DATA PROCESSING Andrey Klokov1,*, Andrey Zapasnoy1, Svetlana Shipilova2 1
National Research Tomsk State University, 634050, Tomsk, Russia National Research Tomsk Polytechnic University, 634050, Tomsk, Russia
2
Abstract. Technology of increasing resolution of an “OKO-2” industrial ground penetrating radar with jitter application is considered on an example of geolocation of tunnels of underground animals. In the present work we suggest to use the alternative approach based on separation of jitter. To separate jitter, the domain of Fourier frequencies and the window functions that separate high-frequency signal components are used. When the jitter was separated, focusing is performed.
1 Introduction Nowadays systems of subsurface sensing – ground penetrating radars – are widely used. These systems are used for nondestructive testing of the state of water and gas supply pipes, quality of laying asphalt at public roads, inspections of historical burial places, search for artifacts of any type, etc [1–5]. In this regard, a problem arises of quick and high-quality processing of ground penetrating radar data. To obtain high resolution, the approach based on an artificial increase in the antenna aperture – the method of synthetic aperture – is used. Its essence consists in scanning of the examined volume from different positions and then application of focusing operation to the obtained wave projections. The subsurface radio tomography is based on the application of this method.
2 Theoretical principles of geolocation with jitter application From physical reasons it is clear that the spatial resolution is determined primarily by the upper frequency of the radiation spectrum. However, on the other hand, the higher the frequency, the smaller is the depth of radiation penetration into the examined medium. Therefore, both domestic (Logic Systems Ltd and JSC VNIISMI) and foreign manufacturers (Geoscanners AB, MALA GeoScience AB (Sweden), and OYO Corporation (Japan)) of ground penetrating radars offer to end-users a wide variety of antenna units with different sensing depths and different resolutions. For example, Logic systems Ltd produces antenna units for the “OKO-2” ground penetrating radar with central frequency from 90 MHz to 2 GHz. The AB-90 antenna unit has a sensing depth of 16 m and a resolution of only 0.5 m and the AB-1700 antenna unit has a sensing depth of only 1 m, but its resolution is 10 times higher and makes 0.03 m.
*
Corresponding author:
[email protected]
© The Authors, published by EDP Sciences. This is an open access article distributed under the terms of the Creative Commons Attribution License 4.0 (http://creativecommons.org/licenses/by/4.0/).
MATEC Web of Conferences 79, 01022 (2016)
DOI: 10.1051/ matecconf/201679010 22
IME&T 2016
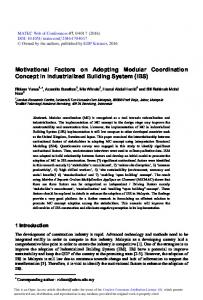
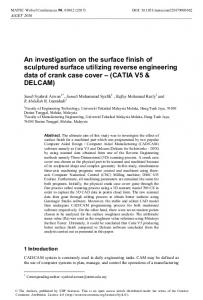
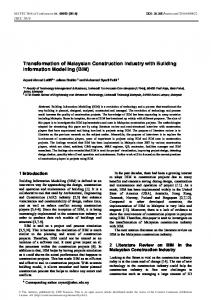
From the literature (for example, see [6]) it is well known that as a result of diffraction, each point scatterer in a homogeneous medium is displayed by a hyperbole (Figure 1).
Figure 1. Reflections from point objects in a homogeneous medium.
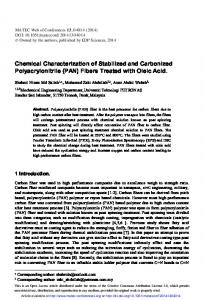
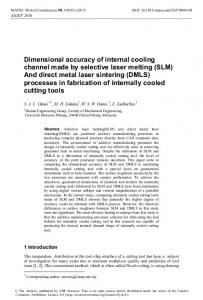
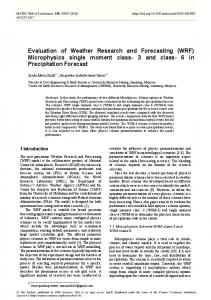
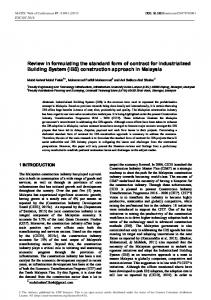
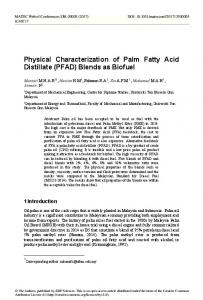
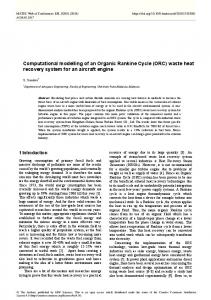
In this case, the true position of the scatterer corresponds to the hyperbola apex. Focusing displaces reflections to their true positions eliminating the diffraction effect and increasing the spatial resolution. If at the focusing point there is an actual inhomogeneity, the response from a stronger inhomogeneity will be more pronounced. Changing the position of the focusing point, all probed subsurface space can be scanned and an image of the inhomogeneous medium can be obtained. The focusing method can be implemented using different algorithms, for example, diffraction summation along hyperboles, the Stolt migration, and focusing by the phase shift method. Some of these algorithms are implemented in the time domain and others in the domain of spatial frequencies. Two focusing methods are most widely used for data processing, including the diffraction summation method in the time domain [6] and the Stolt migration method in the spectral domain [6, 7]. The foregoing is common to all geolocation methods. The transverse and longitudinal resolutions are determined by the minimum radiation wavelength and the spectrum width. A contradiction arises: the smaller the wavelength (the higher the frequency), the higher is the resolution; however, the corresponding frequencies are quickly attenuated in the medium, and their penetration depth is limited by the skin layer. Low frequencies penetrate relatively deep into the ground, but give low spatial resolution. At present high-power ground penetrating radars whose high-frequency spectral components have sufficient energy are used to resolve this contradiction. In the present work we suggest to use the alternative approach based on separation of jitter. Detectors of modern microwave ground penetrating radars are stroboscopic oscilloscopes. Their operation principle consists in stroboscopic transformation of the examined signal into its LF analog, that is, a sample from successive signal parts is used to record ultrashort signals. Only one signal reading is taken from each signal with a fixed time step (strobe). As a result of sensing of an object, a medium, or an inhomogeneity, the informative impulse appears to be covered by a noise track (Figure 2) that reduces the signal/noise ratio. To eliminate the effect of the jitter and to increase the signal/noise ratio, signal accumulation (Figure 3) and subsequent averaging (Figure 4) are used. At first sight this noise is harmful and useless; moreover, it is amplified in the regions of maximum
2
MATEC Web of Conferences 79, 01022 (2016)
DOI: 10.1051/ matecconf/201679010 22
IME&T 2016
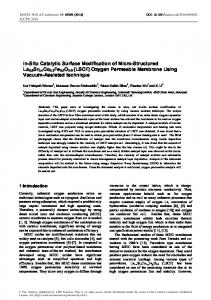
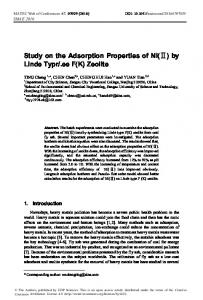
values of impulse derivatives on impulse fronts and decays, as can be seen from Figure 5. This Figure shows the standard deviation for ten realizations of an ultra wideband (UWB) impulse. After closer examination it becomes clear that the total signal is the result of jitter modulation by the informative signal. The spectrum of the jitter being separated has higher frequencies than the average informative signal and at the same time, the spectrum is coherent with the signal since it is modulated by the signal. In this case, the seemingly negative factor is that the jitter is not averaged but is separated and subsequently used to increase the spatial resolution. To separate jitter, the domain of Fourier frequencies and the window functions that separate high-frequency signal components are used.
Figure 2. UWB impulse for stroboscopic detection.
Figure 3. Accumulation of UWB impulses for stroboscopic detection.
3
MATEC Web of Conferences 79, 01022 (2016)
DOI: 10.1051/ matecconf/201679010 22
IME&T 2016
Figure 4. Average UWB impulse.
Figure 5. Standard deviation of the UWB impulse.
3 Study of underground animals habitat Absolutely new application of the ground penetrating radar is suggested by scientists of National Research Tomsk State University. It is devoted to a study of burrows and tunnels of underground mammals, in particular, zokors – mole-rat rodents living underground and digging tunnels with their powerful front claws [8]. In comparison with the conventional methods, such approach does not destruct the habitat of animals and hence the existing natural balance. Acting in this direction, the scientists performed investigations of agricultural fields in Kozhevnikovo District of Tomsk Region near Novopokrovka village with the ground penetrating radar in August 2015. Several plots with clearly pronounced signs of zokor activity – obvious signs of zokor coming on the surface – were investigated. The plots represented squares with the edge 7.5 m long. To ensure high resolution, the radar subsystem “OKO-2” with bipolar probing radio impulses having radiation spectrum with an average frequency of 1700 MHz was chosen. The estimated sensing depth was of the order of one meter, and the depth resolution was about three centimeters [9]. This resolution allowed the zokor tunnels to be imaged. To obtain the subsurface image, a precise position of the ground penetrating radar on the surface must be recorded. The relative radar position along the sensing path was determined by radar tools – a control wheel combined with a displacement sensor. The transverse motion should be controlled by the user; therefore, each plot was marked before sensing. The scanning pitch in the longitudinal direction was 0.022 m, and in the transverse
4
MATEC Web of Conferences 79, 01022 (2016)
DOI: 10.1051/ matecconf/201679010 22
IME&T 2016
direction it was 0.2 m. The ground was marked with a nylon cord. When scanning a relatively large area, several uncertainties arise, one of which is referred to the zero leveling, since the ground penetrating radar is not tightly adjacent to the ground, and the second is caused by the need for data smoothing along the direction of transverse radar motion. In this case, to minimize errors in determining the coordinates, a steel tape ruler was stretched along one of the square edges transverse to the direction of radar motion. Since the tape ruler was tightly adjacent to the ground, it was considered as the zero level of the ground surface along the vertical direction and as the origin of radar traces in the longitudinal direction. A total of 37 parallel longitudinal traces were marked on each plot of the ground. Readings of the scattered field were obtained at 350 points on each trace. To increase the signal-to-noise ratio (SNR), measurements were performed 9 times at each point, thereby leading to a threefold increase of the SNR. The row data obtained with the ground penetrating radar “OKO-2”are shown in Figure 6.
Figure 6. Raw geolocation data (the position of the tape ruler is marked by the oval).
It can be seen that there are shifts in the zero level signal from the tape ruler (marked with the oval) along the radar trajectory. This shift occurred due to different initial radar positions on the transverse traces. To interpret the data correctly, the traces should be adjusted against the tape ruler position. To perform the necessary adjustment, an area around the tape ruler was selected and the correlation coefficients were calculated for traces relative each other. The latter were transformed into readings of trace shifts. The result of such adjustment is shown in Figure 7. In this Figure signals from the tape ruler are arranged perpendicular to the traces without significant shifts.
5
MATEC Web of Conferences 79, 01022 (2016)
DOI: 10.1051/ matecconf/201679010 22
IME&T 2016
Figure 7. Geolocation profile after data smoothing (the position of the tape ruler is marked by the oval).
For further processing of the data of the ground penetrating radar, it is necessary to consider the exponential attenuation of radiation with depth of penetration into soil [10]. The soil being probed contains a certain amount of moisture which causes the attenuation of radio signals. It can be considered only on the average for the background medium. The correction for this attenuation via renormalization of all measured signals by the average exponential decay allows the contribution of all layers to be leveled. Then the jitter is separated by the method described above and level-by-level focusing is performed. Results of processing with and without jitter are shown in Figures 8 and 9, respectively.
Figure 8. Crosscut of a horizontal zokor’s tunnel at a depth of 0.3 m; data processing with jitter.
6
MATEC Web of Conferences 79, 01022 (2016)
DOI: 10.1051/ matecconf/201679010 22
IME&T 2016
Figure 9. Crosscut of a horizontal zokor’s tunnel at a depth of 3 m; data processing without jitter.
4 Conclusion Analyzing the results of data processing shown in Figures 8 and 9, we can conclude that the jitter application for processing of geolocation data allows fine details of the relief to be detected, artifacts to be smoothed or eliminated at all, and more reliable results to be obtained. The main purpose of this research is to develop a robust method for detection and recognition of form of subsurface objects and also full three-dimension tomography of subsurface. In the paper presents the alternative approach for geolocation data processing based on separation of jitter. This method can improve resolution of a subsurface image.
Acknowledgment This work was supported in part by the Russian Foundation for Basic Research (grant (mol_a) No. 16-32-00619 “Study possibilities for applying jitter to increase resolution in the subsurface tomography”.
References [1] [2] [3] [4] [5] [6] [7] [8]
W.L. Lai, T. Kind, H. Wiggenhauser, NDT and E International 44, 111 (2011) doi: 10.1016/j.ndteint.2010.10.002 Ó. Pueyo-Anchuela, A.M. Casas-Sainz, M.A. Soriano, A. Pocoví-Juan, Physics and Chemistry of the Earth 36(16), 1211 (2011) doi: 10.1016/j.pce.2011.05.010 C. Tinelli, A. Ribolini, G. Bianucci, M. Bini, W. Landini, Comptes Rendus - Palevol 11, 445 (2012) doi: 10.1016/j.crpv.2012.04.002 L. Song, W. Yang, J. Huang, H. Li, X. Zhang, Journal of Geophysics and Engineering, 10, 034004 (2013) doi: 10.1088/1742-2132/10/3/034004 R. Sala, R. Tamba, E. Garcia-Garcia, Elements 12, 19 (2016) doi: 10.2113/gselements.12.1.19 O. Yilmaz, M. Stephen, Doherty Seismic Data Analysis: Processing, Inversion and Interpretation of Seismic Data (Society of Exploration Geophysicists, 2000) R.H. Stolt, Geophysics 43, 23 (1978) I.P. Laptev, Mammals of Western Siberia Taiga (TSU Publishing, Tomsk, 1958) 7
MATEC Web of Conferences 79, 01022 (2016)
DOI: 10.1051/ matecconf/201679010 22
IME&T 2016
[9] [10]
Manual for the ground penetrating radar OKO-2 (Logitcheskiye systemy, Мoscow, 2011) V.P. Yakubov, S.E. Shipilov, D.Ya. Sukhanov, A.V. Klokov, Radio-wave tomography: achievements and prospects (NTL,Тomsk, 2014)
8