Jun 19, 2009 - Three tests for zero restrictions on regression coefficients that are known to be nonnega- tive are considered: the classical F test, the likelihood ...
M PRA Munich Personal RePEc Archive
Joint Tests for Zero Restrictions on Non-negative Regression Coefficients Grant Hillier Monash University
1986
Online at http://mpra.ub.uni-muenchen.de/15804/ MPRA Paper No. 15804, posted 19. June 2009 05:44 UTC
Biometrika (1986), 73, 3, pp. 657-69 Printed in Great Britain
Joint tests for zero restrictions on nonnegative regression coefficients BY GRANT H. HILLIER Department of Econometrics and Operations Research, Monash University, Victoria, Australia 3168 SUMMARY
Three tests for zero restrictions on regression coefficients that are known to be nonnegative are considered: the classical F test, the likelihood ratio test, and a one-sided t test in a particular direction. Critical values for the likelihood ratio test are given for the cases of two and three restrictions, and the power function is calculated for the case of two restrictions. The analysis is conducted in terms of a characterization of the clas all similar tests for the problem, of which each of the above tests is a member. The likelihood ratio test emerges as the preferred test. Some key words: Likelihood ratio test; One-sided alternative; Regression; Similar regions.
1.
INTRODUCTION
There are numerous applications of the linear model in which the signs of at least some of the regression coefficients are known a priori. Without loss of generality we can assume that the coefficients of interest are known to be nonnegative. This paper is concerned with the problem of testing the joint null hypothesis that k 2s 2 such coefficients are zero, against the alternative that they are nonnegative, in the context of the classical normal linear model. Writing the model as y = Xp + Zy+u,
u~N(0,o- 2 / n ),
(1)
with X an nxp matrix, Z an n x k matrix, and W = (X, Z) of full column rank(/> + fc), the problem of interest is that of testing Ho: y = 0 against the one-sided alternative H*: y>0, where y > 0 means that yt 2s 0 for each i = 1 , . . . , k, with strict inequality for at least one i. Both the case of more general constraints on i7' = (j8', y'), for example Ho: R-q = r against Rrj 3= r, R and r both known, and the case u ~ N(0, cr2Cl),ftknown, are easily transformed into this form. A number of authors, notably Bartholomew (1959a, b; 1961), Chacko (1963), Kudo (1963), Niiesch (1966), Perlman (1969), Oosterhoff (1969) and Shorack (1967), have considered closely related multivariate one-sided testing problems. Oosterhoff (1969, §3.1) gives results for the case /3 = 0, while Gourieroux, Holly & Monfort (1982) and Yancey, Judge & Bock (1981) have recently considered the same problem under the simplifying assumptions that the covariance matrix is completely known, in the former paper, or that the regressors are orthonormal, in the latter. Kudo (1963, § 5) claims to have characterized the likelihood ratio test for the case where a2 in (1) is unknown, but we shall see later that Kudo's advice is incorrect. In the present paper we assume that a2 is unknown, and impose no special restrictions on X and Z The paper is primarily concerned with the likelihood ratio test but we also
658
GRANT H. HILLIER
consider for comparison the traditional F test, which takes no account of the signs of the coefficients under the alternative, and a one-sided t test in a particular direction from the null. All three tests are similar tests for Ho, and we start with a characterization of the class of similar tests. The critical region for any similar test of Ho must be defined in terms of a statistic that measures the direction of any departure from Ho, and a statistic that measures the extent of any such departure. This immediately suggests ways of improving the F test, which is based purely on the latter statistic, when the alternative hypothesis is restricted to H^, and also provides a very simple way of describing the critical region for the likelihood ratio test. 2. SIMILAR REGIONS
For testing Ho: y = 0 in (1) the parameters /3 and a2 are nuisance parameters, but under Ho the statistics po = (X'X)-lX'y and s20 = y'Mxy, where Mx = I-X(X'XylX', 2 s are jointly sufficient for (/3, a ) and the distribution of ($0, l) is complete. Hence, every size a critical region a> for testing Ho consists of a fraction a of the surface content of the manifold in _y-space defined by (j80,5o) = const; see Cox & Hinkley (1974, pp. 134-6). If attention is confined to similar regions the relevant density for the problem becomes the conditional density of y given /§0 and si, or the density of y on the manifold defined by (f}0, si) = const. We show in the Appendix that the manifold defined by (/30, sl) = const has three components: the surface of the unit m-sphere, Sm: v'v = 1, where m = n-k-p, the surface of the unit fc-sphere, Sk: h'h = \, and the line segment 0s= b ^ 1, where b is related to the usual F statistic for testing Ho by b - (kF/m)/(1 + kF/m), and v and h are defined in the Appendix. Hence every similar region for testing Ho must consist of some fraction of the surface v'v = 1, some fraction of the surface h'h = 1, and some fraction of the line segment 0=£fc=£1. The statistic v is independent of h, b and si, and is uniformly distributed on 5 m , whether or not Ho is true. It follows from this that the most powerful critical regions must include the entire surface v'v = l, so that attention may be confined to critical regions defined in terms of h and b alone. Under Ho, h, b and si are mutually independent, h is uniformly distributed on Sk, b has the beta distribution B{^k,\m), and sl/a-2~#2(m +fc).Hence, as expected, the conditional distribution of y given 0O and si is free of nuisance parameters when H^ is true. Under the general alternative Ha: y + 0 the conditional density of h and b given si is p(h, b\sl) = Kxb*~\\ -&)*"-' exp (s0b*h'y/a2), (2) where y = Ty, with T as defined in the Appendix, and K, = n\k)V^kB{\k, ±mm\sl/ 0 consists of large values
Zero restrictions on nonnegative regression coefficients
659 >l
of b* cos0*, where 0* is the angle between h and the unit vector ft* = y*/{y*'y*) . This has the following well-known consequences: (i) if fc = 1 the one-sided t test that rejects Ho for large positive values of b^h is uniformly most powerful similar; (ii) if fc> 1 there is no uniformly most powerful similar test for Ho, whether or not the alternative is restricted to H+a\ (iii) if k> 1 and, under Ha, y = Sy*, with •y*>0 known and 5 ^ 0 , the best similar region consists of large positive values of 6* cos 0*. This is equivalent to a one-sided t test of 5 = 0 against 5 > 0 in the equation y = Xfi + SZy* + u, because the t statistic for this problem is (m +fc-1)**?*cos 0 7 Q - & cos2 0*)*.
(3)
For testing Ho against //„, (iii) above suggests that the following strategy may yield a reasonable test: choose a particular vector y* in the region y > 0, and simply use a one-sided f-test for S = 0 against S > 0 in the equation y = XfS + SZy* + tL The resulting test is evidently locally most powerful similar in directions close to that of y*, and might be expected to have reasonable power over the whole region y > 0. We discuss this approach in more detail in § 5 below. Let /A = y/iy'y)^ be the point on Sk determined by the true vector y; fi indicates the direction in which the true vector y lies, and /A and A are the population analogues of h and F. From (2), the conditional power, given si, of a critical region co is given by
where (dh) denotes the invariant measure on the surface of the unit fc-sphere (James, 1954). Using (4) it is easy to show that the power of the test depends only upon A if and only if (o includes the entire surface of the Sk: h'h = 1, a result due to Wolfowitz (1949). It is well known that the traditional F test has precisely this property. In fact, on integrating (4) over h'h - 1, and then integrating out s\, it follows that the F test is uniformly most powerful among similar tests whose power depends only upon A (Hsu, 1941). Now notice that h'fi = cos 8, where 0 is the angle between h and ft. For any fixed /i., that is, for y in any fixed direction, cos 0 ranges over the entire interval - 1 « cos 0 «s 1 as h ranges over S*, so that the power of the F test is in fact diminished by the inclusion in the critical region of that part of Sk for which cos 0 is negative. Of course, if the direction fj, of y is arbitrary, this observation is nugatory, but for the problem of testing Ho against //„ it suggests that a test which excludes that part of the Sk: h'h = 1 for which cos 0 must be negative from the critical region is likely to improve upon the F test. We shall now show that the likelihood ratio test does exactly that, and does indeed improve upon the F test.
4. THE LIKELIHOOD RATIO TEST
4-1. Critical regions
After maximizing the likehood with respect to the nuisance parameters /3 and cr2 we find the profile likelihood to be proportional to L = {s20+l2-2lscos6}-ln,
(5)
660
GRANT H. HILLIER
where l = (y'y)* denotes the length of y and the other notation is as in § 3 and the Appendix. Now, the region y > 0 for y corresponds to a subset of the surface of the unit sphere Sk: p/p, = 1, say Sa. Provided the 'direction' p. = 0 is admitted as a possibility, the problem of maximizing (5) with respect to y, subject to y > 0, is equivalent to that of maximizing (5) first with respect to the direction, p., of y, subject to p. e Sa, then with respect to its length, I But, if h e Sa it is clear at once that (5) is maximized by choosing p, = h, so that cos 0 = 1, and / = s, giving a maximum of {sl(l -&)}"*"• Let Sa denote the subset of'the Sk: h'h = l for which cos 0 = /»'p. must be negative when fieSa. That is, Sa is the set of points h on Sk that make an angle greater than \TT with every point fieSa. Clearly, if h e Sa, (5) is maximized by setting p. = 0, and hence / = 0, giving a maximum of (sl)~*n. If h is in neither Sa nor Sa, so that p, cannot be chosen to give 0 = 0, but can be-chosen so that 0^577, then (5) is clearly maximized by choosing p, on the edge of Sa so as to minimize the angle between p. and the given point h. We denote such a choice for p. by fih, and it is clear that (5) is then maximized by setting l = sh'p.h, giving a maximum of [s2{\-b(h'fLh)2}Tin. Since the maximized value of the likelihood under Ho is proportional to {s2)} *", the critical region for the likelihood ratio test has the following form: b>c (heSa), _ b(h'{Lh)2>c (he(Sk-Sa-Sa)),
, (b)
where c is a suitably chosen critical value. Notice that, because 0. The details are easily deduced from the results that follow for the cases k = 2, 3 and are omitted. 4-2. The case k = 2
Let Z = (zi, z2), and write 7'KA V Z MXZ
\
]
T
= \
\,
T= \
L
2
\ \
- \
1 2 .j ,
LO o-2(i-p y\
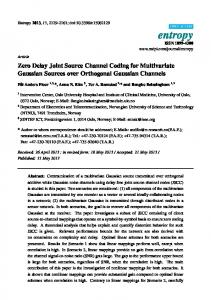
where cr\ = z\Mxzi (i = l,2) and p = (z\Mxz2)/Xo-,o-2). The region y > 0 corresponds to the region {y^p-yVCl-p 2 ) 5 ; ^5=0}, where y' = {yx, y2). Writing /x' = (/x,, p2), the region Sa for fi is an arc on the positive semicircle for /JL2 that subtends an angle a = cos"1 p, measured clockwise from the vertical axis; see Fig. 1. The region (S2-Sa-Sa) has two components, S'a and S£ in Fig. 1. For heS'a, pTJ, = (l,O), while, for h e S"a, /I), = (p, (1 -p 2 ) 1 ). In terms of the elements of y' = (y,, y2) the regions 5 a , 5^, S"a are
Zero restrictions on nonnegative regression coefficients
661
(a) p > 0
(b) pc;heS'a},
{b(h'jL2)2> c; he S"a},
respectively, where /I', = (1,0) and iX'2 = (p, (1 -p 2 )*).
662
GRANT H.
HILLIER
Now, the invariant differential form (dh) on, in this case, 5 2 , may be decomposed (James, 1954, pp. 57-8) into (dh) = dd, where 0 is the angle, measured in a clockwise direction, between any conveniently chosen fixed point on 5 2 and h. For the first of the above regions we measure 6 from the vertical axis and we have at once u
dbde=-^\
Jb>c Jo
_,p
, db
b>c
where / = jmc/(l - c). For the third region we measure 6 from the point /I2 and we have, on putting bl = b cos2 6,b2 = b sin2 6,
Jp*
-bx-
.... 1 db2db
J b,>c JO
_l
b7*(l — ^ i ) i f "
f
4 Jb
5(- 1 m+ 1 )
= ipr{F(l,m + where/, = (m + l ) c / ( l - c ) = 2(m + l)//m. It is easy to check that the contribution of the second region is identical to that of the third, so that the critical value / is the solution to the equation 2TT
pr{F(2,
(7)
Note that (7) admits a solution for/ only if a jk)l{i\-p«t)(l-
j) (i,j = 1,2,3). The matrix T is given
Zero restrictions on nonnegative regression coefficients
663
Table 1. 5% and 1% critical values for the likelihood ratio test:fc= 2 p
m = 10
m = 15
m=20
m=30
m = 50
0-9
5% 1%
1-83 403
1-76 3-68
1-72 3-51
1-69 3-36
1-66 3-24
0-7
5% 1%
208 4-46
1-98 402
1-93 3-82
1-89 3-63
1-85 3-48
0-5
5% 1%
2-25 4-73
213 4-23
2-07 4-01
2-02 3-80
1-97 3-64
0-3
5% 1%
2-39 4-95
2-25 4-40
2-18 416
2-12 3-93
2-07 3-76
0-1
5% 1%
2-51 514
2-35 4-55
2-28 4-29
2-21 4-04
216 3-86
0-0
5% 1%
2-56 5-23
2-40 4-62
2-33 4-35
2-25 4-10
2-20 3-91
-0-1
5% 1%
2-62 5-31
2-45 4-69
2-37 4-41
2-29 415
2-24 3-95
-0-3
5% 1%
2-73 5-48
2-54 4-81
2-46 4-52
2-37 4-25
2-31 4-04
-0-5
5% 1%
2-84 5-65
2-64 4-94
2-55 4-63
2-46 4-35
2-39 413
-0-7
5% 1%
2-96 5-83
2-74 5-08
2-64 4-75
2-54 4-45
2-47 4-23
-0-9
5% 1%
3-11 606
2-87 5-26
2-76 4-91
2-66 4-58
2-57 4-35
410 7-56
3-68 6-36
3-49 5-85
3-32 5-39
318 506
F
Linear interpolation between successive p values for fixed m is extremely accurate.
The region y > 0 corresponds to the region {y-cty2~c2y3^0; y2-c3y3^0; y^G) with c, = 0 , 2 / ( 1 ^ 2 ) ' , c2 = Piy2/(l-R]^ and c3 = p 2 3 .i/(l-pki)'. where 1-^.23 =
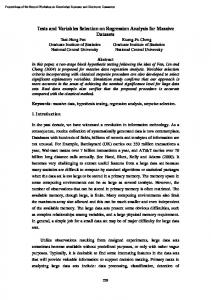
The regions Sa for /A is the region ABC in Fig. 2 which is drawn for the case p12 > 0, P23.i>0, Pi3.2>0. The region Sa may be described as follows: draw three 'equators' EA, EB and EC with A, B and C respectively as 'north poles'. The southernmost unbroken line that can be drawn while remaining on one of these 'equators' is the northern boundary of Sa.
The points A, B and C are A = {1,0,0},
B = {p13, P23A(l - Pu) J , (1 - P?3)J(1 ~ p k . ) 1 } ,
The coordinates of A', B' and C are easily deduced from the obvious orthogonality relations with A, B and C. The line BB', for example, represents the locus of the points of tangency between latitudes drawn with B as 'north pole' and latitudes drawn with B' as 'north pole', so that points in BB'C are closest, in terms of angular distance, to B, while points in AB'B are closest to points on the edge AB of Sa. Thus, for h e BB'C, /Ifc is at B, while, for h e AB'B, /lh is a point on the edge AB of Sa. Similar remarks hold for the other four regions depicted in Fig. 2.
664
GRANT H. HILLIER
Fig. 2. Regions Sa and Sa when pn> 0, p13 2 > 0, pu , > 0.
The six components of (S3-Sa- Sa) can be expressed in terms of the elements of y' = {j\, 72, Ji) by using the definition of h in terms of y. The results are summarized in Table 2, which also gives the appropriate test statistic and critical value for each section of ( 5 3 - S f l - 5 B ) . Table 2. Critical region for the likelihood ratio test: k = 3 Region
Test statistic
Critical value
II 0)0 III 3(m + 2)//m
Ill: i = 1, 2,3; (j,fc)= (2, 3), (1, 3), (1, 2).
In Table 2, F{J is the F statistic that would be used to test the joint significance of z, and Zj in the regression of y on X, z, and zJt with zk excluded, and t, is the f statistic for the coefficient of z, in the regression of y on X and z, alone. The critical value c in (6) is related to / in Table 2 by c = (3//m)(l + 3//m)~'. As before, the use of Fy and t, explicitly acknowledges that, on the boundary of 5 a , one or more elements of y are zero. The integral that defines the critical value, c, for the test decomposes in this case into seven components, and the invariant measure (dh) on S3 decomposes as (dh) = sin 0, ddx dO2, where 0, is the angle between h and a fixed point /x0, say, on 5 3 , and 62 is the angle between the unit vector lying along the orthogonal projection of h onto the 5 2 orthogonal to fx0 and a point jx0, say, in that 5 2 . By judiciously choosing the points /x0 and /Zo, the components of the integral can be calculated in exactly the same manner
Zero restrictions on nonnegative regression coefficients
665
as was used in § 4-2 above for the casefc= 2. Thus we find that the critical value / in Table 2 is defined by a= — [{cos"1 p 12J + cos"1 p 132 + cos"1 P23.,- v} pr {F(3, m)>f\ 4TT
+ {cos~1 pn + cos"1 pn + cos"1 pn}pr{F(2, m + l ) > | ( m + l)//m} + {cos~1 (-p, 2 j) + cos"1 ( - p u ^ + cos"1 (-P23.1)} x p r { F ( l , m + 2)>3(m + 2)//m}].
(8)
As in the case k = 2, equation (8) admits a solution for / only if a < Kl + Ccos"1 pn + cos"1 pi3 + cos~1p23)/(27r)}, but this constraint is unlikely to be of practical importance. Table 3 gives a small selection of critical values, f, calculated from (8). Table 3. Some 5% critical values for the likelihood ratio test: fc = 3 p, 2
p13
P23
m = 10
m = 15
m = 20
m=30
m = 50
0-9 0-9 0-9 0-6 -0-1 -0-3 -0-9 00
0-9 0-6 01 -0-5 -0-5 -0-5 -0-5 00
0-9 0-3 -01 -0-3 -0-3 -0-5 01 00
1-23 1-50 1-71 214 2-52 2-80 300 215
1-21 1-46 1-65 202 2-35 2-57 2-74 203
1-21 1-44 1-63 1-97 2-26 2-55 2-62 1-98
1-20 1-42 1-60 1-91 218 2-44 2-50 1-92
119 1-41 1-57 1-87 212 2-36 2-41 1-88-
F
3-71
3-29
310
2-92
2-79
Again, it is striking that the likelihood ratio critical values can be much smaller than those of the traditional F test, the differences being greatest when p 12 , P13 and P23 are all large and positive. 4-4. Power function: k = 2
As in the case of the size of the test, the conditional power function, given si,
=f
db(dh),
decomposes into three components, with regions of integration {b>c;heSa},
{b{h'^)2>c;heS'a},
{b(h'fL2)2> c;heS"a).
Consider first the last of these regions. Setting (dh) = dd, as before, 6 with the angle, measured in a clockwise direction, between /I2 and h, the contribution to the conditional power from this region is simply *:,(! - b)im-1 exp {(Afts2,)* cos (6 + a - do)/cr} db dO,
where R = {b cos2 6 > c; 0 *£ 6 s£ \TT), 6O is the angle between the vertical axis and fi, and a = cos"1 p. Transforming to 6, = 6 cos2 6, b2 = b sin2 0 and evaluating the integral gives, after averaging with respect to the density of si, the contribution of this region to
666
GRANT H. HILLIER
the unconditional power of the test. It is easy to see that the contribution of the second region is identical to that of the third except that (a - 0O) is replaced by 00 itself. Hence we find that the contribution from these two regions is
where KIJ(OO)
=Mcos' (a - 0O) sin-* (a - 0O) + cos' 0O sinJ 0O}
(10)
and Iu(a,b) denotes the incomplete beta integral with parameters a and b and upper limit u. Turning next to the first region, we again put (dh) = dO but in this case measure 0 from the vertical axis, i.e. from /I,, so that h> = cos (0 - 0O) and 0 =£ 0 =£ a. Provided both 0O and a - 60 are less than \tr the calculation is straightforward and gives, after averaging with respect to the density of s\, the unconditional power deriving from the region {b>c; heSa} to be
*
I
T
^^W,(i
(11)
where Since both 0O and (a — 0O) must be less than \TT when p > 0, expressions (11) and (12) are valid when p > 0 . When p < 0 either 60 or (a-60) can exceed \TT, and in that case Jj(0o) m (11) is replaced, for even values of j , by
The total power of the test is given by the sum of expressions (9) and (11), and is evidently a function of A, m and 60, with d0 reflecting the direction in which the true vector y lies. From (10), (12) and (13) it follows that the power function is symmetric with respect to 0O about the point Q0 = \a, is maximized with respect to 80 when 00 = 5^ and is minimized with respect to 0O when 0O = a. Some power calculations based on (9)-(13) are in Table 4. Comparison with the last two lines of Table 5 shows that the likelihood ratio test is superior to the F test over the whole range for p, and that the improvement in power in the likelihood ratio test is substantial when p is large and positive. The power function for the casefc= 3 can be obtained by an obvious generalization of the argument above. We omit details and merely note that, since the source of the improvement in power is the same in k 5= 3 dimensions as it is in the case fc = 2, there are good grounds for expecting that the above conclusions will remain valid in general. 5. DIRECTED t TESTS
We consider next the test suggested in § 3, a one-sided t test based on a preselected vector, y* say, in the feasible region under H^. From (3), this test rejects Ho when b^h'fi,* =fe*cos 0* is large and positive. Hence, the critical region for the test is co* = {6i cos 0*> c, he S*}, where S* is the set of points on the 5 k : h'h = 1 which make an angle less than \n with /i*. Notice that, since /**e Sa, S* excludes all of Sa, and also
Zero restrictions on nonnegative regression coefficients
667
Table 4. Power of the likelihood ratio test: k = 2, a = 0 0 5 , A = 2, 8 p
a
A
0O
m = 10
m = 15
m = 20
m = 30
m = 50
0-9
0-4510
2 2 8 8
a \a a \a
0-358 0-370 0-820 0-834
0-369 0-380 0-836 0-848
0-375 0-386 0-844 0-856
0-381 0-391 0-852 0-863
.0-386 0-396 0-859 0-868
0-5
10472
2 2 8 8
a \a a
0-311 0-347 0-766 0-803
0-323 0-358 0-790 0-822
0-329 0-364 0-802 0-831
0-336 0-370 0-813 0-840
0-342 0-375 0-822 0-847
a \a a \a a \a a \a a \a a \a
0-271 0-320 0-722 0-768
0-284 0-331 0-752 0-791
0-291 0-338 0-767 0-803
0-299 0-344 0-781 0-814
0-305 0-349 0-792 0-823
0-239 0-292 0-684 0-733
0-253 0-304 0-719 0-761
0-261 0-310 0-736 0-775
0-269 0-317 0-752 0-789
0-275 0-323 0-766 0-799
0-212 0-263 0-646 0-698
0-226 0-276 0-685 0-730
0-233 0-282 0-705 0-746
0-241 0-290 0-724 0-762
0-248 0-296 0-739 0-776
00
1-5708
2 2 8 8
-0-5
20944
2 2 8 8
-0-9
2-6906
2 2 8 8
ha
Table 5. Minimum power of the optimal directed t test: k = 2, a =0 < 05 p
A
m = 10
m = 15
m = 20
m = 30
m = 50
0-9
2 8
0-360 0-817
0-371 0-834
0-376 0-843
0-382 0-850
0-387 0-857
0-5
2 8
0-298 0-692
0-310 0-724
0-316 0-741
0-322 0-757
0-328 0-770
0-3
2 8
0-266 0-614
0-278 0-654
0-285 0-675
0-291 0-695
0-297 0-712
01
2 8
0-235 0-527
0-247 0-573
0-253 0-598
0-260 0-622
0-266 0-643
-0-2
2 8
0187 0-385
0199 0-435
0-205 0-463
0-211 0-492
0-217 0-517
-0-5
2 8
0140 0-240
0149 0-284
0155 0-311
0160 0-339
0165 0-365
-0-9
2 8
0070 0065
0076 0084
0080 0097
0083 0112
0086 0127
0J = O
2 8
0-375 0-842
0-386 0-856
0-391 0-862
0-396 0-869
0-401 0-874
Power of F:
2 8
0178 0-575
0192 0-623
0-200 0-647
0-207 0-670
0-216 0-694
excludes part of (Sk - Sa — Sa). Integrating (2) over co*, and then averaging with respect to the density of si, gives the power function P*
i - u v (*A)j+*'cos'fl?sin2-'flg u-o 7 ' H » + 1)
r
668
GRANT H. HILLIER
where 0? is the angle between y and y*, and \- c2 = {1 + t2j(m + k-l)}~\ with t2. determined by pr {F(l, m + k -1) > t2.} = 2a. The power function (14) is evidently a function of A, m, k and 6%, the angle between the true vector y and the preselected vector y*. The power is a maximum at 6% = 0 and is a decreasing function of 0*, but it is, of course, impossible to choose y* so as to ensure that 6* is small even when it is known that y > 0. Nevertheless, there is an optimal choice for y* when y is restricted to the region y > 0 under Ha in the following sense. The test based on the vector y* for which the maximum value of 8* over all /x e Sa is smallest will maximize the minimum possible power of the test. In the case k = 2 the vector \x* corresponding to y* should obviously bisect the angle a, see Fig. 1, which yields the vector y*' = (o-2, er,) as the optimal choice for y* in the above sense. For k 5e 3 the problem of finding the optimal y* is more complicated. When fc = 3, if the point fia, say, that makes the same angle with each of the extremities of Sa is within Sa, then /i,* = /i a and y* = (Z'MxZ)~'d, where d' = (a1,a-2,cr3). However, the point fxa may not lie within Sa, and in that case p.* should be taken as the point on the longest edge of Sa that bisects the angle between its endpoints. Table 5 gives some power calculations based on (14) for k = 2, a = 0-05, various values for A and m and, in the body of the table, 8* =ia- Values in the main body of Table 5 represent the minimum power of the directed t test for which this minimum power is largest. Table 5 gives also the power of the directed t test when 8* = 0, and the power of the F test. The entries for 8* = 0 give the maximum possible power for any test of Ho because the t test in the correct direction is uniformly most powerful similar. The minimum power of the best directed t test exceeds that of F for p 2= -0-2 when A =2, for p3*0-l when A = 5, and for p>0-3 when A =8. Thus, when p is reasonably large this test is better than the F test for k = 2. Tables 4 and 5 reveal that the likelihood ratio test dominates the directed f test, in terms of minimum power, for almost all values of p. Both tests are excellent when p is large, but the power of the directed t test falls off much more sharply than that of the likelihood ratio test as p declines. Hence, at least for the case k = 2, the likelihood ratio test is superior.
ACKNOWLEDGEMENTS
I am grateful to Bruce Dowel for carrying out the calculations, and to Murray Smith and the referees for helpful comments on the first version of the paper.
APPENDIX Let m = n-k-p,
The manifold defined by (/Jo, $o) constant and let C be an nxm matrix such that CC' = Inl
1
X
W(W'W)'1
W and
C'C = Im. Put w = C'y, 0O = (X'X)- X'y and y = (Z MXZ)~ Z'Mj. The vectors w, 0O and y are mutually independent, H>~ N(0,