Journal of Computational Science and Technology
Vol. 7, No. 2, 2013
Design and Optimization of a Gas Burner for TPV Application* Giulio CASSIO**, Carlo POLONI**, Valentino PEDIRODA** and Giovanni MOSETTI** **Department of Engineering and Architecture, University of Trieste Via Valerio 10, 34100, Trieste, Italy E-mail:
[email protected]
Abstract A thermophotovoltaic (TPV) system is able to convert directly thermal energy, generated by a high temperature heat source, into electricity through thermophotovoltaic cells. Although the energy flux has three steps, designing a TPV system with high efficiency is a challenging task. This particular device has been studied for house heating applications in order to reach better performances and higher efficiency values, compared to traditional boilers. The main issue is to achieve high and uniform temperature values on the emitter surface. In the first step of this project a novel swirl gas burner is being developed and optimized in order to fulfill these objectives. Experimental tests have been performed on a first prototype considering different values of input power, thus fuel flow rate and air mass flow rate, changing some geometrical characteristics of the burner. Collected results have then be used to create response surface functions, to be used in a multi-objective optimization considering efficiency, maximum and mean temperature of the emitter. Key words: Thermophotovoltaics, Multi - Objective Optimization, IR Thermography
1. Introduction
*Received 31 Jan., 2013 (No. 13-0043) [DOI: 10.1299/jcst.7.156]
Copyright © 2013 by JSME
From the mid 90's research in energy field has focused on the design of new systems with higher efficiency, higher performances, lower costs and lower emissions. In this sense, strategies have moved toward the optimization of existing technologies, like the development of internal combustion engines with lower fuel consumption and emissions, to respect new law constrictions. A second issue is the development of new types of devices using modern technologies in the renewable energy field (fuel cells, wind and solar energy). But the main issue with these types of technologies regards their dependence to atmospheric conditions, high costs and unresolved problems concerning energy storage. The last option is to develop new systems which combine the production of different types of energy, thus enhancing efficiency and performances. Thermophotovoltaic (TPV) systems belong to this last family of devices as seen in Refs. (1) and (2). A heating source is used to bring an emitter to incandescence and the radiated power is converted into electricity by thermophotovoltaic cells. In this way part of the incoming energy is used to produce electrical power, the rest is not wasted but used for heating purposes. In this paper the development of a gas burner for TPV house heating applications is presented. In order to achieve high performances in such a complex system numerical and
156
Journal of Computational Science and Technology
Vol. 7, No. 2, 2013
experimental analysis have been used. Regarding this second aspect, tests require time if different configurations have to be examined and only a limited number of design points can be measured. In order to save time but have a sufficient level of detail it has been decided to use the Response Surface methodology. This technique allows, through different algorithms, to find an analytical function to approximate the trend of the output variable. In this particular case, experimental points have been used to train the response surface and then calculate the performances of the prototype combustor in not measured points. All the steps regarding the creation and optimization using the response surface models has been performed using Estecos software ModeFrontier.
2. TPV System A Thermophotovoltaic device can be divided into three fundamental parts: a heat source, an emitter and cells. These parts correspond to the energy conversions in the system. The heat source is responsible for generating heat in order to bring the emitter to incandescence. The process involved can differ depending on the configuration of the system, the application and dimensions. Several different types of sources can be used: gas or liquid fuel burners, solar concentrators, fuel cells.
Figure 1: energy flux and fundamental parts involved in a TPV system The emitter converts heat in radiative energy, directing it toward the cells. Shape and dimensions depend on the system configuration, while chemical, physical and optical properties greatly influence spectral emissivity. Different materials can be used, but all must have some standard characteristics, which include resistance to high temperatures and high values of emissivity. Silicon Carbide (SiC) and Allumina ( ) are often used for their good chemical and physical properties. But research has now focused on broad band, or selective, emitters which radiate only in a specific range of the whole spectrum, matched with the cells absorption interval. , , Holmia and Neodymia are some examples of rear earth materials tested nowadays as presented in Ref. (3). Thermophotovoltaic cells are semiconductor devices which absorb radiation and convert it into electricity through the photovoltaic effect. Respect to conventional photovoltaic cells, the emitter works at low temperatures, thus the peak of the energy spectrum is shifted in the near infrared region. On the other hand proximity of the emitter is responsible for high energy density. For these reasons materials such as Silicon and Germanium cannot be used, because the absorption bandwidth does not match the radiative energy of the emitter. Now, in order to maximize the electric output, multi-junction cells are under study and reviewed in Ref. (4). These have much higher efficiencies and are capable of converting a large portion of infrared light into electricity, but have high material and production costs. GaInSb, GaInAsSb, InGaAs, InAs, InPAs, InAsP,InGaAsSb and InAsSbP are some of cells used in TPV applications as used in Refs. (5) and (6). Between the emitter and the cells optical filters can be used. These have two positive aspects redirecting part of the non useful radiation back to the emitter. Emitter temperature is thus enhanced due to this positive energy flux and at the same time cell temperature is
157
Journal of Computational Science and Technology
Vol. 7, No. 2, 2013
decreased. Even though the principles undergoing the system seem simple, the development is a very challenging task. In fact, not only every single component has to be singularly optimized, but at the same time has to be efficiently coupled with the rest of the components. If emitter and cells, for example are not wavelength matched, electricity production is low.
3. Burner In this particular case the TPV system is designed for house heating applications. Thus using a gas fired burner as heat source is a natural choice. Regarding fuel, these first tests have been done using propane. In order to approximate the emitter with a point wise source of light, it has been decided to use a 20 mm diameter tube. This will be the inconel combustion chamber outer surface, in order to try and maximize heat transfer between the flame and the emitter. In order to stabilize and maintain the combustion reaction inside this volume it has been decided to impose a rotational motion to the flow, through a swirling component.
Figure 2: picture of the emitter Considering only the combustor performances, two related objectives can be defined, since these determine the electrical output of the whole system. The main issue is maximizing the mean emitter temperature value. The second regards uniformity of temperature considering the whole emitting surface. This parameter is necessary, since the electrical power is determined by the cell with the worst performance due to the parallel and serial connection in cells stacks. Defining the uniformity of the temperature field is a trivial task, since no information is known on the cells system. For this reason several different definitions can be considered, without knowing which is correct for the TPV system. So it has been decided to take this property into account considering it in a qualitative way, analyzing the temperature profile of the emitter. Other two output variables have then been investigated and analyzed: maximum temperature and combustion efficiency. The first value represents the maximum value recorded on the emitter surface. The second is the ratio between the input chemical power, obtained multiplying the lower calorific value with the mass flow rate, and the emitted power, calculated with the Stefan Boltzmann law, considering mean temperature.
4. Experimental analysis In the laboratory of the Department of Engineering of the University of Trieste a prototype of the burner has been built and tested. This has been constructed in a modular way, in order to have the possibility to change some geometrical characteristics in the search for the optimal configuration. Propane has been used as a fuel, while air has been fed through a compressor and a pressurized line. Both mass flow rates have been measured and
158
Journal of Computational Science and Technology
Vol. 7, No. 2, 2013
regulated with EL – Flow digital instruments, specially designed for lab testing by Bronkhorst. Temperature measurements have been done using the infrared thermography technique. This procedure has three main advantages respect other measuring methods: it does not need contact between the instrument and the surface, global results can be obtained as well as precise locations measurements and is fast to perform repeated acquisitions. Measures have been done using the Agema 570 IR thermocamera, coupled with a dedicated software. Since the emissivity of inconel was not known, a calibration of the value to use has been done using a K thermocouple. After repeated tests it has been found that the emissivity of the oxidized tube was 0.8. Finally pictures have been elaborated in order to extract desired data. Temperature values at the centerline of the combustion chamber outer surface have been obtained. With these values, maximum, mean and minimum temperatures have been extracted. From three changing geometrical characteristics only one, concerning the inner tube of the combustion chamber, was considered. The inner 14 mm diameter tube links the mixing zone with the 20 mm diameter combustion chamber tube, creating an expansion. Both power, thus gas flow rate, and air flow rate, expressed through the equivalence ratio parameter, have been considered in the optimization run.
Figure 3: cross section of the burner representing the geometric variable of the inner tube length
5. Response surface methodology theory The response surface methodology (RSM), or metamodel, uses algorithms to determine an approximated function of an output variable concerning the input parameters, as defined in Ref. (7). The trend of the output variable is therefore reconstructed using known points. There are two different categories of RSM: interpolating, which pass exactly through database points, and approximating, which minimize the extrapolation error on the points. In the first group we can find K-nearest, Kriging and Radial basis functions, while in the second Polynomial, Gaussian Process, Neural Network and Genetic Programming. In order to correctly build a RSM metamodel, two steps have to be performed: 1. training 2.
validation
In the first step the algorithm uses known points to find a relationship between the input and output variables. The known dataset has to be uniform, with more factorial levels, and, the higher the number of points, the more accurate will the RSM be. After training is complete it is necessary to verify if the mathematical function correctly predicts the values of the output function in the other points. For this reason a set of real configurations, not used for
159
Journal of Computational Science and Technology
Vol. 7, No. 2, 2013
training, have to be used to verify results obtained with the RSM algorithm. This procedure has to be done with several different types of metamodels, since, it is not known a priori which will perform better. In fact, results are very case specific, depending on the trend of the output function, the number of input variables and the number of real points available. Inside ModeFrontier several types of RSM can be used: •
Polynomial Singular Value Decomposition (PSVD)
•
Radial Basis Function
•
Gaussian Process
•
K-Nearest
•
Kriging
•
Anisitropic Kriging
•
Neural Network
•
Evolutionary Design
The PSVD is a polynomial fitting algorithm which minimizes the squares of the errors on the dataset. The degree of the polynomial can be decided by the user, the higher the order the better will the model predict the trend of the output function. The increase of the number of parameters to be determined has to be matched by a bigger training dataset, otherwise the problem will be undetermined. Considering k the number of parameters and n the degree of the polynomial function, the requested number of training points, m, can be found with Equation 1: ! ! ! In this case, having 99 experimental points, the maximum adopted degree can be a sixth order. To evaluate the accuracy of the PSVD algorithm three different functions have been tested: first, third and sixth order. Results are presented in Fig. 4.
Figure 4: comparison between training dataset (blue points) and computed values through PSVD (orange points), first order (top left), third order (top right) and sixth order (bottom left) polynomial. Results regard the mean temperature RSM.
160
Journal of Computational Science and Technology
Vol. 7, No. 2, 2013
The K-Nearest metamodel is an approximating statistical algorithm which calculates unknown values of the function using a weighted average of the known points. The weights are obtained through the inverse distance method, as expressed in Eq. (2) reported in Ref. (8):
,
∑
,
Where p is an exponential term determined to be 2 after a series of benchmark tests and n is the number of experimental points. Kriging is a metamodel which belongs to the family of least mean square methods, controlled by the covariance function, as explained in Ref. (9). There are several different variants of this algorithm depending on the type of covariance function, or variogram, used: Gaussian is the smoothest, Matern 5/2 and Matern 3/2, are good tradeoffs between robustness and smoothness, Rational Q 0.5 and Rational Q 2, both are effective for sudden and slower variations in different regions and Exponential is used for very irregular functions. The Radial Basis Function model is very efficient even with small and scattered datasets and is a linear combination of radial functions centered in the training points, as stated in Eq. (3) published in Ref. (10): Φ
φ is the radial basis function, are coefficients used as free parameters, is a fixed scaling parameter, which determines the shape of the radial function, as can be seen in Fig. 5 .
Figure 5: shape of the radial function for different values of the scaling parameter Neural Network (NN) is an efficient metamodel based on a set of neurons which can be trained to approximate the output function. In ModeFrontier the initialization function is based on the Nguyer and Widrow approach, while the Levenberg - Marquedt back propagation algorithm is implemented to find the minimum of the error function. The size of the network, thus the number of hidden layers, in set to automatic, choice recommended in Ref. (11). In Fig. 6 absolute and relative residuals are plotted. Residuals are just the difference between the real and the predicted value, relative values are obtained dividing the difference with the real value.
161
Journal of Computational Science and Technology
Vol. 7, No. 2, 2013
Figuree 6: relative (top) and absolute (bottom) residual for the Neural Network metamodel for thee 99 validation points. Results regard the mean temperrature RSM. E Evolutionary design RSM is based on the genetic algoorithm theory. In fact, the output variabble is thought to be obtained through a combination off primitive elementary functions, such as a trigonometric or arithmetic, which represent the vaariables in the search for the total minim mum error.
6. Results M ModeFrontier has been used in all the steps of the annalysis: creation of the database, generaation and validation of the RSM and finally the opttimization run, operations which can alll be performed in the general workflow, presented in i Fig. 7. A wizard is present to guide the user in the creation of the metamodels, allowinng to select inputs, outputs and algoritthms, as well as training multiple RSM at the same tiime and modifying the algorithm param meters in order to achieve an accurate solution.
Figuree 6: ModeFrontier workflow
162
Journal of Computational Science and Technology
Vol. 7, No. 2, 2013
Three output variables have been used: 1. Mean temperature 2. Efficiency 3. Maximum temperature As for input variables three parameters have been considered: 1. Equivalence ratio: defined as the air mass flow rate divided by the stochiometric quantity, the range is determined by the experimental test between 1.4 and 2 2. Power: which is the chemical power introduced in the burner, which has a minimum and maximum value of respectively 2 kW and 5 kW 3. Inner tube length: is the length of the 14 mm tube entering the combustion chamber, this has been taken between 16 mm and 0 mm, which corresponds to no support tube Three different response surfaces have been created. As stated before it is impossible to know a priori which algorithm performs best. So the different metamodels have been created and then validated. Finally the most accurate has been chosen to perform the optimization run. This procedure has been done for all the three objectives and relative results will be now briefly presented. The first output variable to be calculated is mean temperature. Absolute, presented in Fig. 8, and mean residuals have been carefully judged regarding the 15 validation points for different RSM algorithms.
ABSOLUTE RESIDUALS [°C] 75 50 25 0 -25 -50
1 2 3 4 5 6 7 8 9 10 11 12 13 14 15
PSVD KRIGING K-NEAREST ANISITROPIC KRIGING NEURAL NETWORK RBF 1 EVOLUTIONARY DESIGN RBF 0 GAUSSIAN PROCESS
Validation point number
Figure 8: absolute residuals considering the validation points Analyzing results it has been seen that RBF and PSVD metamodels perform the best approximation of the mean temperature output function: the maximum absolute error is 21.7 °C in the first case and 24.7 °C in the second, while the mean residuals are 6.1 °C and 8.14 °C respectively. These results are very precise since measured temperatures range from 650 °C till 830 °C. Then the efficiency RSM has been generated and tested regarding real data. In this case the same metamodels behaved in a different way. This time the RBF algorithm had the better performance as it can be seen in Fig. 9.
163
Journal of Computational Science and Technology
Vol. 7, No. 2, 2013
EFFICIENCY
0.45
REAL
0.35
RBF
0.25
KRIGING K-NEAREST
0.15 0.05 0
3
6
9
12
validation point number
15
Figure 9: efficiency value in the validation points, comparing experimental with RSM data Finally the creation of the Response Surface model for maximum temperature has been generated. As for the previous cases results are accurate for some models, while others failed to correctly predict the trend of the function. Residuals for different algorithms are shown below in Table 1. Maximum residual (°C) Mean residual (%) PSVD 27.33 6.69 KRIGING 32.79 11.83 K-NEAREST 51.59 15.81 ANISITROPIC KRIGING 29.85 9.03 NEURAL NETWORK 49.91 10.38 RBF 0 29.99 8.46 Table 1: maximum and mean residuals for maximum temperature RSM
7. Multi - objective optimization Now that all the three metamodels have been created it is possible to perform a multi-objective optimization considering the output variables, as in Ref. (12). In all three cases the Radial Basis Function response surface has been used, the accuracy of the response surface metamodels is summarized in Table 2.
Output variable Efficiency Maximum temperature Mean temperature
RSM RBF RBF RBF
Maximum error 0.017 [-] 30.0 [°C] 21.75 [°C]
Mean error 0.0044 [-] 8.46 [°C] 6.13 [°C]
Table 2 : accuracy of the metamodels considering the 15 validation points The MOGA II genetic algorithm has been used, starting with a uniform latin hypercube of 100 design points. The initial population has been made to evolve for 200 generations trying to maximize efficiency, maximum and mean temperature, as can be seen on the 3D plot in Fig. 10.
164
Journal of Computational Science and Technology
Vol. 7, No. 2, 2013
Figure 10: a 3D scatter plot considering all the objectives, in green are evidenced the points belonging to the Pareto frontier From the 20000 computed designs 2109 belong to the Pareto frontier, this was expected since the consideration of three objectives at the same time. The shape is very complex too and it is not simple to identify a limited region of interest. But still some considerations can be done regarding the input parameters and the objectives trend. The points belonging to the Pareto frontier all have equivalence ratio ranging from 1.4 to 1.7 and power from 2.2 to 3.1 kW , but different lengths of the support tube. Since the mean temperature is considered the most important objective the design chosen from the optimization run is characterized by a power of 3 kW, an equivalence ratio of 1.70 and no support tube. In this configuration, the burner has a mean temperature of 829 °C, a maximum temperature of 921 °C, slightly lower than the peak value of 966°C, and an efficiency of 0.257, which has a maximum value of 0.35.
Figure 11: Design points concerning the optimization run concerning two output variables in each picture, in green the Pareto frontier points
165
Journal of Computational Science and Technology
Vol. 7, No. 2, 2013
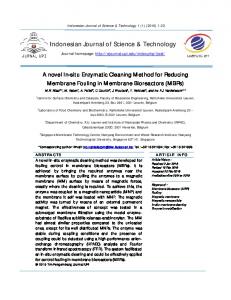
As said before mean temperature is the main issue concerning the development and optimization of the burner. For this reason it has been performed a single objective optimization using two different algorithms, in order to see if results would be enhanced. The SIMPLEX method and the HYBRID algorithm have been tested. The SIMPLEX algorithm is derived from the Nelder and Mead downhill method for non-linear optimization problems. It does not require the evaluation of derivatives, so it is more robust than other methods. The HYBRID algorithm can be used for single and multi objective optimization problems and combines the SQP implementation with the Genetic algorithm formulation. Surprisingly, results were similar to the ones obtained in the multi optimization problem. The optimal configuration has very good overall performances. The burner is characterized by no support tube length, thus having a less axial length. Power has a value of 3 kW with an equivalence ratio of 1.70. In Table 3 both input parameters and objectives of the starting point of the analysis and the optimized design are compared. While in Fig. 12 the temperature profile, obtained from an IR picture, is presented.
Design Optimal Starting
Power 3 kW 2 kW
E. R. 1.7 1.9
Inner tube 0 mm 8 mm
Mean temp 829 °C 677 °C
Max temp 921 °C 799 °C
Efficiency 0.257 0.22
Table 3: starting and optimized burner characteristics and performances
Figure 12: temperature profile for the starting design (blue) and the optimized configuration (red) Analyzing the two temperature profiles, the enhancement of performances between the two design points can be seen. The shortest axial development of the inner tube determines higher temperatures in the first 20 mm of the combustion chamber. The higher thermal energy guarantees higher overall values and uniformity from the central part to the exit. The optimal configuration, in fact, maintains an almost constant trend for about 150 mm.
8. Conclusions Experimental data have been used to create approximating functions of various output variables. In this way very detailed results can be obtained in a reasonable time interval. This procedure has been used in the development and optimization of a gas burner for TPV applications. RSM have been created for mean and maximum temperature and efficiency. Further work has to be done to optimize other parameters influencing the mixing zone area
166
Journal of Computational Science and Technology
Vol. 7, No. 2, 2013
or the ignition location. CFD simulations can help to better understand the combustion reactions inside the combustor. Another prototype will be constructed trying to change other geometric parameters and see how the emitter temperature is influenced by the different configurations.
References 1. Timothy J. Coutts, An overview of thermophotovoltaic generation of electricity, Solar Energy Materials & Solar Cells, Vol. 66 (2001) , pp. 443 - 452. 2. Yueh-Heng Li, Yung-Sheng Lien, Yei-Chin Chao and Derek Dunn-Rankin, Performance of a Mesoscale Liquid Fuel-film Combustion-driven TPV Power System, Progress in Photovoltaics: Research and Applications, Vol. 17 (2009), pp. 327–336. 3. B. Bitnar, W. Durisch, J.-C. Mayor, H. Sigg, H.R. Tschudi, Characterization of rare earth selective emitters for thermophotovoltaic applications, Solar Energy Materials & Solar Cells, Vol. 73 (2002), pp. 221–234. 4. Michael G. Mauk, Survey of Thermophotovoltaic (TPV) Devices Mid-infrared Semiconductor Optoelectronics, Springer Series in Optical Sciences Volume 118 (2006), pp. 673 - 738. 5. L. G. Ferguson, L. M. Fraas, Theoretical study of GaSb PV cell efficiency as a function of temperature, Solar Energy Materials and Solar Cells, Vol. 39 (1995), pp. 11-18. 6. K. Qiu, A.C.S. Hayden, M.G. Mauk, O.V. Sulim, Generation of electricity using InGaAsSb and GaSbTPV cells in combustion-driven radiant sources, Solar Energy Materials & Solar Cells, Vol. 90 (2006), pp. 68–81. 7. Marco Cavazzuti, Optimization Methods From Theory to Design (Scientific and Technological Aspects in Mechanics), Springerlink 2013 ISBN: 978-3-642-31186-4 (Print) 978-3-642-31187-1 (Online), pp. 43 - 70. 8. Silvia Poles, Alberto Lovison, Esteco technical report 2006 – 004, April 14 2006. 9. Alberto Lovison , Esteco technical report 2007 – 004, December 3, 2007. 10. Enrico Rigoni, Esteco technical report 2007 – 001 April 2, 2007. 11. ModeFrontier help manual. www.esteco.com 12. C. Poloni, A. Giurgevich, L. Onesti, V. Pediroda, Hybridization of a Multiobjective Genetic Algorithm, A Neural Network and a Classical Optimizer for a Complex Design Problem in Fluid Dynamics, Computer Methods in Applied Mechanics and Engineering, 186 (24) (2000), pp. 403 - 420.
167