Volume 2 No. 1
ISSN 2079-8407
Journal of Emerging Trends in Computing and Information Sciences ©2010-11 CIS Journal. All rights reserved. http://www.cisjournal.org
The Beaconless Node Velocity-based Stable Path Routing Protocol for Unicasting and Multicasting in Mobile Ad hoc Networks Natarajan Meghanathan Jackson State University, Jackson, MS 39217, USA
[email protected]
DeMarcus Thomas Mississippi Valley State University, Itta Bena, MS 38941, USA
Ebony S. Addison Elizabeth City State University, Elizabeth City, NC 27909, USA
ABSTRACT The high-level contribution of this paper is the development of a beaconless node-velocity-based stable path on-demand unicast routing protocol (NVSP) and its extension for multicasting (NVSP-M) in mobile ad hoc networks (MANETs). During the propagation of the Route-Request (RREQ) messages, every forwarding node includes its current node velocity information in the RREQs. The bottleneck velocity of a path is the maximum of the velocity of an intermediate node on the path. The destination chooses the path with the smallest bottleneck velocity and sends a Route-Reply (RREP) packet on the chosen path. NVSP-M connects the source to each of the multicast receivers through paths with the smallest bottleneck velocity. The lifetime of NVSP routes is 25-35% and 55-75% more than that of the routes chosen by the minimum-hop based Dynamic Source Routing (DSR) protocol in networks of low and high density respectively. The lifetime of routes chosen by NVSP is 60-70% of the route lifetime incurred by the Flow-Oriented Routing Protocol (FORP), the routing protocol observed to determine the sequence of most stable routes. On the other hand, the end-to-end delay per data packet and the energy consumed per packet incurred by NVSP are significantly lower than that of FORP and are lower or equal to that incurred for DSR. We compare the performance of NVSP-M with that of the Bandwidth Efficient Multicast Routing Protocol (BEMRP). Simulation results illustrate NVSP-M yields multicast trees with longer lifetime and lower hop count per source-receiver path; whereas BEMRP yields the minimum number of links per tree. Keywords: Mobile Ad hoc Networks; Routing Protocol; Unicast; Multicast; Beaconless; Node Velocity; Route Stability
1. INTRODUCTION A mobile ad hoc network (MANET) is a dynamic distributed of wireless nodes that move independent of each other. The nodes operate with a limited battery charge and as a result have a limited transmission range per hop. Routes in MANETs are often multi-hop in nature; thus each node is capable of serving both as a forwarding node as well as a source/destination of a data communication session. MANET routing protocols could be proactive or reactive in nature. The proactive routing protocols tend to predetermine the routes between any pair of nodes irrespective of their requirement. The reactive routing protocols tend to determine routes between a pair of nodes only when required and this is accomplished through a broadcast query-reply cycle. In a dynamically changing mobile environment, typical of MANETs, the periodic table exchange overhead of the proactive routing protocols is significantly larger compared to that of the ondemand route discovery overhead of the reactive routing protocols [1][2]. Hence, we restrict ourselves to ondemand reactive routing for the rest of this paper. Based on the route selection principles of MANET routing protocols, one can classify them as either
minimum-weight path based routing or stable path routing protocols [3]. Most of the routing protocols proposed for the minimum-weight category aim to minimize the number of hops in the path from a source s to destination d. Examples are the Dynamic Source Routing (DSR) protocol [4], Ad hoc On-demand Distance Vector (AODV) routing protocol [5] and the Destination Sequenced Distance Vector (DSDV) routing protocol [6]. DSR has been observed to give the best performance among these protocols for most of the scenarios tested in several simulation based performance studies [1][2]. The stable path routing protocols aim to minimize the number of route discoveries, but incur a relatively higher control overhead (due to periodic beacon exchange) and routing overhead (due to larger hop count paths) [7]. Some of the well-known stable path routing protocols include the Associativity-Based Routing (ABR) protocol [8], FlowOriented Routing Protocol (FORP) [9] and the Routelifetime Assessment Based Routing (RABR) protocol [10]. Performance comparison studies [11][12] of the stable path routing protocols rank FORP routes to be the most stable when compared to those of ABR and RABR. Even though the stable path routing protocols incur a lower number of route discoveries per path (as low as half
49
Volume 2 No. 1
ISSN 2079-8407
Journal of Emerging Trends in Computing and Information Sciences ©2010-11 CIS Journal. All rights reserved. http://www.cisjournal.org
the number of route discoveries incurred by the minimumhop based routing protocols), performance metrics like the end-to-end delay per data packet and the energy consumed per data packet could be as large as twice to that incurred with the minimum-hop based routing protocols. This is typically attributed to the larger hop count per path for the stable path routing protocols. On the other hand, frequent flooding-based route discoveries incurred due to the minimum hop based routing protocols can significantly consume the network bandwidth and congest the network. All of these above observations form the motivation for our work. In this paper, we propose a novel stable path MANET routing protocol that uses only the node velocity information to choose routes that have a significantly longer lifetime and larger packet delivery ratio compared to that incurred with stable path routing protocols (such as FORP) and a lower end-to-end delay and energy consumption per data packet compared to that incurred with that of the minimum-hop based routing protocols (such as DSR). We call the proposed protocol as “Node Velocity-based Stable Path” (NVSP) routing protocol and it does not require the use of beacons unlike the other stable path routing protocols (like FORP, ABR, RABR and etc) proposed so far in the literature. NVSP can be widely applicable in MANETs in which each node travels independent (with a different velocity) of the other nodes in the network. NVSP works as follows: During the broadcast of the Route-Request (RREQ) packets from the source towards the destination, each intermediate forwarding node of the RREQ packet appends its current node velocity information in the RREQ packet. The bottleneck velocity of a path is the maximum of the velocity values of the intermediate nodes of the path. The destination chooses the path with the smallest value for the bottleneck velocity and sends a Route-Reply (RREP) packet in the reverse direction of the chosen path (i.e., towards the source). Multicasting is the process of sending a single stream of data from one node to several nodes within a network. Multicasting is commonly used in collaborative and distributed computing applications that require one-tomany and many-to-many communications among the participants. A multicast tree connects the source to the set of receivers (called the multicast group) such that there is exactly one path from the source to each receiver. While propagating down the tree, the data is duplicated only when required. This is better than multiple unicast transmissions. Several tree-based multicast routing protocols have been proposed in the literature [13]. The tree-based multicast protocols can be further divided into two types: source tree-based and shared tree-based protocols. In source tree-based multicast protocols, the tree is rooted at the source, whereas in the shared treebased multicast protocols, a single tree is shared by all the sources within the multicast group and is rooted at a node often referred to as the core node. Even though, shared tree-based protocols scale with respect to the number of sources, these protocols suffer under a single point of
failure, core node. On the other hand, the source treebased protocols are more efficient with respect to traffic distribution. As a result of all these observations, in this paper, we restrict ourselves to the source tree-based ondemand multicast routing protocols for MANETs. In the second half of the paper, we present the multicast extension of the NVSP protocol (referred to as NVSP-M). NVSP-M connects the source to each of the multicast receivers through paths with the smallest bottleneck velocity. Through extensive simulations, we compare the performance of NVSP-M with that of the Bandwidth Efficient Multicast Routing Protocol (BEMRP) [14] for MANETs. BEMRP is designed to minimize the number of links used in a multicast tree for efficient and effective usage of the network bandwidth. In [15], Meghanathan compared the performance of the common classes of multicast routing protocols: minimum-hop based Multicast Extension to the AODV (MAODV) protocol [16], minimum-link based BEMRP and the stability-based Associativity-Based Ad hoc Multicast (ABAM) routing protocol [17]. It was observed that the multicast trees of BEMRP are as stable as that of ABAM and incur the lowest number of links. Also, BEMRP trees are far stable than MAODV trees and incur slightly larger hop count than the minimum hop count. In lieu of all these features associated with BEMRP, we feel it suffices to compare the performance of NVSP-M with that of BEMRP, the best multicast MANET routing protocol that has been proposed so far for maximizing the lifetime of the tree and simultaneously minimizing the number of links per tree. The rest of this paper is organized as follows: In Section 2, we briefly discuss about DSR, FORP and BEMRP protocols proposed in the literature. In Section 3, we discuss the different phases of operation of the NVSP routing protocol and Section 4 presents the performance comparison simulation results of NVSP with FORP and DSR. Section 5 explains the design of the NVSP-M protocol in detail. Section 6 describes the simulation environment, illustrates the simulation results obtained for NVSP-M and BEMRP with respect to different performance metrics and interprets the results for different operating conditions. Section 7 concludes the paper and also discusses future work. Throughout the paper, we use the terms ‘path’ and ‘route’, ‘link’ and ‘edge’, ‘packet’ and ‘message’ interchangeably. They mean the same.
2. REVIEW PROTOCOLS
OF
MANET
ROUTING
In order to better understand the comparison of the simulation results, we review in this section the working of the minimum-hop based DSR and stability-based FORP (both unicast) routing protocols and the minimum-edge based BEMRP multicast routing protocol.
2.1 Dynamic Source Routing (DSR) Protocol DSR uses source routing: data packets carry information about the route from the source to the
50
Volume 2 No. 1
ISSN 2079-8407
Journal of Emerging Trends in Computing and Information Sciences ©2010-11 CIS Journal. All rights reserved. http://www.cisjournal.org
destination in the packet header. As a result, intermediate nodes need not store up-to-date routing information in their forwarding tables. This avoids the need for beacon control neighbor detection packets that are currently used in the stable path routing protocols. Route discovery is by means of the broadcast query-reply cycle, briefly described as follows: Whenever a source node s has data to send to a destination node d and does not have an s-d route to use, the source node broadcasts a Route-Request (RREQ) packet throughout its neighborhood. Each intermediate node that receives the RREQ packet for the first time forwards the packet to its neighborhood. The RREQ packet reaching a node contains the list of intermediate nodes through which it has propagated from the source node. After receiving the first RREQ packet, the destination waits for a shorter time period for any more RREQ packets, then chooses a path with the minimum hop count and sends a RREP along the selected path. Later, if any RREQ is received through a path with a lower hop count than that of the selected path, another RREP would be sent on the latest minimum hop path discovered.
According to BEMRP [14], a newly joining node to the multicast group opts for the nearest forwarding node in the existing tree, rather than choosing a minimum-hop count path from the source of the multicast group. As a result, the number of links in the multicast tree is reduced leading to savings in the network bandwidth. Multicast tree construction is receiver-initiated. When a node wishes to join the multicast group as a receiver, it initiates the flooding of Join control packets targeted towards the nodes that are currently members of the multicast tree. On receiving the first Join control packet, the member node waits for a certain time before sending a Reply packet. The member node sends a Reply packet on the path, traversed by the Join control packet, with the minimum number of intermediate forwarding nodes. The newly joining receiver node collects the Reply packets from different member nodes and would send a Reserve packet on that path that has the minimum number of forwarding nodes from the member node to itself. To provide more bandwidth efficiency, the tree maintenance approach in BEMRP is hard-state based, i.e. a member node transmits control packets only after a link breaks.
2.2 Flow-Oriented Routing Protocol (FORP) Each node is assumed to be able to predict the expiration time (LET) values of each of its links with neighboring nodes based on the information exchanged using the beacons regarding the current position of the nodes, velocity, direction of movement and the transmission range. FORP assumes the availability of location-update mechanisms like GPS (Global Positioning System) [18] to identify the location of the nodes and also assumes that the clocks across all nodes are synchronized. Route discovery is similar to the broadcast query-reply cycle described for DSR, with the information propagated in the RREQ packet being the predicted LET of each link in a path and the destination selects the path with the maximum route expiration time (RET). The RET of a path is defined as the minimum of the LET values of all wireless links on the path. Given the motion parameters of two neighboring nodes, the duration of time the two nodes will remain neighbors can be predicted as follows: Let two nodes i and j be within the transmission range of each other. Let (xi, yi) and (xj, yj) be the co-ordinates of the mobile hosts i and j respectively. Let vi, vj be the velocities and Θi, Θj, where (0 ≤ Θi, Θj < 2π) indicate the direction of motion of nodes i and j respectively. The amount of time the two nodes i and j will stay connected, Di-j, can be predicted as follows:
(a 2 c 2 )r 2 (ad bc) 2 … (1) a 2 c2 where a = vi cosΘi – vj cosΘj ; b = xi – xj ; c = vi sinΘi – vj sinΘj ; d = yi – yj Di j
(ab cd )
2.3 Bandwidth Efficient Multicast Routing Protocol (BEMRP)
3. DESIGN OF THE NODE VELOCITYBASED STABLE PATH (NVSP) UNICAST ROUTING PROTOCOL The objective the NVSP routing protocol is to choose routes with larger lifetime based on the node velocity information collected as part of the route discovery process. The routing protocol does not require periodic beacon exchange among nodes in a neighborhood, which has been an essential requirement for the stable path routing protocols proposed so far in the literature. The following sections describe in detail, the working of the NVSP routing protocol.
3.1 Route Request (RREQ) Propagation When the source node has a data packet to send to a destination node and is not aware of any route to that node, the source initiates a flooding-based route discovery by broadcasting a Route-Request (RREQ) packet to its neighbors. The source maintains a monotonically increasing sequence number for the flooding-based route discoveries it initiates to reach the destination. Each node on receiving the first RREQ of the current flooding process from the source to the destination (i.e., an RREQ packet with a sequence number greater than those seen before), appends its “Information Update Vector” in the RREQ packet.
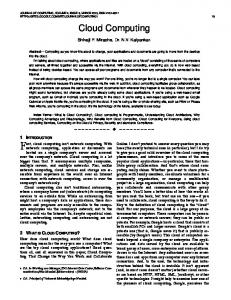
Figure 1: Information Update Vector (IUV) Appended by an Intermediate Node
51
Volume 2 No. 1
ISSN 2079-8407
Journal of Emerging Trends in Computing and Information Sciences ©2010-11 CIS Journal. All rights reserved. http://www.cisjournal.org
3.3 Data Packet Transmission and Route Maintenance Figure 2: Structure of the Route-Request (RREQ) Packet The Information Update Vector (IUV) of a node includes the unique node ID and the current velocity of the node. The structures of the IUV and the RREQ packet are shown in Figures 1 and 2 respectively.
3.2 Route Selection and Route Reply The RREQ packets propagate through several paths. After receiving the first RREQ packet, the destination waits for a certain time to receive the RREQ packets from all the paths. The destination then employs the following route selection model to choose the best route to notify the source. Let Vi be the current velocity of an intermediate node i as reported in its IUV field of the RREQ packet that propagated through path Pj. Let P be the set of all paths through which all the RREQ packets propagated. The bottleneck velocity of a path Pj, denoted as VPj, is the maximum of the velocity values of the intermediate nodes on the path. Note that, the bottleneck velocity of a path directly connecting the source and the destination (through a wireless link) is 0. The destination selects the path that has the minimum value for the bottleneck velocity. A Route-Reply (RREP) packet is sent on the discovered route to the source. The structure of the RREP packet is shown in Figure 3. All the nodes receiving the RREP packet update their routing tables to forward the incoming data packets (from the source to the destination) to the node that sent the RREP packet. Note that upon receiving a RREQ packet, we do not let an intermediate node to immediately generate a RREP packet to the source, even though the intermediate node might know of a valid route to the destination. We intentionally do this so that we could collect the latest information about the node velocities from each node in the network through the RREQ packets and let the destination choose the best route according to the above route selection principle. The overhead associated with including the node velocity information (8 bytes for every node) in the RREQ packet is affordable as the number of flooding-based route discoveries are significantly reduced because of larger route lifetimes. All the other information included in the RREQ and RREP packets are similar to those included in the well-known MANET routing protocols.
The source starts sending the data packets to the destination on the route learnt through the RREP packet. The header of the data packet (structure shown in Figure 4) contains the usual fields of the source and destination IDs and the monotonically increasing sequence number for the data packets. If a link failure occurs due to the two nodes constituting the link drifting away, the upstream node of the broken link informs about the broken route to the source node through a Route-Error packet (structure shown in Figure 5). The source node on learning the route failure will stop sending the data packets and will initiate another global flooding-based route discovery.
Figure 4: Structure of the Header of the Data Packet
Figure 5: Structure of the Route Error Packet
4. PERFORMANCE COMPARISON SIMULATIONS OF NVSP, FORP AND DSR We implemented the NVSP, FORP and DSR protocols in a discrete-event simulator implemented in Java. The network dimensions are 1000m x 1000m. The transmission range of each node is 250m. We vary the network density by conducting simulations with 50 nodes (low density network with an average of 10 neighbors per node) and 100 nodes (high density network with an average of 20 neighbors per node). The energy level at each node is initially 1500 Joules. In the case of FORP, each node periodically sends information about its location and current velocity in the beacons. Each node keeps track of the previously advertised location of its neighbor nodes. This will help to determine the direction in which the neighbor node is moving. The MAC layer uses the distributed co-ordination function (DCF) of the IEEE Standard 802.11 [19] for wireless LANs.
4.1 Traffic Model
Figure 3: Route Reply (RREP) Packet
Traffic sources are continuous bit rate (CBR) based. Number of source-destination (s-d) sessions used is 15 (low traffic load) and 30 (high traffic load). The starting times of the s-d sessions is uniformly distributed between 1 to 20 seconds. Data packets are 512 bytes in size; the packet sending rate is 4 data packets per second. While distributing the source-destination roles for each
52
Volume 2 No. 1
ISSN 2079-8407
Journal of Emerging Trends in Computing and Information Sciences ©2010-11 CIS Journal. All rights reserved. http://www.cisjournal.org
node, we saw to it that a node does not end up as source for more than one session and also not as destination for more than one session.
(ii)
4.2 Energy Consumption Model Energy consumption at a node in an ad hoc network can be divided into three categories: (i) Energy utilized for transmitting a message, (ii) Energy utilized for receiving a message and (iii) Energy utilized in idle state. In [20], it has been shown that in the presence of overhearing, no real optimization in the energy consumption or node lifetime can be achieved. That is, the energy consumption at a node would be dominated by the energy lost when the node is in idle state (also referred to as being in the promiscuous mode). Thus, in this paper, we do not consider the energy lost in the idle state and focus only on the energy consumed during the transmission and reception of messages (the DATA packets, the MAC layer RTS-CTS-ACK packets and the periodic beacons), and the energy consumed due to route discoveries. We model the energy consumed due to broadcast traffic and point-topoint traffic as linear functions of the packet transmission time, network density, transmission and reception powers per hop. A similar linear modeling for energy consumption has been used in [21][22]. As there is no transmission power control, the fixed transmission power per hop is 1.4W. The reception power per hop is fixed for all situations and it is 0.967W.
4.3 Node Mobility Model The node mobility model used in all of our simulations is the Random Waypoint model [23], a widely used mobility model in MANET simulation studies. According to this model, each node starts moving from an arbitrary location to a randomly selected destination location at a speed uniformly distributed in the range [vmin,…,vmax]. Once the destination is reached, the node may stop there for a certain time called the pause time and then continue to move by choosing a different target location and a different velocity. In this paper, we set vmin = 0, and each node chooses speed uniformly distributed between 0 and vmax. The vmax values used are 10 m/s (representing low node mobility scenarios), 30 m/s (representing moderate node mobility scenarios) and 50 m/s (representing high node mobility scenarios). These vmax values represent average node velocities of 5 m/s, 15 m/s and 25 m/s respectively. Pause time is 0 seconds.
4.4 Performance Metrics Each data point in all of Figures 6 through 10 is an average of data collected using 5 mobility trace files and 5 sets of randomly selected 15 and 30 s-d sessions. We study the following performance metrics for the three routing protocols: (i) Average Route Lifetime – the average of the lifetime of the routes per s-d session, averaged over all the sd sessions of a simulation run.
(iii)
(iv)
(v)
Hop Count per Route – average of the number of hops in the routes of an s-d session, time-averaged after considering all the s-d sessions. For example, if a routing protocol uses paths P1 and P2 of hop counts 3 and 5 for time 10 seconds and 5 seconds respectively, then the time-averaged hop count for the total time of 15 seconds is (3*10+5*5)/15 = 3.67 seconds and not simply 4 seconds. Packet Delivery Ratio – the ratio of the data packets delivered to the destination to the data packets originated at the source, computed over all the s-d sessions. End-to-End Delay per Data Packet – average of the delay incurred by the data packets that originate at the source and delivered at the destination. The delay incurred by a data packet includes all the possible delays – the buffering delay due to the route acquisition latency, the queuing delay at the interface queue to access the medium, transmission delay, propagation delay, and the retransmission delays due to the MAC layer collisions. Energy Consumed per Data Packet – average of the energy consumed by all the packets that originate at the source and delivered at the destination. We include the energy consumed due to transmission and reception of data packets, MAC layer packets, beacon exchange and the energy consumed due to route discoveries.
4.5 Average Route Lifetime For all the simulation conditions (refer Figures 6.1 through 6.4), the average route lifetime incurred for NVSP is larger than that of DSR and smaller than that of FORP. In networks of high density, the average lifetime of NVSP routes is 60-65% of that incurred for FORP routes and is 50-75% larger than those incurred for DSR routes. In networks of low density, the average lifetime of NVSP routes is about 70% of that incurred for FORP routes and is 25-35% larger than those incurred for DSR routes. DSR routes are relatively more stable in networks low density. This is due to the Edge effect problem [24]: In networks of high density, DSR tends to choose minimum hop routes in such a way that the physical distance between the constituent nodes of a hop is about 80% of the transmission range of the nodes. As a result, the constituent nodes of the hop are likely to move away any time in the near future. For a given network density, there is no much change in the route lifetime as we increase the offered traffic load from low to high. For a given network density and offered traffic load, as the maximum node velocity is increased from 10 m/s to 50m/s, the percentage drop in the route lifetime is almost the same for the three routing protocols. The average route lifetime with maximum node velocity of 50 m/s is about 30-35% and 25-30% of the route lifetime incurred with maximum node velocity of 10 m/s in networks of high and low node densities respectively.
53
Volume 2 No. 1
ISSN 2079-8407
Journal of Emerging Trends in Computing and Information Sciences ©2010-11 CIS Journal. All rights reserved. http://www.cisjournal.org
4.6 Hop Count per Route For all the simulation conditions (refer Figures 7.1 through 7.4), DSR and NVSP incur average hop count per route close enough to each other. The average hop count for NVSP routes is about 4-6% and 7-8% more than that of the average hop count of DSR routes in networks of low and high densities respectively. In high-density
Figure 6.1: 100 Nodes and 30 s-d Pairs
Figure 6.2: 100 Nodes and 15 s-d Pairs
networks, DSR incurs a relatively slightly lower hop count due to the Edge effect. The average hop count of FORP routes is 20-25% more than that of the average hop count of NVSP routes in networks of low and high network densities. This is attributed to the tendency of FORP to choose routes with longer predicted lifetime; such routes
Figure 6.3: 50 Nodes and 30 s-d Pairs
Figure 6.4: 50 Nodes and 15 s-d Pairs
Figure 6: Route Lifetime for FORP, NVSP and DSR
Figure 7.1: 100 Nodes and 30 s-d Pairs
Figure 7.2: 100 Nodes and 15 s-d Pairs
Figure 7.3: 50 Nodes and 30 s-d Pairs
Figure 7.4: 50 Nodes and 15 s-d Pairs
Figure 7: Average Hop Count per Path for FORP, NVSP and DSR
Figure 8.1: 100 Nodes and 30 s-d Pairs
Figure 8.2: 100 Nodes and 15 s-d Pairs
Figure 8.3: 50 Nodes and 30 s-d Pairs
Figure 8.4: 50 Nodes and 15 s-d Pairs
Figure 8: Packet Delivery Ratio for FORP, NVSP and DSR
Figure 9.1: 100 Nodes and 30 s-d Pairs
Figure 9.2: 100 Nodes and 15 s-d Pairs
Figure 9.3: 50 Nodes and 30 s-d Pairs
Figure 9.4: 50 Nodes and 15 s-d Pairs
Figure 9: End-to-End Delay per Data Packet for FORP, NVSP and DSR
Figure 10.1: 100 Nodes and 30 s-d Pairs
Figure 10.2: 100 Nodes and 15 s-d Pairs
Figure 10.3: 50 Nodes and 30 s-d Pairs
Figure 10.4: 50 Nodes and 15 s-d Pairs
Figure 10: Energy Consumed per Data Packet for FORP, NVSP and DSR
54
Volume 2 No. 1
ISSN 2079-8407
Journal of Emerging Trends in Computing and Information Sciences ©2010-11 CIS Journal. All rights reserved. http://www.cisjournal.org
should have the constituent nodes of a hop close to each other. For a given network density, with increase in the offered traffic load from low to high, there is not much difference in the average hop count per route for each of the three routing protocols. For a given network density and offered traffic load, as the maximum node velocity is decreased from 50 m/s to 10 m/s, the increase in the average hop count per route is not very high (2-4% in low density networks and 7-8% in high-density networks).
node velocity of 10 m/s to a maximum node velocity of 50 m/s. For a given network density and lower offered traffic load, the increase in the end-to-end delay per data packet for FORP, DSR and NVSP is by factors of 1.3, 2.0-2.2 and 1.6-2.0 as node mobility is increased from a maximum node velocity of 10 m/s to a maximum node velocity of 50 m/s. For a given offered traffic load and given node mobility, with increase in node density, the end-to-end delay per data packet increases by a factor of 1.5-1.6, 1.31.4 and 1.6-1.7 for FORP, NVSP and DSR respectively.
4.7 Packet Delivery Ratio The packet delivery ratio (refer Figures 8.1 through 8.4) incurred by NVSP is almost equal to that of FORP under all of the simulation conditions, except the simulation condition of 100 nodes, 30 s-d pairs and maximum node velocity of 50 m/s, in which the packet delivery ratio of NVSP is 0.88 and that of FORP is 0.96. For the same simulation condition, the packet delivery ratio of DSR is only 0.61. Thus, NVSP is far better than DSR in terms of yielding a higher network throughput in extreme conditions of node mobility, node density and offered traffic load.
4.8 End-to-End Delay per Data Packet NVSP incurs the lowest end-to-end delay per data packet among the three routing protocols (refer Figures 9.1 through 9.4). In networks of low node mobility, the end-to-end delay per data packet for FORP is significantly higher than that incurred for NVSP and this is attributed to the relatively higher beacon exchange overhead compared to the route discovery overhead. In networks of high node mobility, the end-to-end delay per data packet incurred for FORP is still higher than that of NVSP, but there is a decrease in the magnitude of the difference between the delays incurred with FORP and NVSP. The decrease is attributed to the relatively higher route discovery overhead experienced by NVSP compared to that of FORP in networks of high mobility. The magnitude of the difference between the delays incurred with NVSP and DSR increases with increase in node mobility. This is attributed to the relatively higher route discovery overhead of DSR in networks of high node mobility. For a given network density and high offered traffic load, the end-to-end delay per data packet incurred for FORP and DSR is about 1.7-1.8 and 1.1-1.2 times respectively to that of NVSP in networks of low mobility and is about 1.3-1.5 and 1.1-1.3 times respectively to that of NVSP in networks of high mobility. For a given network density and low offered traffic load, the delay per data packet incurred for FORP and DSR is about 2-2.4 and 1.1-1.3 times respectively to that of NVSP in networks of low mobility and is about 1.3-1.6 and 1.1-1.4 times respectively to that of NVSP in networks of high mobility. For a given network density and high offered traffic load, the increase in the end-to-end delay per data packet for FORP, DSR and NVSP is by factors of 1.5, 2.2 and 2.0 as node mobility is increased from a maximum
4.9 Energy Consumed per Data Packet For all the simulation conditions (refer Figures 10.1 through 10.4), NVSP incurs the lowest energy consumed per data packet. For a given offered traffic load, in networks of high density, the energy consumed per delivered data packet for FORP is 1.2-1.3 times and 1.11.2 times to that of NVSP in networks of low and high node mobility respectively. For a given offered traffic load, in networks of low density, the energy consumed per delivered data packet for FORP is 1.1-1.2 times to that of NVSP in networks of low and high node mobility respectively. The higher energy consumption per data packet for FORP is attributed to the larger hop count per path. The energy consumed per delivered data packet is almost the same for DSR and NVSP, except that in conditions of high mobility, DSR incurs a higher energy consumption per delivered data packet due to the larger number of route discoveries.
5. DESIGN OF THE MULTICAST EXTENSION TO THE NVSP ROUTING PROTOCOL (NVSP-M) 5.1 Broadcast of Multicast Tree Request Messages Whenever a source node has data packets to send to a multicast group and is not aware of a multicast tree to the group, the source initiates a broadcast tree discovery procedure by broadcasting a Multicast Tree Request Message (MTRM) to its neighbors. The source maintains a monotonically increasing sequence number for the broadcast tree discoveries it initiates to form the multicast tree. Each node, including the receiver nodes of the multicast group, on receiving the first MTRM of the current broadcast process (i.e., a MTRM with a sequence number greater than those seen before), includes its Information Update Vector in the MTRM packet. The structure of the Information Update Vector (IUV-M) used by NVSP-M is shown in Figure 11. In addition to the fields indicating the Node ID and the current velocity of the node (as in Figure 1), the IUV-M has an Is Receiver flag, which if set indicates that the node is a receiving node of the multicast group. The structure of the MTRM packet for NVSP-M is shown in Figure 12.
55
Volume 2 No. 1
ISSN 2079-8407
Journal of Emerging Trends in Computing and Information Sciences ©2010-11 CIS Journal. All rights reserved. http://www.cisjournal.org
Figure 11: NVSP-M: Information Update Vector (IUV-M) Collected from Each Node Figure 13: Structure of the Multicast Tree Establishment Message (MTEM)
Figure 12: NVSP-M: Structure of the Multicast Tree Request Message (MTRM)
5.2 Construction of the Multicast Tree Paths constituting the multicast tree are independently chosen at each receiver node depending on the route selection principles of the corresponding protocol. The receiver selects the RREQ that traversed through the path that has the smallest bottleneck velocity. The bottleneck velocity of a path is the maximum of the velocities of the constituent intermediate nodes of the path. Once the path is decided, the IUV-M field in the corresponding RREQ message is used to construct the Multicast Tree Establishment Message (MTEM), shown in Figure 13. An intermediate node upon receiving the MTEM checks its multicast routing table for an entry of the in the table. The multicast routing table at a node is an ordered entry of pairs, where the key is the tuple and the value is the . Nodes constituting the list of upstream nodes and the list of downstream nodes are part of the multicast tree rooted at the source node for the multicast group. The intermediate node adds to the Downstream Nodes List, the ID of the node from which the MTEM was received and adds to the Upstream Nodes List, the ID of the node to which the MTEM has to be forwarded further according to the Route Record (the list of node IDs on the route) in the message. If an entry for the does not already exist in the routing table, the intermediate node creates a new entry and also initializes the Downstream Nodes List and the Upstream Nodes List respectively with the ID of the node from which the MTEM was received and the ID of the node to which the MTEM has to be forwarded further. Note that we assume a node can learn the Identification (ID) of a neighbor node that sent the MTEM through the underlying Medium Access Control (MAC) protocol [19]. After updating the multicast routing table, the intermediate node forwards the MTEM to the next upstream node on the path. The source node maintains a multicast routing table that has Downstream Nodes List for each of the multicast groups to which the source is currently communicating through a multicast session. For each MTEM received, the source adds the neighbor node that sent the MTEM to the Downstream Nodes List for the multicast group.
5.3 Multicast Tree Acquisition Time and Data Transmission The source waits to receive the MTEMs from all the receiver nodes within a certain time called the Tree Acquisition Time (TAT). The TAT is dynamically set at a node depending on the time it took to receive the first MTEM for a tree discovery procedure. If the source does not receive the MTEMs from all the receiver nodes of the group within the TAT, the source initiates another broadcast tree discovery procedure. If the source receives the MTEMs from all the receiver nodes within the TAT, then the source starts sending the data packets down the multicast tree.
5.4 Multicast Tree Maintenance If an intermediate node could not successfully forward the data packet to all of its downstream nodes in the multicast tree rooted at the source, the intermediate node generates and sends a Multicast Path Error Message (MPEM) to the source node of the multicast group. The MPEM (structure shown in Figure 14) is sent to all the upstream nodes of the intermediate node on the tree. The sequence number of the data packet that could not be successfully forwarded is recorded in the MPEM. The intermediate node removes the entry for the source and the multicast group from its routing table. Similarly, all the nodes that receive the MPEM remove the entry for the source and the multicast group from their routing table and forward the message towards the source. The source node, upon receiving the MPEM, will clear the entry for the multicast group in its routing table and launch a new broadcast tree discovery process.
Figure 14: Structure of the Multicast Path Error Message
6. PERFORMANCE COMPARISON SIMULATIONS OF NVSP-M AND BEMRP The network dimension used is a 1000m x 1000m square network. The transmission range of each node is assumed to be 250m. The number of nodes used in the network is 50. We compare the performance of NVSP-M with that of the link-efficient BEMRP protocol. We implemented both of these multicast routing protocols in
56
Volume 2 No. 1
ISSN 2079-8407
Journal of Emerging Trends in Computing and Information Sciences ©2010-11 CIS Journal. All rights reserved. http://www.cisjournal.org
our discrete-event simulator developed in Java. The broadcast tree discovery strategy used is flooding. The simulation time is 1000 seconds. We are not implementing any energy consumption model in our simulations. So, each node is assumed to have an infinite amount of energy and there are no node or link failures due to exhaustion of battery charge. The mobility model used is the Random Waypoint model [23] according to which the velocity of a node is uniform-randomly selected from [0…vmax]. The vmax values used in our simulations are 10 m/s, 30 m/s and 50 m/s, representing scenarios of low, moderate and high mobility with average node velocities of 5 m/s, 15 m/s and 25 m/s respectively. For each vmax value, we generated five mobility profiles of the nodes for the simulation time of 1000 seconds. Simulations are conducted with a multicast group size of 2 (small size), 4 (moderate size) and 8 (larger size) receiver nodes. For each group size, we generated five lists of receiver nodes and the simulations were conducted for each of these five lists with the five mobility profiles generated for each vmax value. The source node of the multicast session for each of the experiments is randomly selected and it is not counted as part of the multicast group size. The results reported in the performance Figures 15 through 18 for each multicast routing protocol are averages obtained from these 25 experiments for a given multicast group size and vmax value.
6.2 Percentage Network Connectivity As the multicast group size increases, we observe the percentage of network connectivity to decrease as it may not be possible to connect the source to all the receivers of the multicast group all the time. For a given multicast group size, the percentage of network connectivity is not much affected with increase of node mobility from low to high. For a given multicast group size, the difference in the percentage of connectivity values for different levels of node mobility is within 3%. Thus, with mobility, nodes are simply redistributed and the level of network connectivity is not much affected for a given multicast group size. With only one multicast session (involving at most 8 receivers in the multicast group) running in the network, the queues at the nodes are always available for packet forwarding and the packets are not dropped due to buffer overflow at the interface queues of the nodes. In such scenarios, the percentage network connectivity, represented as a fraction, also basically translates to the packet delivery ratio.
6.1 Performance Metrics The performance metrics evaluated through the simulations are the following: Percentage Network Connectivity: This is the ratio (expressed as percentage) of the number of time instants the source was able to successfully transmit the data packets to the multicast group to the total number of time instants the source attempted to transmit the data packets to the group. Lifetime per Tree: This is the average of the lifetimes of the sequence of multicast trees discovered by a routing protocol over the duration of the entire multicast session. Number of Edges per Tree: This is the time averaged number of edges in the multicast trees discovered and computed over the entire multicast session. The notion of “time-average” is explained as follows: Let there be multicast trees T1, T2, T3 with 5, 8 and 6 edges used for time 12, 6 and 15 seconds respectively, then the time averaged number of edges in the multicast trees is given by (5*12+8*6+6*15)/ (12+6+15) = 6 and not merely 6.33, which is the average of 5, 8 and 6. Hop Count per Source-Receiver Path: This is the time-averaged hop count of the paths from the source to each receiver of the multicast group and computed over the entire multicast session.
Figure 15: Percentage of Network Connectivity
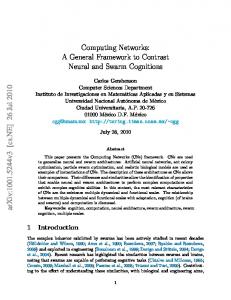
6.3 Lifetime per Multicast Tree For a given level of node mobility, the lifetime of NVSP-M trees is 25-30% and 10-15% more than the lifetime of the BEMRP trees for smaller and moderate multicast group sizes respectively. For larger multicast group size, the lifetime per tree for both BEMRP and NVSP-M are almost the same. For a given level of node mobility, the effectiveness of the bottleneck velocity based approach of NVSP-M in determining stable trees starts decreasing as the multicast group size increases. For a given multicast group size, as we increase the node mobility from low (vmax = 10 m/s) to moderate (vmax = 30 m/s) and to high (vmax = 50 m/s), the percentage decrease in the lifetime of the multicast trees for both the routing protocols is almost identical. The percentage decrease in the lifetime as we increase node mobility from low to high is around 65-75% and the percentage decrease in the lifetime as we increase node mobility from low to moderate is around 50-65%.
6.4 Number of Edges per Multicast Tree The number of edges per multicast tree (refer Figure 17) is an indicator of the effectiveness of the multicast routing protocol in utilizing the available bandwidth and energy resources at the nodes. The smaller the value of the number of edges per tree, the smaller will
57
Volume 2 No. 1
ISSN 2079-8407
Journal of Emerging Trends in Computing and Information Sciences ©2010-11 CIS Journal. All rights reserved. http://www.cisjournal.org
be the number of link transmissions when data is propagated down the multicast tree. The amount of energy consumed per multicast data packet sent from a source to all the receivers is directly proportional to the number of links in the tree. The performance results illustrated in Figures 16 and 17 indicate that there is a tradeoff between the lifetime per multicast tree and the number of edges per multicast tree. Until now, it has been thought that BEMRP can optimize both these metrics simultaneously. But, with NVSP-M, we have shown that it is possible to determine multicast trees of relatively very large lifetime, at least for smaller and medium sized multicast groups, compared to that of BEMRP, but such trees also incur a relatively larger number of links compared to that of BEMRP. With NVSP-M, each receiver is connected to the source through a path with the smallest bottleneck velocity and the number of links is not optimized. Whereas in the case of BEMRP, each receiver is joined to the tree in such a way
Figure 16.1: vmax = 10 m/s
that the total number of links added to the tree is minimized. The number of edges per multicast tree obtained for NVSP-M is about 15-30% more than that of BEMRP trees. For a given level of node mobility, with smaller multicast groups, the number of edges per multicast tree for M-NVSP is about 15% more than that of BEMRP trees. On the other hand, for moderate and larger multicast groups, the number of edges per multicast tree for NVSPM is 18-30% more than that of the BEMRP trees. As we add more receivers to the multicast group, the impact of the routing principles of the multicast protocol on the number of links per tree is more evident. For a given multicast group size, as we increase the level of node mobility from low to moderate and to high, we do not notice any significant change in the number of edges per multicast tree.
Figure 16.2: vmax = 30 m/s
Figure 16.3: vmax = 50 m/s
Figure 16: Lifetime per Multicast Tree for NVSP-M and BEMRP
Figure 17.1: vmax = 10 m/s
Figure 17.2: vmax = 30 m/s
Figure 17.3: vmax = 50 m/s
Figure 17: Number of Edges per Multicast Tree for NVSP-M and BEMRP
Figure 18.1: vmax = 10 m/s
Figure 18.2: vmax = 30 m/s
Figure 18.3: vmax = 50 m/s
Figure 18: Average Hop Count per Source-Receiver Path for NVSP-M and BEMRP
6.5 Average Hop Count per Source-Receiver Path The average hop count per source-receiver path (refer Figure 18) is an indicator of the amount of delay suffered by the multicast data packets to reach a specific receiver node. The smaller the number of hops per path from the source to the receiver, the smaller will be the
delay suffered by the data packets. From the performance data illustrated in Figures 16, 17 and 18, it is evident that there is a tradeoff between the hop count per sourcereceiver path, lifetime of the multicast trees and the number of links per tree. Neither of the two protocols can simultaneously yield the best value for all the three metrics.
58
Volume 2 No. 1
ISSN 2079-8407
Journal of Emerging Trends in Computing and Information Sciences ©2010-11 CIS Journal. All rights reserved. http://www.cisjournal.org
The NVSP-M protocol determines trees that have the smallest value for the hop count per source-receiver path. In pursuit of selecting paths with the minimum bottleneck velocity, the NVSP-M protocol attempts to choose routes that have the minimum number of intermediate nodes on the source-receiver paths. Since the receiver nodes are free to choose their own path to connect to the source as part of the multicast tree, the NVSP-M protocol incurs a lower hop count per source-receiver path. For a given multicast group size, the hop count per source-receiver path for BEMRP trees is about 10% (at low and moderate node velocities) and 15-20% (at high node velocities) more than that of NVSP-M. For a given level of node mobility, as we change the multicast group size, the difference in the average hop count per source-receiver path incurred by a particular multicast routing protocol is not much and is usually within 5%. Similarly, for a given multicast group size, as we increase the level of node mobility from low to moderate and to high, there is no significant difference in the average hop count per source-receiver path incurred by a particular multicast routing protocol.
7. CONCLUSIONS AND FUTURE WORK The high-level contribution of this paper is the design and development of a novel beaconless node velocity-based stable path routing protocol for unicasting (NVSP) and multicasting (NVSP-M) in mobile ad hoc networks (MANETs). The average route lifetime of NVSP routes is 60-70% of the lifetime of routes chosen by FORP – the stable path routing protocol that yields the sequence of most stable routes. The average route lifetime of NVSP routes is 25-35% (in low density networks) and 50-75% (in high density networks) more than the lifetime of DSR routes. At the same time, NVSP incurs the lowest end-toend delay per data packet and the lowest energy consumed per data packet compared to both FORP and DSR. The packet delivery ratio incurred with NVSP is typically equal or higher than that of DSR and is almost equal to that incurred by FORP. The average hop count of NVSP routes is more than that of DSR routes only by 4-8%. NVSP is the first stable path routing protocol that does not use beacons to determine routes. The multicast extension of NVSP, NVSP-M, determines a sequence of stable long-living multicast trees. It has been compared with that of the BEMRP protocol that has been observed so far to simultaneously optimize the number of links per tree as well as the lifetime per multicast tree. Through this paper, we discover a tradeoff between the lifetime per multicast tree as well as the number of links per tree. We show that with NVSP-M, we can determine multicast trees that have a significantly larger lifetime than that of BEMRP trees, at least for networks involving multicast groups of smaller and moderate size, but the tradeoff is that the number of links per NVSP-M tree can be at most 30% higher than
that of BEMRP trees. In other words, we show that it is possible to determine trees of a relatively larger lifetime at the expense of energy consumption and bandwidth. NVSP-M trees incur the smallest value for the average hop count per source-receiver path; the BEMRP trees incur a hop count that is at most 20% more than that incurred by NVSP-M trees. To summarize, NVSP-M can be preferred when we aim to simultaneously maximize the tree lifetime as well as minimize the hop count per sourcereceiver path. In [15], it has been shown that BEMRP outperforms the minimum-hop based Multicast Ad hoc On-Demand Distance Vector (MAODV) [16] routing protocol and the stability-oriented Associativity-Based Ad hoc Multicast (ABAM) [17] protocol with respect to the tree lifetime, hop count per source-receiver path and the number of links per tree. Hence, it is logical to conclude that NVSP-M yields trees of larger lifetime than that of MAODV and ABAM. We conjecture that the stability of NVSP routes could be further improved if the links discovered through the route discovery process involve only slow moving nodes. We will pursue this idea to further improve the stability of NVSP routes and at the same time ensure that NVSP continues to yield routes with lower end-to-end delay and energy consumed per data packet. In future, we will also present a detailed simulation based comparison of all of the four multicast routing protocols (NVSP-M, BEMRP, MAODV and ABAM) for different conditions of network density, node mobility and multicast group size.
ACKNOLWEDGMENTS The research on the multicast extension of the NVSP protocol (NVSP-M) was supported through the U. S. National Science Foundation grant (CNS-0851646) entitled: “REU Site: Undergraduate Research Program in Wireless Ad hoc Networks and Sensor Networks,” hosted by the Computer Science Department at Jackson State University. The research work on NVSP-M was conducted by the undergraduate student co-authors under the mentorship of the first author who designed both the unicast and multicast protocols. The authors also acknowledge L. Moore, X. Liang, B. Johnson and B. Olagbegi for their services to the REU 2009 program.
REFERENCES [1] D. Broch, D. A. Maltz, D. B. Johnson, Y-C. Hu and J. Jetcheva, “A Performance Comparison of Multi-hop Wireless Ad hoc Network Routing Protocols,” Proceedings of the 4th Annual ACM/IEEE International Conference on Mobile Computing and Networking, pp. 85 – 97, October 1998. [2] P. Johansson, T. Larsson, N. Hedman, B. Mielczarek and M. Degermark, “Scenario-based Performance Analysis of Routing Protocols for Mobile Ad hoc
59
Volume 2 No. 1
ISSN 2079-8407
Journal of Emerging Trends in Computing and Information Sciences ©2010-11 CIS Journal. All rights reserved. http://www.cisjournal.org
Networks,” Proceedings of the 5th Annual International Conference on Mobile Computing and Networking, pp. 195 – 206, August 1999.
[3] N. Meghanathan, “Survey and Taxonomy of Unicast Routing Protocols for Mobile Ad Hoc Networks,” International Journal on Applications of Graph Theory in Wireless Ad hoc Networks and Sensor Networks, vol. 1, no. 1, pp. 1 – 21, December 2009. [4] D. B. Johnson, D. A. Maltz and J. Broch, “DSR: The Dynamic Source Routing Protocol for Multi-hop Wireless Ad hoc Networks,” in Ad hoc Networking, Chapter 5, C. E. Perkins, Eds. Addison Wesley, pp. 139 – 172, 2000. [5] C. E. Perkins and E. M. Royer, “Ad hoc On-demand Distance Vector Routing,” in Proceedings of the 2nd Annual IEEE International Workshop on Mobile Computing Systems and Applications, pp. 90 – 100, February 1999. [6]
C. E. Perkins and P. Bhagwat, “Highly Dynamic Destination Sequenced Distance Vector Routing for Mobile Computers,” ACM SIGCOMM, pp. 234 – 244, October 1994.
[7] N. Meghanathan, “A Simulation Study on the Stability-Oriented Routing Protocols for Mobile Ad hoc Networks,” Proceedings of the 2006 IFIP International Conference on Wireless and Optical Communications Networks, April 2006. [8] C-K. Toh, “Associativity-Based Routing for Ad hoc Mobile Networks,” IEEE Personal Communications, vol. 4, no. 2, pp. 103 – 139, March 1997. [9] W. Su and M. Gerla, “IPv6 Flow Handoff in Ad hoc Wireless Networks using Mobility Prediction,” Proceedings of the IEEE Global Telecommunications Conference, pp. 271 – 275, December 1999. [10] S. Agarwal, A. Ahuja, J. P. Singh and R. Shorey, “Route-Life Time Assessment Based Routing Protocol for Mobile Ad Hoc Networks,” in Proceedings of IEEE International Conference on Communications, pp. 1697 – 1701, June 2000. [11] N. Meghanathan, “Stability-Energy Consumption Tradeoff among Mobile Ad hoc Network Routing Protocols,” Proceedings of the Third International Conference on Wireless and Mobile Communications, March 2007. [12] N. Meghanathan, “Exploring the Stability-Energy Consumption-Delay-Network Lifetime Tradeoff of Mobile Ad Hoc Network Routing Protocols,”
Academy Publisher Journal of Networks, vol. 3, no. 2, pp. 17 – 28, February 2008. [13] C. S. R. Murthy and B. S. Manoj, “Ad Hoc Wireless Networks: Architectures and Protocols,” Prentice Hall, June 3, 2004. [14] T. Ozaki, B. K. Jaime and T. Suda, “BandwidthEfficient Multicast Routing Protocol for Ad hoc Networks,” in Proceedings of the 8th International Conference on Computer Communications and Networks, pp. 10 – 17, 1999. [15] N. Meghanathan, “Stability and Link Efficiency of On-Demand Source Tree-based Routing Protocols for Mobile Ad hoc Networks,” Proceedings of the International Conference on High Performance Computing, Networking and Communication Systems, pp. 159-166, July 2008. [16] E. M. Royer and C. E. Perkins, “Multicast Operation of the Ad hoc On-demand Distance Vector Routing Protocol,” in Proceedings of the 5th Annual ACM/IEEE Conference on Mobile Computing and Networking, pp. 207 – 218, August 1999. [17] C. K. Toh, G. Guichal and S. Bunchua, “ABAM: Ondemand Associatvity-based Multicast Routing for Ad hoc Mobile Networks,” in Proceedings of the 52nd IEEE VTS Fall Vehicular Technology Conference, vol. 3, pp. 987 – 993, September 2000. [18] B. Hofmann-Wellenhof, H. Lichtenegger and J. Collins, Global Positioning System: Theory and Practice, 5th rev. ed., Springer, September 2004. [19] G. Bianchi, “Performance Analysis of the IEEE 802.11 Distributed Coordination Function,” IEEE Journal of Selected Areas in Communication, vol. 18, no. 3, pp. 535-547, March 2000. [20] D. Kim, J. J. Garcia-Luna-Aceves, K. Obraczka, J-C. Cano and P. Manzoni, “Routing Mechanisms for Mobile Ad hoc Networks based on the Energy Drain Rate,” IEEE Transactions on Mobile Computing, vol. 2, no. 2, pp. 161-173, April-June 2003. [21] L. M. Feeney, “An Energy Consumption Model for Performance Analysis of Routing Protocols for Mobile Ad hoc Networks,” Journal of Mobile Networks and Applications, Vol. 3, No. 6, pp. 239249, June 2001. [22] N. Meghanathan and A. Farago, “Comparison of Routing Strategies for Minimizing Energy Consumption in Mobile Ad hoc Networks,”
60
Volume 2 No. 1
ISSN 2079-8407
Journal of Emerging Trends in Computing and Information Sciences ©2010-11 CIS Journal. All rights reserved. http://www.cisjournal.org
Proceedings of the 4th Asian International Mobile Computing Conference, January 2006.
[23] C. Bettstetter, H. Hartenstein and X. Perez-Costa, “Stochastic Properties of the Random-Way Point Mobility Model,” Wireless Networks, pp. 555 – 567, vol. 10, no. 5, September 2004.
[24] G. Lim, K. Shin, S. Lee, H. Yoon and J. S. Ma, “Link Stability and Route Lifetime in Ad hoc Wireless Networks,” in Proc. Int. Conf. on Parallel Processing Workshops, pp. 116–123, August 2002.
61