International Journal of Signal Processing, Image Processing and Pattern Recognition Vol.8, No.3 (2015), pp.87-96 http://dx.doi.org/10.14257/ijsip.2015.8.3.08
The Use of Dual-Tree Complex Wavelet Transform (DTCWT) Based Feature for Mammogram Classification Lowis1, Hendra2 and Lavinia3 1,2,3 Magister Information Technology Department, Graduate Program, Bina Nusantara University. Jl Kebon Jeruk Raya No 27, Kebon Jeruk, Jakarta Barat 11480, Indonesia,
[email protected] [email protected] Abstract Early detection of cancer is the best method to increase the chances of survival. In early stage, cancer can be detected using mammography, fine needle aspirate, and surgical biopsy. In this study, we propose the use of Dual-Tree Complex Wavelet Transform (DTCWT) based feature with neural network classifier for mammography image analysis. The result is evaluated using specificity, sensitivity, and accuracy. Computational experiments show the proposed method is superior compare to DWT with 96.3% accuracy. Keywords: mammography; DTCWT; DWT; neural network; specificity; sensitivity; accuracy
1. Introduction Based on American Cancer Society, breast cancer is a major health problem and the second most common mortality causes among women in the world. In 2013, there was 40.030 mortality cases (39.620 cases for women and 410 cases for men). American Cancer Society estimating about 40.290 women in the United States will die because of breast cancer in 2015 [1] . Early detection of the cancer is the best method to increase the chances of survival. Early stage detection and better treatment also enhance the 5-year relative survival rate for all cancers diagnosed between 2002 and 2008 up to 68% [2] . Currently, mammography, fine needle aspirate, and surgical biopsy are the common method to diagnose breast cancer. Mammography method reported has 70-90% sensitivity [3] . While fine needle aspirate (cancer detection by extracting fluids from a breast lump and inspecting it under microscope) has 65-98% sensitivity [4]. Surgical biopsy is the only test that can confirm malignancy, but this method is avoided because of the high cost. Machine learning algorithms is expected can enhance the performance of mammogram analysis and decrease the use of surgical biopsy for cancer detection [5] . Overall, the goal of automated mammogram image classification is to provide support in the decision making process of the radiologist [6] . Most mammogram image classification done by detecting abnormal structure of micro calcification [7], [8], [9] . Micro calcification is a small collection of calcium which relate to additional cell activity in breast tissue. Micro calcification can be seen in clusters or patterns. The dense cluster of micro calcification indicate early symptoms of breast cancer and separate micro calcification usually indicates benign breast cancer [7] . In mammogram classification, tissue diagnosis are classified in three categories: normal (representing a mammogram without cancer cells), benign (representing a mammogram that showed a tumor, but not cancer cells), and malignant (tumor represents a cancer cell) [10].
ISSN: 2005-4254 IJSIP Copyright ⓒ 2015 SERSC
International Journal of Signal Processing, Image Processing and Pattern Recognition Vol.8, No.3 (2015)
The study about mammogram image classification has been done by many researchers. Jasmine, Govardhan, and Baskaran propose a method for detecting a micro calcification in digital mammograms using wavelet analysis by applying a combination of artificial neural network (ANN) for the classifier. Neural network that used in their study consists of 1 input, 2 hiddens, and 1 output. Their research was conducted by using a dataset Mammography Image Analysis Society (MIAS) with accuracy approaching 87% [8] . Balakumaran, Vennila, and Gowrishankar use 100 mammogram images from Digital Database for Screening Mammography (DDSM) to detect micro calcification using DWT. The best result of their method are micro calcification detection with 96% accuracy [11]. Shaji, Purushothaman, and Rajeswari used wavelet transform and back propagation neural network to identify micro calcification in mammogram image. The identification result was above 96.2% but it depends on the quality of mammogram images [12] . Nithya and Santhi using Digital Database for Screening Mammography (DDSM) to classify mammogram images using pixel intensity mean features and artificial neural network for classification. This experiment conclude that pixel intensity mean features improve the classification with 98% accuracy [13] . Ganesan, et al, compare the feature analysis discrete wavelet transform (DWT) and spherical wavelet transform (SWT) in the digital image analyzing mammograms to detect breast cancer. Classification is done by using linear discriminant classifier (LDC), quadratic discriminant classifier (QDC), nearest mean classifier (NMC), support vector machine (SVM), and parzen classifier (ParzenC). Maximum results obtained with an accuracy between 81.73% and 88.80% for DWT and SWT with the SVM classifier [14] . V. Alarcon-Aquino, et al, use mammography image analysis society (MIAS) database and implement dual tree complex wavelet transform (DTCWT) to detect micro calcification in digital mammogram. The result show a 66.6% detection rate for DTCWT, 34% detection rate for SWT, and 20% detection rate for top-hat filtering [15] . Singh, et al, used dual tree complex wavelet transform (DTCWT) on normal and blurred image datasets for multimodal medical image fusion and compare it to discrete wavelet transform (DWT). They compare 𝐹 those method by calculated the values of performance matrix (𝑄𝐴𝐵 ) and mutual information (MI) for normal and blurred images. The result was fusion method using DTCWT better than 𝐹 DWT where the 𝑄𝐴𝐵 value of DTCWT 0.04-0.05 points higher than DWT and MI value of DTCWT 0.02-0.4 points higher than DWT [16] . Based on the previous studies, in this paper we use DTCWT based feature and neural network classifier to classify mammogram images from mammography image analysis society (MIAS) database. The performance will be assessed by comparing it with DWT feature extraction. The feature that extracted are mean, variance, entropy, and energy. The proposed method will be evaluated using specificity, sensitivity, and accuracy. This paper is organized as follows. Section 2 presents the material and method to conduct this experiment, section 3 describes and discuss the result of this experiment, and section 4 gives the conclusion from this study.
2. Material and Method 2.1. Mammogram Database This study is made by using Mammographic Image Analysis Society (MIAS) databases that arranged by John Suckling. The database consists of 322 images. Each image is 1024 × 1024 pixels. Mammogram images in MIAS database does not need image enhancement because it is already 8-bit gray level (the maximum level of gray used on each mammogram is 255 or less). If the gray level is 255, the result of the division is proportional to 1 and the
88
Copyright ⓒ 2015 SERSC
International Journal of Signal Processing, Image Processing and Pattern Recognition Vol.8, No.3 (2015)
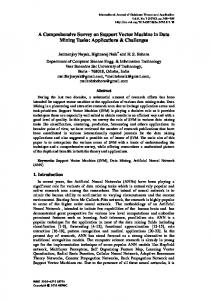
results are similar with the original image and don’t needs the gray scale normalization algorithm [5] . 2.2. Classification Framework Mammogram classification was done in two stages. The stages are feature extraction and classification. In feature extraction stage, mean, variance, entropy, and energy feature on the mammogram image was taken and analyzed using DWT and DTCWT. The result of feature extraction of these two methods will be used in the classification stage. In classification stage, two neural network classifiers are used. The first neural network is used to classify the mammogram images into normal and abnormal and the second neural network is used to classify the abnormal mammogram images from the first neural network into benign and malignant. The summarization of these stages can be seen in Figure 1. Input Image
Crop Image
Feature Extraction
DWT
DTCWT
Classification Neural Network1
Neural Network2
Normal
Abnormal
Benign Malignant
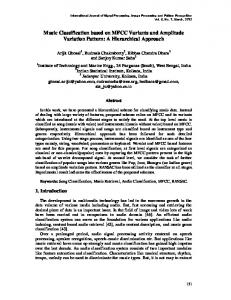
Figure 1. Classification Framework 2.2.1. Crop Image: We analyzed all micro calcification from MIAS and conclude that normal, benign, and malignat image have different histogram. The common histogram shape can be seen in Figure 2. Before feature extraction, the images from Mammographic Image Analysis Society (MIAS) databases is cropped into 128×128 pixel based on the micro calcification information from MIAS, but we move the position a little bit based on the histogram image in Figure 2.
Figure 2. Histogram for Normal, Malignant, and Benign Image
Copyright ⓒ 2015 SERSC
89
International Journal of Signal Processing, Image Processing and Pattern Recognition Vol.8, No.3 (2015)
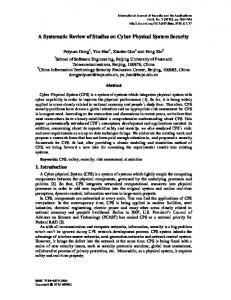
2.2.2. Discrete Wavelet Transform (DWT): The discrete wavelet transform (DWT) estimate signal by using the basic mathematical functions. The formula of continuous wavelet transform (CWT) for the function f using a wavelet basis function is [17] : 𝑓(𝑎, 𝑏) = ∫ 𝑓(𝑥)𝜓𝑎,𝑏 (𝑥)𝑑𝑥 (1) 𝜓(𝑥) is the main function of the wavelet. Wavelet basis functions obtained by changing the scale and shift the main functions of the wavelet signal [17] . 1 𝑥−𝑏 𝜓𝑎,𝑏 (𝑥) = 𝑎 𝜓 ( 𝑎 ) ; 𝑎 > 0 (2) √ a is a scale factor and b is the value of the shift. The mother wavelet only meet the conditions of zero average (for example,∫ 𝜓(𝑥)𝑑𝑥 = 0). DWT use 𝑎 = 2 and 𝑏 ∈ 𝑍. For 2D signal case (for example, image), two 1D basis functions as shown in the following equation resulted 2D analysis [17]: 𝜓𝑎1,𝑏1,𝑎2,𝑏2 (𝑥1 , 𝑥2 ) = 𝜓𝑎1,𝑏1 (𝑥1 ). 𝜓𝑎2,𝑏2 (𝑥2 ) (3) Multiresolution signal decomposition splits the signal into four subbands (low frequency components and high frequency components). A low-resolution approach is the original image. The coefficients for horizontal approach H, vertical V, and diagonal direction D is the detail. The multilevel decomposition can repeat the decomposition process. Important information that represents the structure of the original data obtains by using wavelets decomposition. Wavelet can capture the texture and information efficiently [17] . DWT is used effectively for image extractions features in some literatures [9], [18], [19].
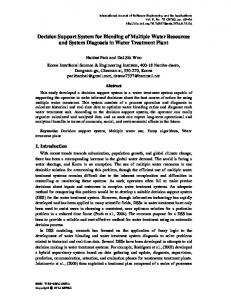
Figure 3. Discrete Wavelet Transform (DWT) [18] 2.2.3. Dual-Tree Complex Wavelet Transform (DTCWT): If the case involve higherdimensional, geometric data (for example geophysics and imaging), DWT has proven disappointing result. Because of that, DTCWT was made as DWT improvement. The basic idea of the dual-tree CWT is in this method two real DWTs is used. The first DWT gives the real part of the transform and the second DWT gives the imaginary part [18]. See Figure 3 and 4 to get a clear understanding for DWT and DTCWT tree. Generally, DT-CWT contains shift insensibility (DT-CWT reconstructed the detail of the last level has similar shifting like the original signal which allow successful results in motion estimation on image and image fusion despite the resolution level difference), directionality (DT-CWT has three directions each for real part and imaginary part oriented at ±15°, ±45°, and ±75° for image case), phase information (DT-CWT has two parallel tree which can compute real and imaginary part for each level. The one-dimensional complex wavelet is the combination of real and imaginary wavelet in quadrature), reconstruction (DT-CWT can reach perfect reconstruction condition), and redudancy (DT-CWT has 2: 1 or 2 𝐽 : 1 redudancy where J indicates the maximum level of decomposition) [15].
90
Copyright ⓒ 2015 SERSC
International Journal of Signal Processing, Image Processing and Pattern Recognition Vol.8, No.3 (2015)
Figure 4. Dual-Tree Complex Wavelet Transform (DTCWT) [18] 2.2.4. Statistical Feature Calculation: In this paper four statistical features are extracted from the LL band of wavelet transform. The features are mean, variance, entropy, and energy. Mean estimates the value in the image in which central clustering occurs. The formula for calculate mean [7]: 1 𝑁 𝜇 = 𝑀𝑁 ∑𝑀 (4) 𝑖=1 ∑𝑗=1 𝑝(𝑖, 𝑗) Variance is the square root of standard deviation and a measure of how far a set of numbers is spread out. It is one of several descriptors of a probability distribution, describing how far the numbers lie from the mean (expected value) [7]. 𝑣𝑎𝑟𝑖𝑎𝑛𝑐𝑒 = ∑𝑖 ∑𝑗(𝑖 − 𝑗)2 𝑝(𝑖, 𝑗) (5) Entropy is a random statistical measurement to characterize the texture of the input image. 𝑒𝑛𝑡𝑟𝑜𝑝𝑦 = −𝑠𝑢𝑚(𝑝.∗ 𝑙𝑜𝑔2(𝑝)) (6) p is the histogram counts returned from imhist. Energy has range between 0 and 1. The energy for constant image is 1. Energy also known as uniformity of ASM (angular second moment) [7]. 2.2.5. Artificial Neural Network (ANN): The effectiveness of artificial neural network in medical image processing have been proven [19] and has been used to detect cancer in digital mammography [17], [20] . ANN is used to classify mammograms. In the training phase, the wavelet coefficients are used for network input pattern. The training process was done until the expected level of classification achieved. In the test phase, the module uses a collection of mammogram images to evaluate the system. Total output node in the module depends on the level of neural network classification system [17]. In this paper, the system has four inputs (mean, variance, entropy, and energy), one hidden layer, and ten neurons. The architecture of a neural network can be seen in Figure 5. Input neurons provide a place where input values can be presented to the network. Hidden (sigmoid) neurons provide the network with the ability to perform calculations. Output neurons provide a place from which network output values can be read [7]. The output of neural network 1 is normal or abnormal and the output of neural network 2 is benign or malignant.
Copyright ⓒ 2015 SERSC
91
International Journal of Signal Processing, Image Processing and Pattern Recognition Vol.8, No.3 (2015)
Figure 5. Architecture of Neural Network [7] 2.2.6. Sensitivity and Specificity: The evaluation of the proposed method is calculated by two parameters (specificity and sensitivity) with below equation 𝑇𝑁 𝑇𝑃 𝑆𝑝𝑒𝑐𝑖𝑓𝑖𝑐𝑖𝑡𝑦 = , 𝑆𝑒𝑛𝑠𝑖𝑡𝑖𝑣𝑖𝑡𝑦 = (7) 𝑇𝑁+𝐹𝑃 𝑇𝑃+𝐹𝑁 TP is the number of true positive, TN is the number of true negative, FP is the number of false positives, and FN is the number of false negative. High specificity means that some cases will get unnecessary biopsy. High sensitivity show how many cancers missed. Sensitivity is the most important parameter because the errors are life-threatening [17].
3. Result and Discussion 3.1. Result There are two models in this experiment. The first model is neural network 1 which classify the mammogram images into normal and abnormal. The second model is neural network 2 which classify the abnormal mammogram result from neural network 1 into benign and malignant. The result has four categories: True Positive (TP), True Negative (TN), False Positive (FP), and False Negative (FN). For the abnormal and normal classification, TP means the actual is abnormal and the prediction is abnormal. TN means actual is normal and the prediction is normal. FP means actual is normal and the prediction is abnormal. FN means actual is abnormal and the prediction is normal. For the malignant and benign classification, TP means the actual is malignant and the prediction is malignant. TN means actual is benign and the prediction is benign. FP means actual is benign and the prediction is malignant. FN means actual is malignant and the prediction is benign. First, mammogram images are classified by using DWT feature extraction method. The input data for the neural network 1 to classify normal and abnormal are 322 mammogram images which contain 115 abnormal images and 207 normal images. The neural network divide the 322 images into 226 images for training (80 abnormal images and 146 normal images), 64 images for validation (25 abnormal images and 39 normal images), and 32 images for testing (10 abnormal images and 22 normal images). The classification result of DWT neural network 1 can be seen in Table 1. Table 1. DWT Confusion Matrix (Normal and Abnormal) Value TP TN FP FN
92
Training Data 78 146 0 2
Validation Data 25 39 0 0
Testing Data 9 22 0 1
All Data 112 207 0 3
Copyright ⓒ 2015 SERSC
International Journal of Signal Processing, Image Processing and Pattern Recognition Vol.8, No.3 (2015)
Specificity Sensitivity Accuracy
1 0.975 99.1%
1 1 100%
1 0.9 96.9%
1 0.974 99.1%
In the neural network 2, the focus is on the true positive from the training in neural network 1. So, the inputs for neural network 2 are 78 mammogram images which contain 44 malignant images and 34 benign images. The neural network divide the 78 images into 54 images for training (32 malignant images and 22 benign images), 16 images for validation (8 malignant images and 8 benign images), and 8 images for testing (4 malignant images and 4 benign images). The classification result of DWT neural network 2 can be seen in Table 2. Table 2. DWT Confusion Matrix (Benign and Malignant) Value TP TN FP FN Specificity Sensitivity Accuracy
Training Data 32 20 2 0 0.909 1 96.3%
Validation Data 8 6 2 0 0.75 1 87.5%
Testing Data 4 4 0 0 1 1 100%
All Data 44 30 4 0 0.882 1 94.9%
Next, mammogram images are classified by using DTCWT feature extraction method. The input data for the neural network 1 to classify normal and abnormal are 322 mammogram images which contain 111 abnormal images and 211 normal images. The neural network divide the 322 images into 226 images for training (80 abnormal images and 146 normal images), 64 images for validation (21 abnormal images and 43 normal images), and 32 images for testing (10 abnormal images and 22 normal images). The classification result of DTCWT neural network 1 can be seen in Table 3. Table 3. DTCWT Confusion Matrix (Normal and Abnormal) Value TP TN FP FN Specificity Sensitivity Accuracy
Training Data 76 146 0 4 1 0.95 98.2%
Validation Data 20 42 1 1 0.977 0.952 96.9%
Testing Data 9 22 0 1 1 0.9 96.9%
All Data 105 210 1 6 0.995 0.946 97.8%
In the neural network 2, the focus is on the true positive from the training in neural network 1. So, the inputs for neural network 2 are 80 mammogram images which contain 45 malignant images and 35 benign images. The neural network divide the 80 images into 56 images for training (29 malignant images and 27 benign images), 16 images for validation (11 malignant images and 5 benign images), and 8 images for testing (5 malignant images and 3 benign images). The classification result of DTCWT neural network 2 can be seen in Table 2. Table 4. DTCWT Confusion Matrix (Benign and Malignant) Value TP
Copyright ⓒ 2015 SERSC
Training Data 29
Validation Data 11
Testing Data 5
All Data 45
93
International Journal of Signal Processing, Image Processing and Pattern Recognition Vol.8, No.3 (2015)
TN FP FN Specificity Sensitivity Accuracy
26 1 0 0.963 1 98.2%
4 1 0 0.8 1 93.8%
2 1 0 0.667 1 87.5%
32 3 0 0.914 1 96.3%
3.2. Discussion As described in section 2, sensitivity show how many mammogram images classified correctly as abnormal in neural network 1 and show how many abnormal mammogram images classify correctly as malignant in neural network 2. The sensitivity rate is the most important because it decides whether the patient has cancer and needs further treatment. If an abnormal image detected as normal or malignant image detected as benign and there is no further action. It’s possible the cancer spread and detected in high stadium or even takes the patient’s life. Computational experiments show the propose method is superior compare to DWT. The summary of the result can be seen in Table 5. Table 5. Comparison of Mammogram Classification Description DWT (normal and abnormal) DWT (benign and malignant) DTCWT (normal and abnormal) DTCWT (benign and malignant)
Specificity 1
Sensitivity 0.974
Accuracy 99.1%
0.882
1
94.9%
0.995
0.946
97.8%
0.914
1
96.3%
4. Conclusion In conclusion, our proposed method for mammogram classification can classify mammogram images with a good result. Computational experiments show DTCWT is superior compare to DWT with 96.3% accuracy.
Acknowledgements This study is the final project of Selected Topics in Computational Intelligence II course. We would like to give special thanks to Mr. Diaz D. Santika, Ir., M.Sc., Dr for his guidance during the course so we can finish this study.
References [1] American Cancer Society. (2014, Desember) What are the key statistics about breast cancer? [Online]. http://www.cancer.org/cancer/breastcancer/detailedguide/breast-cancer-key-statistics [2] American Cancer Society. (2013) Cancer Facts & Figures 2013. [Online]. http://www.cancer.org/acs/groups/content/@epidemiologysurveilance/documents/document/acspc036845.pdf [3] Aneesa S. Majid et al., "Missed Breast Carcinoma: Pitfalls and Pearls," RadioGraphics, vol. 23, pp. 881895, 2003. [4] Olvi L. Mangasarian, W. Nick Street, and William H. Wolberg, "Breast cancer diagnosis and prognosis via
94
Copyright ⓒ 2015 SERSC
International Journal of Signal Processing, Image Processing and Pattern Recognition Vol.8, No.3 (2015)
linear programming," OPERATIONS RESEARCH, vol. 43, no. 4, pp. 570-577, 1995. [5] Ayman A. AbuBaker, R.S.Qahwaji, Musbah J.Aqel, Hussam Al-Osta, and Mohmmad H.Saleh, "Efficient Pre-processing of USF and MIAS Mammogram Images," Journal of Computer Science, vol. 3, no. 2, pp. 67-75, 2006. [6] Ivan Kitanovski, Blagojce Jankulovski, Ivica Dimitrovski, and Suzana Loskovska, "Comparison of Feature Extraction Algorithms for Mammography Images," Image and Signal Processing (CISP), 2011 4th International Congress, vol. 2, pp. 888-892, October 2011. [7] J. Subash Chandra Bose, K. R. Shankar Kumar, and M. Karnan, "Detection of Microcalcification in Mammograms using Soft Computing Techniques," European Journal of Scientific Research, vol. 86, no. 1, pp. 103-122, September 2012. [8] J.S.L. Jasmine, A. Govardhan, and S. Baskaran, "Microcalcification Detection in Digital Mammograms based on Wavelet Analysis and Neural Networks," Control, Automation, Communication and Energy Conservation, 2009. INCACEC 2009. 2009 International Conference, pp. 1-6, Juni 2009. [9] H. D. Cheng, X. Cai, X. Chen, L. Hu, and X. Lou, "Computer-aided Detection and Classification of Microcalcifications in Mammograms: A Survey," Pat. Rec, vol. 36, pp. 2967-2991, 2003. [10] Brijesh Verma and John Zakos, "A Computer-Aided Diagnosis System for Digital Mammograms Based on Fuzzy-Neural and Feature Extraction Techniques," IEEE Transaction on Information Technology in Biomedicine, vol. 5, no. 1, pp. 46-54, Maret 2001. [11] T. Balakumaran, Ila.Vennila, and C. Gowrishankar, "Detection of Microcalcification in Digital Mammograms using One Dimensional Wavelet Transform," ICT ACT Journal on Image and Video Processing, no. 2, pp. 99-104, November 2010. [12] B. Shaji, S. Purushothaman, and R. Rajeswari. (2013, September) Implementation of Wavelet Transform and Back Propagation Neural Network for Identification of Microcalcification in Breast. [Online]. http://www.ciitresearch.org/dl/index.php/dmke/article/view/DMKE092013005 [13] R. Nithya and B. Santhi, "Mammogram Analysis Based on Pixel Intensity Mean Features," Journal of Computer Science, vol. 8, no. 3, pp. 329-332, 2012. [14] Karthikeyan Ganesan, U. Rajendra Acharya, Chua Kuang Chua, Lim Choo Min, and Thomas K. Abraham, "Automated Diagnosis of Mammogram Images of Breast Cancer Using Discrete Wavelet Transform and Spherical Wavelet Transform Features: A Comparative Study," Technology in Cancer Research and Treatment, vol. 13, no. 6, pp. 605-615, Desember 2014. [15] V. Alarcon-Aquino et al., "Detection of Microcalcifications in Digital Mammograms using The Dual-Tree Complex Wavelet Transform," Engineering Intelligence Systems, vol. 17, no. 1, pp. 49-63, March 2009. [16] Rajiv Singh, Richa Srivastava, Om Praksh, and Ashish Khare. (2009) Research Gate. [Online]. http://www.researchgate.net/publication/236597585_DTCWT_based_multimodal_medical_image_fusion [17] Essam A. Rashed and Mohamed G. Awad, "Neural Networks Approach for Mammography Diagnosis using Wavelet Features," First Canadian Student Conference on Biomedical Computing, 2006. [18] Ivan W. Selesnick, Richard G. Baraniuk, and Nick G. Kingsbury, "The Dual-Tree Complex Wavelet Transform," Signal Processing Magazine, IEEE, vol. 22, no. 6, pp. 123-151, 2005. [19] P. J. G. Lisboa, "A Review of Evidence of Health Benefits from Artificial Neural Network in Medical Intervention," Neural Network, vol. 15, pp. 11-39, 2002. [20] A. Papadopoulos, D. I. Fotiadis, and A. Likas, "An Automatic Microcalcification Detection System based on A Hybrid Neural Network Classifier," Artificial Intelligence in Medicine, vol. 25, pp. 149-167, 2002.
Authors Lowis, In 2014, Lowis finished his undergraduate degree in Computer Science (applied database major). Currently, he is a Magister Teknik Informatika (computational intelligence major) student at Binus University.
Copyright ⓒ 2015 SERSC
95
International Journal of Signal Processing, Image Processing and Pattern Recognition Vol.8, No.3 (2015)
Hendra, In 2014, Hendra finished his undergraduate degree in Computer Science (database major). Currently, he is a Magister Teknik Informatika (computational intelligence major) student at Binus University.
Lavinia, In 2014, Lavinia finished her undergraduate degree in Computer Science (database major). Currently, she is a Magister Teknik Informatika (computational intelligence major) student at Binus University.
96
Copyright ⓒ 2015 SERSC