While finding matrices that are better suited for different sets of fingerprints, ... This QM (which we will call âmanual QMâ from now on) can be seen in Figure. 3b. ... Each evolution run in our experiments has the same basic steps and .... M. Tistarelli and M.S. Nixon, editors, Proceedings of the 3rd International Conference.
JPEG Optimisation for Fingerprint Recognition: Generalisation Potential of an Evolutionary Approach Thomas Herzog, Andreas Uhl {therzog,uhl}@cosy.sbg.ac.at Department of Computer Sciences, University of Salzburg Jakob-Haringer-Straße 2, Salzburg, Austria Abstract: For fingerprint-based biometric systems, JPEG has traditionally been one of the primary storage formats. In this paper, we investigate methods of optimising JPEG compression for increased matching scores at constant compression rates. To achieve this, an evolutionary approach is employed to optimise the quantisation matrix used by JPEG. While finding matrices that are better suited for different sets of fingerprints, different fingerprint sensors, and different recognition algorithms as they have been optimised for remains elusive, we find improvements in matching performance for dataset fitting scenarios.
1
Introduction
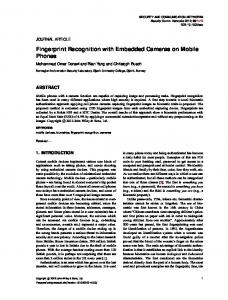
Due to its inclusion in a former version of the ISO/IEC 19794 standard on Biometric Data Interchange Formats, biometric systems relying on fingerprint data have traditionally used JPEG [PM93] as their image storage format, besides other specialised formats such as WSQ [BBH93] or, more recently, JPEG2000, the current ISO/IEC 19794 recommendation. The optimisation of existing standardised compression algorithms to meet the specific properties of the biometric data to be compressed is a natural strategy. For example, JPEG quantisation matrix (QM) optimisation has been done to optimise results in face recognition [JKAA06] and iris recognition [KSU09]. JPEG2000 has been optimised w.r.t. possible wavelet packet decomposition structures for fingerprint recognition [MSU10] and iris recognition [HUKU13]. Even JPEG XR has been optimised for the iris recognition context [HSU12]. Optimisation of JPEG for fingerprint image compression is unexplored up to now. Thus, in this paper, we will suggest to optimise the JPEG QM for optimal usage in fingerprint recognition by employing evolutionary optimisation. In particular, we will focus on the potential generalisation of evolved QMs to different datasets as well as different feature extraction and matching schemes. In the remainder of this section, we will motivate our approach. Section 2 explains the methodology used in this study while detailed results are presented in Section 3. Section 4 concludes the paper. Because our goal is to optimise the QM, it makes sense to first look at the distribution of DCT coefficients. To this end, we took two generic images (photographs), and visualised
287
(a) Photographs
(b) Fingerprints
Figure 1: Average DCT coefficients of generic and fingerprint images (lighter areas indicate higher values) the average of DCT coefficients over all image blocks, and did the same for two fingerprint images. DCT coefficients are laid out in a matrix: horizontal frequency increases as the x coordinate (left to right) increases, vertical frequency increases as the y coordinate (top to bottom) increases. Thus, the top left corner contains the lowest frequency and the lower right corner the highest frequency. As can be seen in Figure 1, more energy is contained in the lower frequency coefficients for fingerprints and increasingly high frequencies seem to be less relevant for fingerprint images than for generic images, at least for the four chosen example images. The default QM in the luminance channel (as shown in Figure 3a) was obtained from a series of psychovisual experiments, and has “been known to offer satisfactory performance, on the average, over a wide variety of applications and viewing conditions” [Bov09]. As is stated in the JPEG specification itself: “These tables are provided as examples only and are not necessarily suitable for any particular application.” Our hypothesis was that, since the default QM was designed for the general case, it should be possible to find better candidates for specific use cases. To test this hypothesis, we created a manually crafted QM, based on the default QM but with most higher frequency components set to 255 (the maximum value for baseline JPEG) due to the observations in Fig. 1. This QM (which we will call “manual QM” from now on) can be seen in Figure 3b. In this paper, we employ genetic algorithms to optimise the QM for fingerprint images in general, fingerprint images from a specific scanning device, and a specific set of fingerprint images (dataset fitting). Lastly, we investigate whether the results obtained with a specific fingerprint recognition algorithm do generalise to different algorithms.
2 2.1
Methodology Evolution
Our main approach for finding better adapted QMs was to use genetic algorithms. We used Watchmaker [Dye10], an open source framework for implementing genetic algorithms
288
0.5 Database
Description
FVC2002 DB3
capacitive sensor
Best fitness of current generation Mean fitness (with standard deviation)
0.4
“100 SC” (Precise Biometrics) optical sensor “V300”
0.3 EER
FVC2004 DB1
0.2
(CrossMatch) FVC2004 DB2
optical sensor “U.are.U 4000”
0.1
(Digital Persona) FVC2004 DB3
thermal sweeping sensor
0
“FingerChip FCD4B14CB”
Table 1: Fingerprint Databases
0
10
20
30
40
50
Generation
(Atmel)
Figure 2: Example of fitness increase during an evolutionary run. (Data for this graph was collected by evolving a QM for 10 fingers (80 impressions) from FVC2002 DB3 over 50 generations.)
in Java. As source data, fingerprints from the databases of the Fingerprint Verification Competitions (FVC) of 2002 and 2004 were used, as shown in Table 1. Each database contains 8 impressions of 110 fingers.1 We restricted our experiments to subsets of the first 100 fingers per database. The basic idea of a genetic algorithm is as follows: There exists a population of individuals, and a fitness function that assigns each individual a specific fitness (a numeric value). The goal is to either maximise or minimise this fitness. An evolutionary run consists of multiple generations. In each generation, depending on the selection scheme, a subset of individuals are chosen to produce offspring (mostly via cross-over and mutation) for the next generation. The offspring constitute a new population and the algorithm starts over. This continues until some termination criteria is reached (e.g. a maximum number of generations, a target fitness threshold, fitness stagnation, . . . ). Here, the individuals are QMs, represented by an array of 8 × 8 = 64 integer values (the quantisation coefficients). To get from a matrix to a one-dimensional array, the QM values are scanned in zigzag order [PM93]. As fitness function for a QM, the equal error rate (EER) is computed following the official FVC protocol [MMJP05]. Before that, the entire dataset subject to optimisation is compressed with JPEG as close as possible to the specified compression ratio (CR) using this QM. Note that for evolutionary optimisation of the QMs, we use the freely available biometric software NBIS [NIS13] for template extraction (MINDTCT is used for minutiae extraction) and matching (using BOZORTH3). For evolutionary cross-over, we use the existing class IntArrayCrossover, configured to use a single cross-over point. Given two parent individuals QM a and b, an index 1 In our copy of the data, images from FVC2004 DB3, fingerprint sets 5 and 54-60 were corrupt. Those sets have, for our experiments, been replaced with sets 102-109.
289
(point) x ∈ {0, . . . , 63} is selected at random to generate the child c, where $ ai if i ≤ x ci = , 0 ≤ i < 64 bi if i > x For evolutionary mutation, we use an instance of the custom class IntArrayMutation, which (with a probability of p = 0.02 per array element) mutates an element x by a random value m ∈ N, −42 < m < 42 so that the final value is y = max(min(x + m, 255), 0)
3
Experiments
3.1
Setup
Each evolution run in our experiments has the same basic steps and parameters: An instance of QuantisationMatrixEvaluator is created and parameterised with the employed fingerprint database, the number of individual fingers used from this database (10 to 100, in steps of 10), and the compression rate to aim for (which is set to 30 for our experiments, since this value represents a good compromise of file size reduction and still sensible matching results). A custom IntArrayFactory is created, which can create arrays of 8 × 8 = 64 randomly generated integer values of the form x ∈ N, 0 ≤ x < 256 which are used as the initial population of QMs. A Watchmaker evolution engine instance is created and configured to use a roulette wheel selection algorithm, and a Mersenne Twister pseudorandom number generator. In addition to the initial random population, the engine is seeded with two predefined QMs: The default luminance QM from Figure 3a, and the manually crafted QM from Figure 3b. The evolution engine is started to run with a population of 100 individuals and an elite count2 of 5 for 50 generations. Figure 2 shows example results of an evolutionary run that took 12 hours and 3 minutes to R CoreTM i5-2300 CPU and 8 complete on a Windows 7 (64 bit) computer with an Intel$ GB of RAM.
3.2
Experimental Results
A visualization of two evolved QMs is shown in Figure 3, next to the default luminance (Figure 3a) and manual (Figure 3b) QMs. 2 i.e.
the number of individuals with highest fitness that are copied over to the next generation unchanged
290
(a) Default luminance QM
(b) Manual QM
(c) Evolved QM 1
(d) Evolved QM 2
Figure 3: Visualization of select QMs (darker areas correspond to higher values) The QM shown in Figure 3c was evolved using a set of 10 fingers (i.e. 80 impressions) from FVC2002 DB3 over 50 generations. Figure 3d shows a QM that was evolved on the same DB, but using a set of 100 fingers (i.e. 800 impressions). This suggests that it is possible, using an evolutionary search approach, to find non-obvious QM optimisations for a given set of images and a given application (i.e. biometric matching). ), i.e. a QM that is evolved for a certain Figure 4 shows the results for dataset fitting ( set of fingers is evaluated over the same set of fingers of the identical database. The results are compared with default luminance ( ) and manual ( ) QM performance. Number of fingers
Number of fingers
Number of fingers
Number of fingers
10 20 30 40 50 60 70 80 90100
10 20 30 40 50 60 70 80 90100
10 20 30 40 50 60 70 80 90100
10 20 30 40 50 60 70 80 90100
EER
0.2
0.1
0 (a) FVC2002 DB3
(b) FVC2004 DB1
Default
(c) FVC2004 DB2
Manual
(d) FVC2004 DB3
Evolved
Figure 4: Dataset fitting EER for default, manual and evolved QMs using NBIS We clearly notice that the EER is improved (i.e. decreased) for all four datasets in case of the evolved QM. Moreover, it turns out that, except for FVC2004 DB3, a low number of fingers involved in the optimisation process leads to higher gains in EER. This is to be expected since the adaptation process can really adapt to a low number of fingers almost individually. To examine intra-database generalisation behaviour, we evolved QMs on a set of n = 10k, k ∈ {1, . . . , 9} fingers, and evaluated the resulting QM on the remaining 100 − n ), plotted against fingers of the same database. The results are shown in Figure 5 ( ) and manual ( ) QMs. performance of the default luminance ( Thus we can conclude that even for fingerprint images from the same sensor, matching performance gains from QM optimisation do not readily generalise across different sets of fingerprint impressions. Figure 6 shows the EER for each of the four databases, when using QMs evolved for each
291
EER
0.3
Number of fingers
Number of fingers
Number of fingers
Number of fingers
10 20 30 40 50 60 70 80 90
10 20 30 40 50 60 70 80 90
10 20 30 40 50 60 70 80 90
10 20 30 40 50 60 70 80 90
0.2
0.1 (b) FVC2004 DB1
(a) FVC2002 DB3
(c) FVC2004 DB2
Default
Manual
(d) FVC2004 DB3
Evolved
Figure 5: Intra-database EER for default, manual and evolved QMs. (Note that the number of fingers n indicates the number used for evolving the QM.) database separately (on 100 fingers each, i.e. dataset fitting), compared with results for the default luminance and manual QMs (inter-database generalisation). 0.4
Default Manual FVC2002 DB3 FVC2004 DB1 FVC2004 DB2 FVC2004 DB3
EER
0.3 0.2
B3 FV
C2
00
4
D
B2 FV
C2
00
4
D
B1 D 4 00 C2 FV
FV
C2
00
2
D
B3
0.1
Figure 6: EER for default, manual and evolved QMs. The EER when using a QM evolved for the same DB (on the same set of 100 fingers) clearly improves (decreases) as observed before. In contrast, when using “foreign” QMs (excluding the default and manual QMs), the average EER increases significantly. Using the manual QM leads to a slight average performance decrease. These results show that matching performance gains resulting from QM optimisation for a specific set of fingerprint images do not readily generalise to other sources of fingerprint image data. Finally, we examine matching performance of different (non-NBIS) template extraction and matching engines when using QMs evolved using NBIS – cross-algorithm generalisation: VeriFinger and Phase Only Correlation Matcher (as re-implemented in [HUPU13]) are used. Figures 7 and 8 show detailed results for cross-engine evaluation, with performance data ), manual ( ) and evolved (VeriFinger ( ) and Phase for the default luminance ( Only Correlation ( ) QMs plotted against each other. These results indicate that, while small performance increases appear for Phase Only Cor-
292
0.08
Number of fingers
Number of fingers
Number of fingers
Number of fingers
10 20 30 40 50 60 70 80 90100
10 20 30 40 50 60 70 80 90100
10 20 30 40 50 60 70 80 90100
10 20 30 40 50 60 70 80 90100
EER
0.06 0.04 0.02 0 (b) FVC2004 DB1
(a) FVC2002 DB3
Default
(c) FVC2004 DB2
Manual
(d) FVC2004 DB3
Evolved
Figure 7: Dataset fitting EER for default, manual and evolved QMs using VeriFinger Number of fingers 0.4
10
20
30
40
Number of fingers 50
10
20
30
40
Number of fingers 50
10
20
30
40
Number of fingers 50
10
20
30
40
50
EER
0.3 0.2 0.1 (a) FVC2002 DB3
(b) FVC2004 DB1
Default
(c) FVC2004 DB2
Manual
(d) FVC2004 DB3
Evolved
Figure 8: Dataset fitting EER for default, manual and evolved QMs using Phase Only Correlation relation, significant performance gains (like those evidenced in the case of dataset fitting using NBIS) do not generalise to other template extraction and matching algorithms. In the case of VeriFinger, the manual as well as the evolved QMs lead to significantly worse performance.
4
Conclusion
Our experiments show that, while it is possible to tailor-fit JPEG for a specific set of fingerprint images by finding appropriate quantisation matrices via genetic algorithms, the resulting matching performance improvements do not, on average, generalise to other sets of fingerprint images, be it from the same database (and thus the same type of sensor) or from different ones. In addition, the evolved quantisation matrices do not, on average, lead to improved performance when employing template extraction and matching algorithms different than those used for evolution. The most promising result is an increase of on average more than 20% in matching performance for dataset fitting scenarios. Similar results and trends of poor generalisation behaviour have been reported for optimising JPEG2000 Part2 wavelet packet subband structures for iris recognition [HUKU13].
293
References [BBH93]
Jonathan N. Bradley, C. M. Brislawn, and T. Hopper. The FBI Wavelet/Scalar Quantization Standard for Gray-scale Fingerprint Image Compression. In SPIE Proceedings, Visual Information Processing II, volume 1961, pages 293–304, Orlando, FL, USA, April 1993.
[Bov09]
A.C. Bovik. The Essential Guide to Image Processing. Elsevier Press, 2009.
[Dye10]
Daniel W. Dyer. Watchmaker Framework for Evolutionary Computation. Online: http://watchmaker.uncommons.org/, January 2010.
[HSU12]
Kurt Horvath, Herbert St¨ogner, and Andreas Uhl. Optimisation of JPEG XR quantisation settings in iris recognition systems. In P. Davies and D. Newell, editors, Proceedings of the 4th International Conference on Advances in Multimedia (MMEDIA 2012), pages 88–93. IARIA, 2012.
[HUKU13] J. H¨ammerle-Uhl, M. Karnutsch, and A. Uhl. Evolutionary Optimisation of JPEG2000 Part 2 Wavelet Packet Structures for Polar Iris Image Compression. In Proceedings of the 18th Iberoamerican Congress on Pattern Recognition (CIARP’13), volume 8258 of Springer LNCS, pages 391–398, Havana, Cuba, 2013. [HUPU13] J. H¨ammerle-Uhl, M. Pober, and A. Uhl. Towards Standardised Fingerprint Matching Robustness Assessment: The StirMark Toolkit – Cross-Database Comparisons with Minutiae-based Matching. In Proceedings of the 1st ACM Workshop on Information Hiding and Multimedia Security (IH&MMSec’13), pages 111–116, Montpellier, France, June 2013. [JKAA06] G.-M. Jeong, C. Kim, H.-S. Ahn, and B.-J. Ahn. JPEG Quantization Table Design for Face Images and Its Application to Face Recognition. IEICE Transactions on Fundamentals of Electronics, Communications and Computer Science, E69-A(11):2990 – 2993, 2006. [KSU09]
Mario Konrad, Herbert St¨ogner, and Andreas Uhl. Custom Design of JPEG quantization tables for compressing iris polar images to improve recognition accuracy. In M. Tistarelli and M.S. Nixon, editors, Proceedings of the 3rd International Conference on Biometrics 2009 (ICB’09), volume 5558 of LNCS, pages 1091–1101. Springer Verlag, 2009.
[MMJP05] Davide Maltoni, Dario Maio, Anil K Jain, and Salil Prabhakar. Handbook of Fingerprint Recognition. Springer Science+Business Media, Inc., 2005. [MSU10]
B. M¨uhlbacher, T. St¨utz, and A. Uhl. JPEG2000 Part 2 wavelet packet subband structures in fingerprint recognition. In P. Frossard, H. Li, F. Wu, B. Girod, S. Li, and G. Wei, editors, Visual Communications and Image Processing 2010 (VCIP’10), number 7744 in Proceedings of SPIE, pages 77442C–1 – 77442C–10, Huang Shan, China, July 2010. SPIE.
[NIS13]
NIST. NIST Biometric Image Software, Version http://www.nist.gov/itl/iad/ig/nbis.cfm, October 2013.
[PM93]
W.B. Pennebaker and J.L. Mitchell. JPEG – Still image compression standard. Van Nostrand Reinhold, New York, 1993.
294
4.2.0.
Online: