K2: A System for Campaign Deployments of Wireless Sensor Networks Doug Carlson, Jayant Gupchup, Rob Fatland‡ , and Andreas Terzis Johns Hopkins University Department of Computer Science Microsoft Research‡ {carlson,gupchup,terzis}@cs.jhu.edu,
[email protected]
Abstract. Environmental scientists frequently engage in “campaignstyle” deployments, where they visit a location for a relatively short period of time (several weeks to months) and intensively collect measurements with a combination of manual and automatic methods. We present K2, a mote-based system which brings high-quality automated monitoring to deployments of this nature. We identify key application requirements, describe the design and evolution of K2, and present performance results from two field deployments (the largest lasting ∼ 5 weeks and including 50 sensing nodes). Our results indicate that K2 is a viable scientific tool, achieving data yield > 99% and producing accurately time-stamped data, even in the absence of a persistently available reliable clock source. These results point a path towards WSN deployments managed by non-CS specialists.
1
Introduction
In this paper, we present the design, deployment, and performance results of K2 (Kampaign Koala), an evolution of the Koala [10] environmental monitoring system for “campaign-style” deployments. In this application space, domain scientists (in our case soil ecologists and atmospheric scientists) perform several weeks to several months of monitoring, frequently in remote and inaccessible regions. WSNs for campaign deployments face the problems common to most sensor networks: they must be energy-efficient and cope with lossy communications. However, for WSNs to be useful for this class of deployments, they must also be able to achieve a very large fraction of their intended data yield, timestamp all measurements accurately and be resilient to periods of unattended operation without a central basestation or persistent global clock source. K2 combines a low-power collection protocol, post-mortem timestamp reconstruction system, and delta compression to meet these goals. Over the course of two field deployments (one with 20 nodes for 2 weeks and another with 50 nodes for ∼ 5 weeks), >99% of the intended data volume was collected and accurately timestamped. We were able to achieve energy efficiency which projects to a median battery lifetime above 900 days and storage capacity above 100 days with off-the-shelf TelosB motes and commercially available batteries.
2
Carlson et al.
The remainder of this paper is structured as follows. In Section 2 we give an overview of related systems and approaches. Section 3 outlines the key system requirements and describes our designs. We discuss our experience with two field deployments of K2 in Section 4. In Section 5 we explore the performance of the individual subsystems in detail and conclude with Section 6.
2
Related Work
Campaign deployments must achieve high yields, even if disconnection is common. Most WSN protocols for continuous data collection, such as CTP [3] and the protocol used for the Harvard volcano-monitoring system [15] rely on a continuously present data sink and suffer from reduced data yield and network efficiency when the sink is absent. Early efforts such as the Macroscope in the Redwoods project [14] suffered from low data yields. More recent work continues to show that high yields can be difficult to achieve in deployments [5]. The Suelo system [12] is also designed for campaign deployments, but the authors focus on how humans can complement computational techniques for fault detection, while we focus on how to ensure high data yields without infrastructure or reliable maintenance visits. Due to the higher data rates demanded of it, Luster [13] incorporates dedicated storage nodes in the network to prevent losses due to space limitations. In our application domain, sensors need only be sampled at a modest rate (from every 30 seconds to every 10 minutes), so we can simplify matters with a homogeneous network in which individual nodes are fairly storage-efficient. Delta compression for sensor samples has been suggested before [2, 8]. We have not found descriptions of an implementation exactly like ours (where a pre-defined set of training data-derived “record types” indicate how many bits per-channel are available for records). Techniques such as those described by Li et al. [7] exploit the spatial correlation between data streams, while ours only exploits the temporal correlation of data within a single stream. These techniques seem highly promising, but we have not evaluated their impact on the complexity and performance of a system such as ours, and a simpler technique suffices to achieve our goals. FTSP [9] can provide an accurate shared time frame for all nodes in the network, but we do not know how well it will work in a heavily duty-cycled network which may lack strong connectivity. Previous experience [4] suggested that a postmortem approach would deliver the desired accuracy and would be unlikely to fail in a partitioned network with unstable motes. Postmortem time reconstruction was described previously in [15], but their methodology is not tolerant to a missing global clock source. K2 improves upon the previous Koala [10] system for environmental monitoring by incorporating Phoenix [4] for time reconstruction, delta compression, and other improvements to the data storage system (to reduce the data transferred by radio and stored in flash). This paper also presents results from field deployments of Koala and Phoenix, rather than from simulations and testbeds.
K2: A System for Campaign Deployments of Wireless Sensor Networks
3
Our work shares common ground with that of Barrenetxea et al. [1] and Langendoen et al. [6] in its descriptions of the “nuts and bolts” engineering and deployment problems which can be as decisive in a deployment’s success or failure as the technology in use. This paper focuses on the lessons learned from a different application space and complements these earlier works.
3 3.1
K2 Design K2 Requirements
There are several key requirements which define campaign deployments: Disconnection-Tolerance. Maintainers will visit the deployments according to their fieldwork schedules and no basestation is available between visits. Locations of interest may not necessarily form a well-connected network. Scientifically Usable Data. Sensor measurements should be taken at regular intervals (not necessarily synchronously between motes), at a rate that is meaningful to the target application. The samples must be accurately placed in a single global time scale and post-deployment calibration should be supported. Very High Data Recovery Rates. While low latency is not critical, the vast majority of data must be recovered eventually. 3.2
K2 Architecture Overview
Multiple sensor nodes, each made up of a TelosB mote [11], external antenna, battery, and sensor multiplexer board form the bottom tier of the system. Nodes take ADC samples from up to four external sensors at a fixed frequency, compress them, and store them in local flash. Nodes periodically exchange local time references with each other, but otherwise keep their radios off to save energy when not participating in downloads. When the researchers’ schedules permit it, they bring the basestation laptop to the field site. The basestation wakes up the sensor nodes, builds a centralized view of the network topology, and downloads any new data from nodes it can reach over multi-hop source-routed paths. If an Internet connection is available, researchers upload the data from the basestation to the back-end server. This machine hosts an SQL database of the data collected thus far and performs the necessary translations from compressed data in motes’ local time scales to physical values in the global time scale. 3.3
Functional Subsystems
Storage Subsystem. The storage subsystem is tailored to the requirements of campaign deployments. We want to record sensor measurements with the highest possible fidelity (i.e., raw ADC measurements), but we also want to ensure that the data recovery rate is loosely coupled with the rate of site visits: we don’t want to lose data because the researcher couldn’t make it to the field for a day.
4
Carlson et al. Values at t0 [100, 200] Values at t1 [101, 193] ∆1 [1, -7] Space required per-channel (in bits) [2, 4] All Record Types 0:[2, 2], 1:[2, 5], 2:[5, 2], 3:[4, 4] Smallest Feasible Record Type 1 Table 1. Delta compression example.
To achieve these goals, we added two layers to the TinyOS LogStorage stack and built a data-centric delta compression component. At time tk , a mote reads its sensors and calculates the difference from the measurements taken at tk−1 . It then uses the smallest pre-defined “record type” which can fit the delta. See Table 1 for an example of this procedure. Lossless compression is critical to maintaining scientifically-usable data, and delta compression is a simple way to achieve this in motes. Defining record types which correspond to the most-commonly-observed sets of field lengths allows us to save space over individually specifying the field lengths in every measurement. K2 buffers these deltas in RAM before writing them to flash in order to reduce the 1-byte-per-record overhead imposed by the TinyOS LogStorage implementation. These space-saving measures improve data recovery and disconnection tolerance by extending the time to fill the nodes’ flash and consequently reduce the frequency of site visits required to prevent data loss. We further improve confidence in data recovery by including a checksumming layer in the LogStorage stack. This writes a 16-bit CRC to the log every 1 KB of data and recomputes a CRC over the last 1 KB of data after every reboot. Collection Subsystem. The data is collected with a modified version of Koala [10]. K2 differs from Koala in its use of a weighted (rather than thresholded) link selection scheme and random breadth-first download order (which favors “fresh” over “stale” link information). This approach supports disconnectiontolerance by quickly adapting to the basestation’s location as the researcher takes it to different locations in the network (e.g., if the network does not form a single connected component). The Phoenix beacons described below also serve as LPP beacons for the wakeup procedure described in detail in [10]. In contrast to many collection protocols which assume a persistent base station and routing tree, K2 nodes maintain a low duty-cycle when there is no basestation (one transmission every 20 seconds). We support data recovery by building reliable delivery on top of the unreliable data stream primitive offered by Koala: each download attempt consists of the primary download of buffered data followed by a data gap-recovery phase during which the basestation re-requests data that was not received during the first phase. Timestamping Subsystem. We use Phoenix [4] to assign timestamps to measurements in post-processing. Nodes broadcast their local time state every 20 seconds (current clock value and number of reboots since installation). Once per hour, nodes keep their radio on and log the beacons that they receive, along with their current time state. This procedure produces a chain of references which are used to map the nodes’ clocks to a global time scale after the fact.
K2: A System for Campaign Deployments of Wireless Sensor Networks
5
Site Nodes Start End Sensors Clock Source Brazil 50 11/13/2009 12/18/2009 Air temp., Rel. Humidity GPS, VM clock Ecuador 20 05/22/2010 06/07/2010 Soil Temp., Moisture, CO2 Laptop clock Table 2. Summary of Deployments.
This mechanism addresses the requirement for scientifically-usable data, by providing measurements in a meaningful time frame. It also provides good disconnection-tolerance: we require neither full network-wide connectivity nor a continuous global clock presence, as long as there is some limited access to the global clock and a modest degree of pairwise node connectivity. Data-processing Subsystem. The data retrieved from the motes is first collected into a preliminary dataset in the field and is later uploaded to a database and processed into a science-ready dataset. The preliminary dataset uses a single calibration curve for all sensors of the same type and uses only the basestation-to-mote time references to do timestamp reconstruction. This setup requires minimal configuration on the part of the field scientists, but still gives them enough information about the data being collected to adapt the deployment (e.g., by replacing or moving hardware). This approach promotes data recovery by identifying problems with data collection before the end of the deployment. At the end of the deployment, we use Phoenix [4] to assign timestamps to the data1 and per-sensor calibration curves to convert measured values to physical values.
4
Deployments
4.1
Brazil
Setup. This deployment gathered data for atmospheric scientists to use in improving their models of weather development at the Nucleo Santa Virginia research station in the Atlantic coastal rain forest near S˜ao Paulo, Brazil. Previous models were based on measurements taken in a few vertical columns, while this dataset provides a 2-dimensional mesh of temperature and relative humidity measurements at the canopy, taken every 30 seconds. With two temperature and two humidity sensors per mote, this campaign produced 5,418,074 data points over its duration. 40 nodes were deployed along a series of cables and towers approximately 30 meters above the forest floor and 10 were deployed in a transect along the ground. The footprint of the deployment area was approximately 100 m by 100 m. The deployment location was a valley with no line-of-sight to permanent structures, 6 km by jeep to permanent power and 17 km more to a reliable Internet connection. The research staff were able to visit the site every weekday, 1
This can be done during the deployment as well, but better results are obtained if timestamp reconstruction is performed when all possible references are available.
6
Carlson et al.
barring weather. Following the deployment, we uniformly converted the ADC values to temperatures, and our colleagues calibrated each sensor individually to obtain sensor-specific readings from these. Experience and Observations. We built two motes fitted with GPS receivers, which were planned to provide an accurate global clock source during the deployment. However, due to lithium battery shipping/sourcing problems, these were not available until December 9, a full 22 days into the deployment. We planned to use the basestation laptop’s clock in cases such as this. However, to ease development, the basestation scripts were running in a virtual machine, which ran with a much more irregular clock than the host OS clock. While the VM clock gave poor global time, the local clock references (collected throughout the deployment) and GPS data (from the last nine days) were sufficient to assign timestamps to nearly all the measurements. This vindicated the timestamping subsystem and taught us a valuable lesson in cross-border research: budget as much lead time as possible between the equipment’s arrival and its deployment and test your backup systems rigorously. After the deployment, we found a few cases in which data from one mote exhibited a time offset in its data (e.g., its daily temperature peak was consistently a few minutes earlier than collocated motes). Closer inspection revealed that missing blocks of data were the cause: we assumed that samples were 30 seconds apart, so missing records shift the assumed timestamps of later samples earlier. We were able to detect these problems through the CRCs, but without a sequence number or timestamp in the records, we were not able to recover from it until the mote rebooted and reset its clock. This example highlights an important lesson in designing data storage systems: error-detection is not the same thing as error-recovery. We were able to download these sections correctly over a serial connection at the end of the deployment. 4.2
Ecuador
Setup. This deployment collected data for a study on soil respiration: it measured soil CO2 , soil temperature, and soil moisture every 30 seconds. Rather than blanketing an area, the deployment was made up of several widely-spread clusters of nodes: one in a pristine forest site, the other in a section of forest that had previously been clear-cut. The study site was accessible by a hiking trail from a research station in Ecuador’s Yasuni National Park, which had permanent power and an intermittent satellite Internet connection. The sensors used in this deployment added a layer of logistical problems. Their high cost limited the number that could be deployed, and their high powerconsumption necessitated frequent battery replacement. Experience and Observations. Access to preliminary data was introduced in this deployment. With access to this data, researchers could see when sensors were behaving erratically or operating outside of their effective measurement range and address these problems. They were also able to distinguish “interesting” and “uninteresting” locations and reposition sensors to get better measurements of the most valuable data. Data quality should be matched to its expected
K2: A System for Campaign Deployments of Wireless Sensor Networks
7
use: in the field, it’s more important to get data quickly and in a manageable form than it is to get publication-quality data. This brings up the issue of rapid hardware reconfiguration. We require researchers to keep track of the associations between sensors and nodes manually. If this mapping is not accurately captured, we are unable to convert from ADC measurements to physical values in post-processing. This will be impractical for larger or more dynamic deployments. We plan to build self-identifying sensors in the future which will allow nodes to record this metadata automatically. “Mundane” problems such as efficient metadata management must be addressed in order for WSNs to be adopted as useful scientific tools. In K2, the basestation requests all data which the nodes have stored that hasn’t been downloaded yet, and the database requests data which has been downloaded but hasn’t been processed yet. The logs of two nodes became unreadable to the compression routine in such a manner that the basestation could collect the data, but the database couldn’t process it. We transfer all outstanding data from the basestation to the back-end in a single file, and this file grew in size with each network download. Eventually, it grew large enough that we couldn’t reliably transfer it over the poor Internet connection. While we were able to log in remotely to fix this problem, it brought two important lessons to light. In campaign deployments, the basestation-to-back-end link should not be presumed to be reliable, and “fate-sharing” at any point in the data pipeline should be avoided. In the future, we plan to conduct separate uploads for each node, and break these into smaller units to address each of these issues.
5
Results and Observations
5.1
Storage
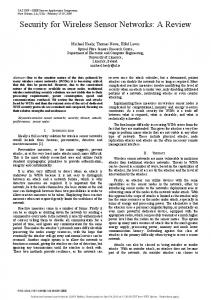
For the evaluation of the storage subsystem, we consider the size of the sample data and the overhead required to record it. These results are from the Brazil deployment: we did not have training data for Ecuador and not all channels were populated, so the results are not as informative. sizecompressed ) Figure 1(a) shows the per-node space savings from compression (1− sizeuncompressed for Brazil. The “Optimum” and “Achieved” compression assume four bits of overhead per record to identify the format at the decompressor2 . “Optimum” assumes that each sensor’s delta is represented with the fewest number of bits required to represent it: the only waste is from unused bits in the last byte. We used two weeks of 30-second temperature and humidity data from a nearby weather station to choose the record types. In general, for m record types and n example records, we order the examples by the number of bits required to represent their first field, and put then put them into m equally-sized buckets n (bucket 1 containing the first m records, and so on). We assign one record type to each of these buckets, and set the width of its first channel to the largest 2
In practice, “Optimum” requires many more than 16 record types to represent, so this calculation overestimates “Optimum”’s performance.
103
104
Log Record Headers Incomplete Pages
2
74
78
Bytes Overhead
Optimum Achieved
10
70
Space Savings (%)
105
Carlson et al. 82
8
0
10
20
30 Node
40
50
60
0
50
100
150
200
250
Buffer length (bytes)
(a) Per-node space savings with com- (b) LogStorage overhead. Note log scale pression. Node IDs reordered for clarity. on Y axis. Fig. 1. Compression space savings and log overhead.
first-channel width in its bucket. We then combine the buckets with the same first-channel width, and repeat this process recursively for the next channel. For example, if 50% of the records require 3 bits for channel 0, 8 of the 16 record types set aside 3 bits for channel 0. If 25% of this subset of records require 4 bits on channel 1, then 2 of the records would set aside 4 bits for channel 1. We had to hand-tune record types after this process to respect byte boundaries and account for the duplicated sensors. Figure 1(a) shows that our settings achieved between 90 and 94% of optimum, even without adaptive behavior in the field or per-device customization. Adding the ability to install new settings at runtime would be a straightforward way to improve flexibility without significantly complicating the sensing node logic. Figure 1(b) demonstrates the savings achieved by buffering data in RAM before writing it to flash. Writes can not span page boundaries, so buffer-flushes that would extend past the edge of a page waste up to buffer-length-minusone bytes. Every write incurs one byte of “Log Record Overhead.” This figure averages results from all nodes in Brazil. In the field, we used a buffer size of 200 bytes, which worked fairly well. A shorter buffer would have reduced waste on incompletely-filled pages and decreased data lost from the RAM buffer during crashes. We recovered 99.5% of the expected data, part of the missing data is no doubt due to these lost RAM buffers. A cross-layer approach where the buffering layer is aware of page boundaries (and preemptively flushes when needed) would reduce waste on incomplete pages without increasing the overhead from log records, but this optimization did not seem worth the increase in code space and complexity to us. 5.2
Timing
Figure 2 presents the distribution of per-node timestamped data yields from the deployments. In both deployments, over 95% of the motes lost less than 1% of their data, the remainder lost less than 6% of their data. In Brazil, 99.2% of the expected data volume was assigned scientifically-useful timestamps (99.7% of the recovered data). The yield for Ecuador was comparable at 99.1% (99.4%
K2: A System for Campaign Deployments of Wireless Sensor Networks