Impact of snowball sampling ratios on network characteristics estimation: A case study of Cyworld Haewoon Kwak, Seungyeop Han, Yong-Yeol Ahn, Sue Moon, and Hawoong Jeong KAIST CS/TR-2006-262 November 2006
KAIST Department of Computer Science
Impact of snowball sampling ratios on network characteristics estimation: A case study of Cyworld Haewoon Kwak, Seungyeop Han, Yong-Yeol Ahn, Sue Moon, and Hawoong Jeong Korea Advanced Institute of Science and Technology {haewoon, syhan}@an.kaist.ac.kr,
[email protected],
[email protected],
[email protected] Abstract Today’s social networking services have tens of millions of users, and are growing fast. Their sheer size poses a significant challenge in capturing and analyzing their topological characteristics. Snowball sampling is a popular method to crawl and sample network topologies, but requires a high sampling ratio for accurate estimation of certain metrics. In this work, we evaluate how close topo-logical characteristics of snowball sampled networks are to the complete network. Instead of using a synthetically generated topology, we use the complete topology of Cyworld ilchon network. The goal of this work is to determine sampling ratios for accurate estimation of key topological charac-teristics, such as the degree distribution, the degree correlation, the assortativity, and the clustering coefficient.
I. I NTRODUCTION Social networking service (SNS) has been proliferating on the Internet and gaining popularity [13]. The number of users of MySpace1 exceeds more than 100 million users, and other popular SNSs including orkut2 have also more than 10 million users. Much research on SNS has been done [2], [14]. However, the size of SNS is too large to handle, and most of the research has depended on network sampling methods. Snowball sampling is one of the popular networking sampling methods, such as node sampling, link sampling, etc. All sampling methods take a part of the complete network by some rules. As the sampling ratio increases, the network more accurately describes the complete network. In other words, the higher sampling ratio, the more accurate estimation results one. However, for the high sampling ratio, more space and time are required. The trade-off lies between accuracy and resource. Lee et al. has studied the impact of sampling ratios on parameter estimation for some network sampling methods, such as snowball sampling [7]. However, the size of the networks they have analyzed, including the Internet at the autonomous systems (AS) level, is two to three orders of magnitude smaller than todays commercially available SNSs. Characteristics of a network topology are often not straightforward to capture by a metric or two, and the difficulty of accurate estimation lies in the diversity of metrics and their sensitivity to topology. Palmer et al. have showed that their ANF algorithm outperforms the other sampling methods including snowball sampling in estimating neighbourhood function, N (h), which is the number of pairs of nodes within distance h [11]. However, they focused only on the neighbourhood function. Recently, Leskovec et al. have suggested using densification laws to reject bad sampled subgraphs [8]. In this paper, we investigate the appropriate snowball sampling ratio for accurate estimation of topological characteristics, such as the degree distribution, the degree correlation, the assortativity, and the clustering coefficient. We compare the complete topology of the Cyworld ilchon network to sampled networks with varying sampling ratios. Our contributions lie in the methodological approach in the evaluation of the snowball sampling methods with Cyworld. II. BACKGROUND A. Cyworld Cyworld is the largest online social networking service in South Korea [12], launched in September 2001. By the end of November 2005, the number of Cyworld users sur-passed 12 million, 27% of the total population of South Korea. Like other SNSs, Cyworld provides the means to build and manage human relationships. In Cyworld, 1 2
http://myspace.com http://orkut.com
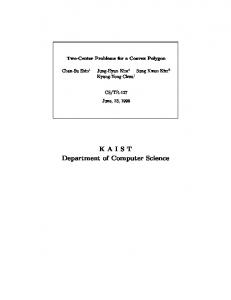
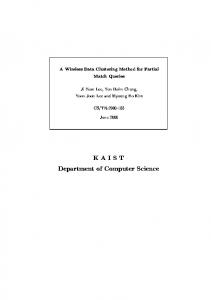
a member may invite other members to establish a relationship called ilchon between them simply by clicking the “add a friend” button. Then, if the invited member accepts it, an ilchon relationship is established. Online ilchon relationships reflect various kinds of real-world relationships: close friends and relatives, entertainment business workers and their fans, hob-byists of an interest, etc. From a topological view, ilchon relationships form an undirected network. We get a graph structure by mapping a member into a node and an ilchon relationship into an edge. As an ilchon relationship is established with mutual acceptances, edges in an ilchon network are undirected. The number of nodes in an ilchon network thus represents the total number of Cyworld users, and the number of edges the number of established ilchon relationships. B. Snowball Sampling Method The process of snowball sampling is very similar to the breadth-first search. First, we randomly choose a seed node. Next, we visit all the nodes directly connected to the seed node. Here, we define a layer as the nodes which have the same hop count to reach a seed node. In other words, all nodes directly connected to the seed node are said to be on the first layer. Then, we get the second layer by visiting all nodes directly connected to the nodes on the first layer. This process continues until the number of visited nodes reaches a limit determined by the sampling ratio. In order to control the number of visited nodes, we stop sampling even if not all the nodes on the last layer are visited. By definition, hub nodes are connected to many nodes, and likely to be visited in few layers in snowball sampling. Snowball sampled networks have a bias towards hub nodes. While this bias leads overestimation of some metrics like degree distribution, whether the initial node is a hub or not does not make a noticeable difference in characterizing the sampled network [7]. Nevertheless, the snowball sampling method is the one of only a few available solutions when we crawl the web. When we crawl an SNS site for topology information gathering, we can only follow the links from a node each time. We do not have random access to the overall topology of the network, and cannot directly access nodes or links which are not adjacent to each other. This is the reason why the link and node sampling methods are infeasible in crawling. III. C HARACTERISTICS OF S AMPLED N ETWORKS ON C YWORLD In this section, we compare the degree distribution, degree correlation, and assortativity of the complete Cyworld network with those of sampled networks with various sampling ratios. We use an anonymized snapshot of the entire ilchon network topology in November 2005. From this complete network topology, we construct sampled networks with varying sampling ratios. The sampling ratios vary from 0.1% to 1.0% in steps of 0.1%. Below the sampling ratio of 0.1% and beyond the sampling ratio of 1.0%, we use the following sampling ratios only: 0.01%, 0.05%, 0.25%, 0.75%, and 2.0 A. Degree Distribution The degree of a node is defined as the number of edges incident to the node. Many real networks, including online SNSs, are known to have a power-law degree distribution p(k) ∼ k −r , where p(k) is the empirical probability of a node having degree k [1], [4], [10]. distribution is often plotted as a complementary cumulative ∫ ∞ The ′ degree ′ probability function (CCDF), ℘(k) ≡ k P (k )dk ∼ k −α ∼ k −(γ−1) . Figure 1 plots the complementary cumulative degree distribution of the complete Cyworld ilchon network. The plot exhibits a multi-scaling behavior: the first part below the degree of 500 has an estimated exponent of -5 and the second part has -2. The well-known Hill estimator is used to estimate the tail behavior of a distribution [6]. Crovella et al. have proposed an empirically sound method to estimate the scaling exponent of a heavy tail distribution [3]. However, both approaches are not directly applicable to distributions of multi-scaling behavior. We resort to manual identification of two different scaling regions and line-fitting in our exponent estimation. We plot the degree distributions of sample networks with sampling ratios of 0.1%, 0.2%, 0.25%, and 0.5% in Figure 2. The multi-scaling behavior observed in the complete network appears only in 1 out of 5 sampled networks with the sampling ratio of 0.1%, 3 out of 5 with the sampling ratio of 0.2%, and in all 5 with the sampling ratio of 0.25% and 0.5%. Although one sampled network in Figure 2(c) has a different scaling exponent from four other sampled networks, it basically comes from the sampling methodology which takes a different part of the complete network.
100 10-1 10-2
-4
℘(k)
10-3 10-4 -1
10-5 -6
10
10-7 10-8 100
102
103 k
104
100
100
10-1
10-1
10-2
10-2
10-3
10-4
10-5
10-5
101
102
106
10-3
10-4
10-6 100
105
Degree distribution of the complete Cyworld Network
℘(k)
℘(k)
Fig. 1.
101
103 k
104
105
10-6 100
106
101
(a) ratio = 0.1%
102
103 k
104
105
106
105
106
(b) ratio = 0.2% 0
0
10
-1
10
10-1
10-2
10-2
10
℘(k)
℘(k)
-2.5
10-3 10-4
10-4
10-5
10-5
10-6 100
101
102
103 k
104
(c) ratio = 0.25%
Fig. 2.
105
106
-0.8
10-3
10-6 100
101
102
103 k
104
(d) ratio = 0.5%
Degree distributions from sampled networks of Cyworld
From Figure 2, we observe a multi-scaling behavior from all five sampled networks when the sampling ratio is larger than 0.25%. In contrast, we note that the multi-scaling behavior is present in only one or two sampled networks with ratio below 0.25%. When the sampling ratio is 0.5% or higher, we observe the multi-scaling behavior with exponents of -3.5 and -1.8, different from -5 and -2 of the complete network. It has been reported that the scaling exponent of snowball sampled networks is smaller than that of the complete network [7]; our results conforms to it. In addition, the scaling exponent of high-degree nodes is closer to that of the complete network than that of low-degree nodes. In snowball sampling, high-degree nodes are more likely to be selected than others, and thus the scaling exponent of high-degree nodes approaches that of the complete network more quickly than in the case of low-degree nodes. To detect multi-scaling behavior from sampled networks from any sampled network, at least 0.25% or higher sam-pling ratio is required. The estimated scaling exponents approach those of the complete network only when the sampling ratio goes above 0.5%. For scaling exponent values within the range of 1 the those of the complete
network, a sampling ratio of 0.5% or higher is needed. The multi-scaling behavior has been observed in Internet backbone traffic [5], [15], but not in any online networks, such as bloggers’ networks and other SNSs like MySpace. To our best knowledge, the Cyworld ilchon network is the first to exhibit this kind of behavior among SNSs. We suspect a heterogeneous makeup of Cyworld users to be attributable to this multi-scaling behavior, as one-time commercial events and famous entertainers attract anomalously large numbers of users than most friends and family relationships. However, further work is needed to confirm our conjecture and explicate the causes. B. Degree Correlation 105
104
knn(k)
103
102
101
100 100
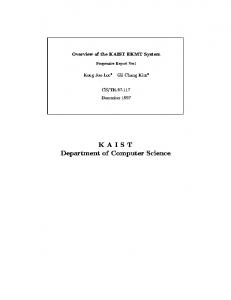
Fig. 3.
101
102
103 k
104
105
106
Degree correlation from complete network
The degree correlation is a mapping between a node degree k and the mean degree of neighbors of nodes having degree k . We plot the degree correlation of the complete network in Figure 3. Although a complex pattern emerges, it is clear that the overall correlation is negative. It is known that if the trend of a degree correlation of a network is negative, a hub node tends to be connected non-hub nodes [9]. Therefore, the plot in Figure 3 tells that the hub nodes of Cyworld is more likely to be con-nected to non-hub nodes than to hub nodes. We plot the degree correlation of sampled networks with sampling ratio of 0.05%, 0.1%, 0.2%, and 0.3% in Figure 4. All plots show complex patterns, and it is very hard to tell which is the 4(b) closest to Figure 3. In close examination of Figures 4(a) and , we observe that some graphs do not have a negative trend for 1 < k < 100. Thus, from these sampling experiments, we recommend a sampling ratio of 0.2% or higher for degree correlation estimation. C. Assortativity Assortativity is a measure to summarize the distribution of degree correlation. Like the overall trend of degree correlation in Section III-B, a negative value of assorativity represents a tendency of a hub node to connect to non-hub nodes. The assortativity, r, can be written as below, ∑ ∑ M −1 i ji ki − [M −1 i 21 (ji + ki )]2 r = −1 ∑ 1 2 , (1) ∑ 1 2 −1 2 M i 2 (ji + ki ) − [M i 2 (ji + ki )] where ji and ki are the degrees of the nodes at the ends of the ith edge, with i = 1, 2, , and M , and M is the number of all edges [9]. Figure 5 shows the changes in assorativity over sampling ratios of 0.01% to 2% sampled networks. The horizontal line is the assortativity of the complete Cyworld network. At the sampling ratio larger than 0.9%, the assorativity values of sampled networks fall within the range of complete networks. In [7], sampled networks from snowball sampling were shown to be more disassortative than the original network whether the original network is assortative or disassortative, but our results are very different. We cannot find some evidences which support that sampled networks are more disassortative than the original network in our results. It
106
105
105
104
104
knn(k)
knn(k)
106
103
103
102
102
101
101
100 100
101
102
103
104
100 100
105
101
102
103
k
105
105
104
104
knn(k)
knn(k)
106
103
102
101
101
102
103
104
105
100 100
101
102
103
k
105
k
(d) ratio = 0.3%
(c) ratio = 0.2% Fig. 4.
104
103
102
101
105
(b) ratio = 0.1%
(a) ratio = 0.05% 106
100 100
104
k
Degree correlation from sampled networks of Cyworld
0.6 sampled network full network
0.5 0.4
Assortativity
0.3 0.2 0.1 0 -0.1 -0.2 -0.3 0
Fig. 5.
0.2
0.4
0.6
0.8 1 1.2 sampling ratio
1.4
1.6
1.8
2
Assortativity of sampled networks of Cyworld. The red line is from complete network of Cyworld.
seems that the assortativity of sampled networks has nothing to do with that of the complete network. We are not sure why disassortative and assortative sampled networks are mixed up in our results. D. Clustering Coefficient The clustering coefficient Ci of node i is the ratio of the total number of the existing links between its neighbors, y , to the total number of all possible links between its neighbors [4], and can be written as below, 2y Ci = , (2) ki (ki − 1) where ki is the degree of node i. Figure 6 depicts average clustering coefficients of the sampled Cyworld networks with various sampling ratio. The minimum sampling ratio is 0.15%, and the maximum sampling ratio is 2.0%. We observe a gap between the sampled network and complete network closes as the sampling ratio increases.
0.7 sampled network full network
0.65
clustering coefficient
0.6 0.55 0.5 0.45 0.4 0.35 0.3 0.25 0.2 0.15 0
Fig. 6.
0.2
0.4
0.6
0.8 1 1.2 sampling ratio
1.4
1.6
1.8
2
Average clustering coefficients of sampled networks of Cyworld. The red line is from complete network of Cyworld
In addition, all clustering coefficient values of sampled networks are larger than that of the complete network. It means that the sampled networks from snowball sampling are more likely to be clustered than the complete network. IV. D ISCUSSION We have described the characteristics of sampled networks derived from the Cyworld ilchon network. From the results, we could get some insights on snowball sampling. However, the results in this paper come from only one real network, Cyworld, and may not apply to other networks. To generalize our results, we need to investigate if Cyworld is a representative of other social networks. In future, we plan to compare other SNSs with Cyworld. A simple qualitative analysis gave us some intuition about this problem. In Section III-A, Cyworld has two kinds of ilchon networks corresponding to different scaling behavior. From the relationship between members perspective, there are two kinds of ilchon in Cyworld. We conjecture that one reflects offline friendship, the other does online community. Except the difference of cultures of different countries, basically other SNSs support the similar feature with ilchon called friend, etc. Therefore, we expect that the friend network would be similar to ilchon network of Cyworld, because the members of other SNSs also make their offline friends of friends in online, and the other SNSs support many features to meet attractive member online, for example, conditional search and form a new online community. Therefore, members in other SNSs also have on-line and off-line friends. This is the reason why we conjecture our results can be generalized. V. S UMMARY In this work, we have studied the appropriate snowball sampling ratio of real social networking service, Cyworld. For good representation of multi-scaling behavior the degree distribution, we need a sampling ratio of 0.25% or larger. For accurate estimation of a negative trend of the degree correlation from all sampled networks, the sampling ratio of 0.2% or larger is required. For precise estimation of assortativity, we need a sampling ratio of 0.9% or larger. Finally, we can observe a gap between the sampled network and complete network closes as the sampling ratio increases for estimation of clustering coefficient. VI. ACKNOWLEDGEMENT We thank Jeongsu Hong and Jaehyun Lim of SK Communications, Inc. for providing us with the Cyworld data. R EFERENCES [1] R. Albert and A.-L. Barabasi. Statistical mechanics of complex networks. Reviews of Modern Physics, 74:47, 2002. [2] W. Bachnik, S. Szymczyk, P. Leszczynski, R. Podsiadlo, E. Rymszewicz, L. Kurylo, D. Makowiec, and B. Bykowska. Quantitive and sociological analysis of blog networks. ACTA PHYSICA POLONICA B, 36:2435, 2005. [3] M. E. Crovella and M. S. Taqqu. Estimating the heavy tail index from scaling properties. Methodology and Computing in Applied Probability, 1(1):55–79, July 1999. [4] S. N. Dorogovtsev and J. F. F. Mendes. Evolution of networks. Advances in Physics, 51:1079, 2002.
[5] A. Feldmann, A. C. Gilbert, and W. Willinger. Data networks as cascades: Investigating the multifractal nature of internet WAN traffic. In SIGCOMM, pages 42–55, 1998. [6] B. M. Hill. A simple general approach to inference about the tail of a distribution. The Annals of Statistics, 3(5):1163–1174, 1975. [7] S. H. Lee, P.-J. Kim, and H. Jeong. Statistical properties of sampled networks. Phys. Rev. E, 73:016102, 2006. [8] J. Leskovec, J. Kleinberg, and C. Faloutsos. Graphs over time: densification laws, shrinking diameters and possible explanations. In SIGKDD, pages 177–187. ACM Press, 2005. [9] M. E. J. Newman. Assortative mixing in networks. Phys. Rev. Lett., 89:208701, 2002. [10] M. E. J. Newman. The structure and function of complex networks. SIAM Review, 45:167, 2003. [11] C. Palmer, P. Gibbons, and C. Faloutsos. ANF: A fast and scalable tool for data mining in massive graphs. In SIGKDD, 2002. [12] Rankey.com. http://www.rankey.com. [13] Techweb. http://www.techweb.com. [14] S. Wasserman and K. Faust. Social network analysis. Cambridge University Press, Cambridge, 1994. [15] Z. Zhang, V. Ribeiro, S. Moon, and C. Diot. Small-Time scaling behaviors of internet backbone traffic: an empirical study. In INFOCOM, 2003.