In hands-free car mobile communication systems, enhancement of the speech .... (PSD) of the observed noisy signal, estimated speech sig- nal and estimated ...
KALMAN FILTERING SPEECH ENHANCEMENT INCORPORATING MASKING PROPERTIES FOR MOBILE COMMUNICATION IN A CAR ENVIRONMENT Chang Huai YOU+ , Soo Ngee KOH*, Susanto RAHARDJA+ +
Institute for Infocomm Research, Singapore 119613 * School of EEE, Nanyang Technological University, Singapore 639798 ABSTRACT In this paper a single channel speech enhancement system based on Kalman filtering and masking properties of the human auditory system is studied. The main objective of our study is to develop a high quality speech enhancement system for car mobile communication, which optimizes the tradeoff between speech distortion and noise reduction. To develop a robust Kalman filtering speech enhancement system, we propose that the noise variance estimate be modified as a function of masking threshold in each subband. By using such a Kalman filtering with masking method, we can achieve better results as compared to full band Kalman filtering, especially in the case of weak speech spectral components in noise. Through a great deal of simulations, we show the advantages of our proposed system in terms of objective and subjective measurements as compared to many existing speech enhancement methods. 1. INTRODUCTION The objectives of speech enhancement are to either improve one or more perceptual aspects of speech, such as overall quality and intelligibility, or to reduce the amount of distortions to improve speech recognition rate. In hands-free car mobile communication systems, enhancement of the speech severely contaminated by additive colored noise in a running car can potentially improve the quality of voice communications. In this paper, single channel speech enhancement is studied. Despite the availability of a wide variety of theoretical and relatively effective techniques, the problem of enhancing noisy speech still poses a challenge to many researchers. There are many publications which reported speech enhancement methods such as spectral subtraction, minimum meansquare error (MMSE) method proposed by Ephraim & Malah [1], autoregressive (AR) model-based Kalman filtering [2, 3], auditory perceptual criteria based method [4], hidden Markov model (HMM) and subspace methods. Taking into considerations implementation and complexity of a speech enhancement algorithm for possible applications such as car mobile communications, Kalman Filtering
0-7803-8603-5/04/$20.00 ©2004 IEEE.
could be a good technique to use. The reason for this is threefold. Firstly, this technique leads to low speech distortion. Secondly, it results in low noise distortion and finally, it has a reasonable computation complexity. There are quite a number of publications which reported speech enhancement methods using Kalman filtering. The advantages of Kalman filtering, as compared to spectral domain processing such as spectral subtraction and MMSE spectral suppression, are that it could overcome the tonal noise problem, and achieve quite good speech quality by reducing the processing distortion introduced to the speech signal. Subband Kalman filtering [2] is also reported for its good computation cost and improved performance as compared to the full band case. Applications of the properties of the human auditory system to speech enhancement have been reported in the past, especially in spectral domain speech enhancement [4]. The main aim of this method is to find an optimal trade off between noise suppression, speech distortion and residual level of the tonal noise. In this paper, we study how the masking properties could be applied to a time domain Kalman filtering system involving subband analysis. Experiments indicate that our proposed estimator has better performance in terms of both objective and subjective evaluations as compared to many existing speech enhancement methods. 2. KALMAN FILTER FOR SPEECH ENHANCEMENT Consider the following model for noisy speech x(n) = s(n) + v(n),
n = 1, 2, ...
(1)
where x(n), s(n) and v(n) denote the discrete time samples of noisy speech, clean speech and noise respectively. We assume that the clean speech signal can be considered as an autoregressive (AR) process, which is the output of an all-pole linear system driven by a signal, w(n), which is a 2 zero-mean white Gaussian process with variance σw s(n + 1) =
p X i=1
ai s(n + 1 − i) + w(n).
(2)
Interior car noise within a relevant short time period can be assumed stationary and modelled by the same type of AR equation, i.e., v(n + 1) =
q X
3.1. Subband Filter bi v(n + 1 − i) + u(n).
(3)
i=1
Here u(n) is a white Gaussian process with variance σu2 . Let s(n) = [s(n − p + 1) ... s(n − 1) s(n)]T , v(n) = [v(n − q + 1) ... v(n − 1) v(n)]T , and AR parameters a(n) = [ap ... a2 a1 ]T , b = [bq ... b2 b1 ]T . We reformulate Eqs. (1)-(3) in the form of a Kalman process equation and measurement equation in state space domain as follows ¯ + 1)¯s(n) + ¯gw(n) ¯s(n + 1) = F(n ¯ (4) T ¯ ¯s(n) x(n) = C (5) where
·
¸
¸ · ¸ s(n) w(n) C ¯ ¯s(n) = ¯ , w(n) = , C= (6) v(n) u(n) Cv · ¸ · ¸ 0 g 0 ¯ + 1) = F(n + 1) F(n , ¯g = (7) 0 Fv (n + 1) 0 gv with 0 1 ... 0 0 .. .. . . . . . .. . . F(n+1) = . , g = C = . 0 0 0 ... 1 ap ap−1 . . . a1 p×p 1 p×1 (8) 0 1 ... 0 0 .. .. .. .. . . . . . Fv (n+1) = . , gv = Cv = . . 0 0 0 ... 1 bq bq−1 . . . b1 q×q 1 q×1 (9) The estimate of s(n) can be obtained by Kalman filtering as follows ¯C ¯ T K(n)C] ¯ −1 ¯ + 1)K(n)C[ G(n) = F(n (10)
·
¯ T ˆ¯s(n|xn−1 ) α(n) = x(n) − C ¯ + 1)ˆ¯s(n|xn−1 ) + G(n)α(n) ˆ¯s(n + 1|xn ) = F(n ¯ T K(n) ˘ ¯ + 1)−1 G(n)C K(n) = K(n) − F(n
(11)
¯ + 1)K(n) ˘ ¯ + 1)H + Q K(n + 1) = F(n F(n
(14)
C1 = [CT 0 | ... {z
0}]T
A uniform and critical polyphase MDCT filterbank [5] is used as analysis and synthesis filter banks in our system. The number of bands is set to L. The down sampling and up sampling ratios are M : 1 and 1 : M respectively, and we set M = L. Suppose the prototype filter of subband is ~(n), the p-th polyphase filter e(p, n) is then denoted by, e(p, m) = ~(mM + p),
(13)
(16)
q
where sˆ(n) is the estimate of s(n), G(n) is the Kalman gain, K(n) = E{[s(n) − ˆs(n|xn−1 )][s(n) − ˆs(n|xn−1 )]T } is the predicted state-error correlation matrix. Q is a sparse matrix 2 with only two nonzero elements, that is Q(p, p) = σw and 2 Q(p + q, p + q) = σu .
p = 0, 1, ..., L − 1.
(17)
The k-th analysis filter hk (n) and k-th synthesis filter gk (n) can be proved to be given by the following equations hk (n) = hk (mM + p) = 1 π π 2e(p, m) cos[(k − )(p − 1) + φk (m) + (−1)k−1 ] 2 M 4 (18) gk (n) = gk (mM + p) = 1 π π 2e(p, m) cos[(k − )(p − 1) + φk (m) − (−1)k−1 ] 2 M 4 (19) where k, p = 0, 1, ..., L − 1 and φk (m) = mπ(k − 12 ). 3.2. AR Parameters and Variance Estimation 2 The time-varying parameters a = [ap ... a2 a1 ]T , σw , T 2 b = [bq ... b2 b1 ] and σu have to be estimated. For each n, speech AR parameters a = [ap ... a2 a1 ]T and colored noise AR parameters b = [bq ... b2 b1 ]T can be obtained using the well-established Durbin-Levinson algorithm. a is obtained from noisy speech (or previous enhanced speech) iteratively, and b is obtained during speech absence periods. Besides the AR parameters, the variance 2 σw has to be estimated, and we use the following approach in our estimation
(12)
The estimate of speech signal is the output of Kalman filtering after the prediction estimation. ¯ + 1, n)−1ˆ¯s(n + 1|xn ) ˆ¯s(n|xn ) = F(n (15) sˆ(n) = CT1 ˆ¯s(n|xn ),
3. MASKING PROPERTIES INCORPORATING INTO SUBBAND KALMAN FILTERING
2 σw (n)
©
= E |s(n) −
p X
a∗i (n)s(n − i)|2
ª
i=1
= Rss,n (0) − 2Re
p ©X
ª a∗i Rss,n (i)
(20)
i=1
+
p X p X
a∗i aj Rss,n (i − j).
i=1 j=1
The autocorrelation values Rss,n (i), i = 0, ..., p are calculated as follows Rss,n = IDF T {SP SD (jb , n)}
(21)
SP SD (jb , n) ' XP SD (jb , n) − τ D(jb , n)2
(22)
XP SD (jb , n) = |X(jb , n)|2
(23)
where jb denotes the frequency bin of a particular subband, XP SD , SP SD and D(jb , n)2 are the power spectral densities (PSD) of the observed noisy signal, estimated speech signal and estimated noise signal respectively, X(jb , n) is the Fourier Transform of x(n), and Rss,n is the autocorrelation function of s(n). τ is a small value; in simulation in order to avoid the musical tone, we let τ = 0.3 instead of 1. The PSD of the noise signal is estimated by the following method. Let the pre-SNR, ρpre (jb , n), be ρpre (jb , n) = 10 log10 max
h i2 n |X(jb , n)| − D(jb , n − 1) D(jb , n − 1)2
,
o (24) ε .
Next, we obtain the estimate of noise spectrum as follows αn D(jb , n − 1) + (1 − αn )|X(jb , n)|, if ρpre (jb , n) < Ω; D(jb , n) = D(jb , n − 1), if ρpre (jb , n) ≥ Ω (25) where parameter αn denotes the forgetting factor, and Ω is the threshold used to identify absence of speech signal. 3.3. Incorporating masking into subband Kalman filtering The normalized masking threshold, Tˆn , is shown as follows T (λ, l) − Tmin (l) Tˆn (λ, l) = Tmax (l) − Tmin (l)
(26)
where λ is the critical band number, and l is the frame number. The normalized masking threshold in the Bark domain has its corresponding expression Tf in the frequency domain, i.e., Tf (Jf , l) = Tˆn (λ, l). (27) Just like most masking-based speech enhancement methods, noise masking threshold T (λ, l) has to be obtained from a speech signal. We therefore determine T (λ, l) from an estimated speech signal which is obtained using the normal a posteriori spectral subtraction method. The relation between the uniform subband frequency jb and full band frequency bin Jf is given as follows Jf =
jb Nf ull (k + ) L Nf sub
(28)
where Nf ull and Nf sub indicate the total number of bins of full band and the k-th subband respectively. The masking threshold, Ts (jb ), corresponding to frequency jb in the k-th band can then be obtained by Ts (jb ) = Tf (
jb Nf ull (k + )). L Nf sub
(29)
In our proposed speech enhancement system using Kalman filtering, the control of noise reduction for speech enhancement is based on the level of noise variance, σu2 . The observation from a series of simulation suggests that when an accurate noise variance is found, proper adjustment of the variance by multiplying it by a factor can change the extent of noise reduction in the enhanced speech. When the factor is close to 1− , the reduction of noise will be decreased; while the factor is close to 1+ , the reduction of noise will be increased. Here the masking effect considered is due to simultaneous frequency masking and the masking threshold is a function of critical band λ. As critical bands are non-uniform in frequency spacing, a non-uniform analysis filter bank has to be designed to match exactly the critical bands. However, this leads to more complex system design and higher computation cost. Instead, the more well known uniform analysis filter bank approach is considered in our study. It is also noted that the higher the number of subbands, the better is the frequency resolution and consequently the closer is the matching between the uniform band-edges and the critical band-edges. In this paper, we select 8, 16 and 32 uniform subbands with 8 kHz sampling rate in our design. From the above analysis, we propose that the PSD of noise signal be modified as a function of masking threshold as shown below © ª2 NP SD (jb , n) = αt1 [αt2 − Ts (jb )]D(1) (jb , n)
(30)
where αt1 and αt2 are constants set to 0.35 and 3.00 respectively, the superscript (1) in D(1) (jb , n) denotes the firstiteration estimate of noise power density. In other words, NP SD (jb , n) is only estimated during first time iteration (or original noisy signal as input). Subsequently, the modified noise autocorrelation can be obtained by © ª RN,n (i) = IDF T NP SD (jb = 1 : Nf sub , n) (31) and the modified noise variance, σu2 (n), is given by σu2 (n)
©
= E |v(n) −
q X
b∗i (n)v(n − i)|2
ª
i=1
= RN,n (0) − 2Re
q ©X
ª b∗i RN,n (i)
(32)
i=1
+
q X q X
b∗i bj RN,n (i − j).
i=1 j=1
4. PERFORMANCE EVALUATION The effectiveness of the enhancement algorithms is evaluated at the sampling rate of 8kHz which is down-sampled from 16 kHz utterances from the TIMIT database after prefiltering. For our proposed algorithm with 8kHz sampling rate, the frame size used for masking (full band domain) is
Table 1. Segmental SNR and PESQ of Speech Enhanced By MM: E-M
4
4
3.5
3.5
Frequency (kHz)
BN=16, IT=4), and SMK: Our proposed Method ((p, q)=(1,1), BN=16, IT=4) with Colored Noise (interior Volvo car noise), Noisy Input Segmental
2.5 2 1.5
Segmental SNR(dB)
1 0.5
0 0
0.2
0.4
0.6
0.8
1
1.2
1.4
1.6
1.8
Time (Sec.)
PESQ
0 0
(b)
4 3.5
3.5
2.77
3.13
3.80
MM
3.18
6.26
12.59
3.05
3.52
4.01
OM
5.37
7.98
13.56
3.03
3.43
3.93
FK
6.23
8.15
12.62
3.12
3.57
4.03
SK
6.71
8.58
13.01
3.19
3.68
4.08
7.01
9.27
14.03
3.32
3.73
2 1.5
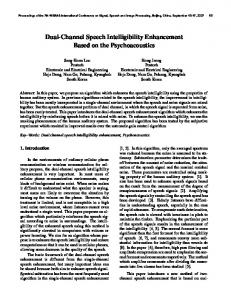
256 samples (32 ms), and the frame size used for spectral estimation in each subband is 256 L samples. We use our proposed method (with band number (BN) =16, (p, q) = (1, 1) at the fourth iteration (IT)) for comparisons with other existing methods. Tables 1 shows the results obtained. It can be seen that our proposed method is consistently better than the other methods in terms of the segmental SNR and perceptual evaluation of speech quality (PESQ, ITU-T P.862) measurement, based on the speech signals of 30 phonetically balanced speech utterances. Figure 1 shows the spectrograms of clean speech, noisy speech, speech enhanced by over-subtraction masking [4], the standard Kalman method ((p, q) = (10, 5)) [3] and our proposed method. Informal subjective listening tests which we have conducted also yield similar findings. In particular, undesirable “musical” noise can be heard in the enhanced speech obtained with spectral subtraction, but not from that obtained by our proposed method.
1
5. CONCLUSION In this paper, an effective speech enhancement system for car mobile communication has been introduced. It employs subband Kalman filtering and exploits the masking properties of the human auditory system. The improvement arising from the use of masking properties is significant. It follows an inherent improvement of Kalman filtering in the subband domain that is characterized by low computational complexity and higher SNR over the full band case. Our system is proven a good performance for estimation of weak speech spectral components. Our simulation results confirm that the proposed algorithm outperforms many conventional speech enhancement algorithms in terms of objective and subjective measures.
0.2
0.4
0.6
0.8
1
1.2
1.4
1.6
1.8
Time (Sec.)
0 0
(d)
4
4
3.5
3.5
1.4
1.6
1.8
0.2
0.4
0.6
0.8
1
1.2
1.4
1.6
1.8
3
2.5 2 1.5
2.5 2 1.5
1
1
0.5
0.5
0 0
1.2
Time (Sec.)
3
(e)
1
2
0.5
4.10
0.8
1.5
1
0 0
0.6
2.5
0.5
Frequency (kHz)
SMK
2.5
(c)
0.4
3
Frequency (kHz)
5
Frequency (kHz)
-5
Frequency (kHz)
-10
0.2
Time (Sec.)
4 3.5 3 2.5 2 1.5 1 0.5 0 00.5 11.5 Time (Sec.)4
3
Noisy
2 1.5
1
(a)
SNR: -10 dB, -5 dB, and 5 dB
2.5
0.5
Frequency (kHz)
filtering ((p, q)=(10,5), IT=4), SK: Subband Kalman filtering ((p, q)=(1,1),
3
Frequency (kHz)
3
MMSE, OM: Over-subtraction masking, FK: Standard (full band) Kalman
0.2
0.4
0.6
0.8
1
Time (Sec.)
1.2
1.4
1.6
1.8
(f)
0 0
0.2
0.4
0.6
0.8
1
1.2
1.4
1.6
1.8
Time (Sec.)
Fig. 1. Speech spectrograms (8kHz sampling rate): (a) Clean Speech (b) Noisy speech; (interior Volvo car noise) (c) Spectral subtraction; (d) Oversubtraction masking method; (e) Full band standard Kalman filtering; (f) Proposed masking-based subband Kalman filtering.
6. REFERENCES [1] Y. Ephraim and D. Malah, “Speech Enhancement Using a Minimum Mean-Square Error Short-Time Spectral Amplitude Estimator,” IEEE Trans. Acoustics, Speech, Signal Processing, Vol. ASSP-32, No. 6, pp. 1109-1121, Dec. 1984. [2] W.R. Wu and P.C. Chen, “Subband Kalman Filtering for Speech Enhancement,” Ieee Trans. On Circuits And SystemsIi: Analog And Digital Signal Processing, Vol. 45, no. 8, pp. 1072-1083, Aug. 1998. [3] J.D. Gibson, B.Koo, and S.D. Gray, “Filtering of Colored Noise for Speech Enhancement and Coding,” IEEE Trans. Signal Processing, Vol. 39, No. 8, pp. 1732-1742, Aug.1991. [4] N. Virag, “Single Channel Speech Enhancement Based on Masking Properties of the Human Auditory System,” IEEE Trans. Speech and Audio Processing, Vol. 7, No.2, pp. 126-137, Mar. 1999. [5] T. Q. Nguyen, “Near-Perfect-Reconstruction PseudoQMF Bank,” IEEE Trans. Signal Processing, vol. 42, pp. 65-76, Jan. 1994.