Oct 15, 2008 - Table 1 shows instance from the result of design elements study. Body Bg Color. Page Style. Dominant Item. Picture Size. Picture Focus.
Lokman, A.M., Noor, N.M., Nagamachi, M. (2008). " Kansei Database System For Emotional Interface Design Of E-Commerce Website." The Fourth International Cyberspace Conference on Ergonomics (Cyberg 08). Online Conference. (15 Spet. - 15 Oct., 2008).
Kansei Database System For Emotional Interface Design Of E-Commerce Website ANITAWATI MOHD LOKMAN*, NOR LAILA MD NOOR*, MITSUO NAGAMACHI** *Universiti Teknologi MARA, 40450 Shah Alam, MALAYSIA **Kyushu University, JAPAN anita[at]tmsk.uitm.edu.my
Abstract - This paper discusses results of the study of emotional values in web design through the methodology of Kansei Engineering. An evaluation of visitor’s kansei towards clothing e-Commerce websites were conducted using pre-selected 35 e-Commerce websites, 40 Kansei Words as descriptors of emotional sensation organized in a 5-point Semantic Differential scale, rated by 120 participants. Factor Analysis, and Partial Least Square Analysis were then performed to uncover factors, Kansei Word’s structure and the relationship between Kansei and website design elements. The result enables the establishment of a design guideline presented in the form of Kansei Database System for emotional website interface. Additionally, the study proposed the construction of KanseiExpertWeb, KanseiCollaborativeWeb and KanseiHybridWeb. The database inspires the construction of computer systems as a design tool for Kansei e-Commerce website design, which enables researchers, users, designers, e-Commerce and other stakeholders to benefit the database in the production of emotional interface design of e-Commerce website. Additionally, the study presented a reference table, which revealed associations between consumer’s kansei and specimen. Keywords: Emotion, e-Commerce, Kansei Database System, Kansei Engineering, Interface design.
1
Introduction
The discipline of design science emphasizes the integration of cognitive, semantic and affective elements in the conception and development of designed products. Designers have begun to address affective or emotional elements in their products and significant amount of work is seen in the design of tangible products such as automobiles and electronic home appliances. However, the literature does not exhibit significant work on artifacts such as websites. In this paper, we report our research in the production of design guideline to the emotional interface design of e-Commerce website, which also referred to as Kansei e-Commerce website. Here, we demonstrate the use of Kansei Engineering (KE) to identify the emotional signature of websites and presents our empirical findings in supporting the use of KE as a means to incorporate the affective or emotional appeal into websites. The context of web application chosen for this work is the design of online clothing ecommerce websites where emotional appeal is assumed to be significant. Based on the result, we established a design guideline and present Kansei Database System (KDS) for emotional design of website interface. The study also introduce the deployment of KDS into KanseiExpertWeb, KanseiColaborativeWeb and KanseiHybridWeb database system. The database inspires the construction of computer systems for Kansei eCommerce website design, which enables researchers, users, designers, e-Commerce and other stakeholders to benefit the database in the production of emotional interface design of e-Commerce website.
2
Emotional interface design of e-commerce websites
HCI issues related to e-commerce applications were formerly focused on cognitive aspects of websites. Since the early work of Nielsen in the 1990s, the emphasis was on the qualities of usefulness and usability in producing good website design. Na Li and Ping Zhang [1] cited that most studies dedicated to e-Commerce website evaluation are based on two assumptions. The first assumption is that target customers spend at least a few minutes on a website and the second assumption is that good website features usually elicit positive cognitive evaluations and shopping experience. These assumptions have ignored the primary affective reaction or primary emotional responses towards the website. Echoing this concern, Na Li and Ping Zhang [1] stressed that online shopping behavior is a complex phenomena and recognized that affective reaction has been cited to be a factor that promotes online shopping. This is because e-commerce websites have gone beyond the function of conveying information to the extent of providing persuasive engagement with website visitors through the
lively process of perception, judgment and action. Affect has also been discussed in literatures as a factor found to influence decision-making, perception, attention, performance, cognition and etc [2, 3]. Align with these claims, we argue that e-Commerce websites should induce desirable consumer experience and emotion that influences users’ perception of the websites, to enhance visitor’s stickiness that promotes consumer conversions and retentions. This is ultimately targets to extend the outreach potential of the online business. Hence, we need to consider the emergence of the dimension of desirability in e-commerce website design. Desirability emerged from the realization of the need to have new measures of users’ experience driven by emotional factors [4, 5]. Donald Norman, an advocator of emotional design discussed the notion of emotional design through elements of visceral, behavioral and reflective factors [6]. His views, parallels the view of Englelsted (1989, as cited in Aboulafia and Bannon [7]) who discussed three temporal categories of emotions, namely affect, emotion, and sentiment. We argue that in terms of website emotional design for desirability, visceral factors or affect that is the emotional state that results from a response to the external stimuli is more pertinent. Mahlke and Thüring [8] studied affect and emotion as important parts of the users’ experience with interactive systems, aiming to consider emotional aspects in the interactive system design process. While admitting that emotion cannot be designed, they assert the importance of deriving a method for recognizing users’ emotion from emotional evaluation procedures. Despite the gained recognition, the subject of emotional appeal of websites or desirability is often neglected as designers tend to pay more attention to issues of usefulness and usability [9] due to the availability of established design methodology that addresses aspects of usefulness and usability. The design method that enables the incorporation of emotional design requirements is lacking. In addition, numerous studies conducted on emotional design tends to look at minimizing irrelevant emotions related to usability such as confusion, anger, anxiety and frustration [2]. Therefore, it is necessary to seek for a suitable design method to handle design requirements based on emotional signatures of websites.
3
Kansei Engineering
Kansei is a Japanese term that is used to express one’s impression towards artifact, situation and surrounding. Deeply rooted in the Japanese culture, direct translation of kansei is difficult but means the mental state where knowledge, feeling, and sentiment are harmonized [10, 11]. When adopted by other culture, kansei is simply described as the sense and sensitivity that evoked subjective pleasurable feelings from the interaction with an artefact [11, 12]. Kansei Engineering (KE) is a technology that combines kansei and the engineering realms to assimilate human kansei into product design with the target of producing of products that consumer will enjoy and be satisfied with. The focus of KE is to identify the kansei value of products that trigger and mediate emotional response. The KE process implements different techniques to link product emotions with product properties. In the process, the chosen product domain is mapped from both a semantic and physical perspective. In terms of a design methodology, the approach of KE is to organize design requirements around the emotions that embody users’ expectations and interaction [10, 11, 12]. Since it was first introduced by one of the author, Nagamachi, in the seventies, KE has been successfully used to incorporate the emotional appeal in the product design ranging from physical consumer products to IT artifacts. Due to its success in making the connection between designers and consumers of products, KE is a well accepted industrial design method in Japan and Korea. In Europe KE is gaining acceptance but is better known as emotional design.
4
Kansei Measurement
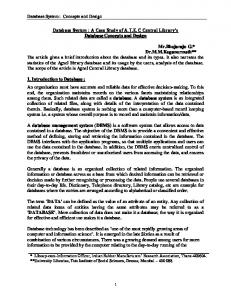
Based on the underlying concept of Kansei Engineering and literatures involving the adoption of Kansei Engineering, we present a model of Kansei Engineering implementation in e-Commerce website as shown Figure 1. Conforming to the model, to perform Kansei Engineering in e-Commerce website, one should begin with selecting a specific evaluation domain. This is because different domain will induce different Kansei respectively. Failing which will lead to confusion during measurement and classification of design element, which will cause an invalid result. The domain addressed in Kansei Engineering does not refer to a particular industrial field, such as car or electronic appliance, but a more specific group of product that have same design
viewpoint [11]. Similarly for websites, one must carefully control and narrow down their investigation to a specific domain.
Adorabl
Selection of specific domain in e-Commerce
Beautiful Appealing
Synthesize specimen
Synthesize Kansei Words
Kansei Measurement
Analysi
Kansei e-Commerce website
Figure 1: Model of Kansei Engineering implementation in e-Commerce website Since Kansei is the state of consumer’s internal sensation, the measurement process can be very challenging. Kansei Engineering provides diverse method to measure consumer’s sensation, namely brain waves by electroencephalogram (EEG), muscular loads measurement by electromyography (EMG), eye movement and self-reporting system such as Different Emotional Scale (DES), Semantic Differential (SD) scale or free labeling system. In the measurement of visitor’s Kansei in e-Commerce website, measurements are psychological which deals with human emotional state. Hence, the most suitable measurement method is by self-reporting system. This is done by using words that describe the emotional expression associated to e-Commerce website. In Kansei Engineering, this expression is called Kansei Word (KW) [11]. Possible sources of KW can be of any or all but not restricted to; Web developer / designer, pertinent literature, experienced website user, the expert, related study, technical magazine or journal. For the quantification of subjective consumer’s emotion, the Osgood Semantic Differential scale is recommended. On the other hand, to enable interpretation of Kansei responses, one need to identify the e-Commerce website detail design element. Compilation of these design elements can be done through self-investigation system. Once the KWs are set and the design elements are compiled, evaluation can be performed to find association between the KW and design elements. The expected result will not be as one to one association, but most probably one KW is associated with few design elements. For example, the word elegant may be associated with elements of background color, typography, and image size. The synthesized result will provide guidelines on how to induce Kansei into website design. Before the evaluation, subjects must be carefully selected in order to obtain accurate input in the Kansei measurement process. Correspondingly, the most appropriate subject group for e-Commerce website evaluation is web users. This is inline with Kansei Engineering principle to investigate and induce specific end-user’s Kansei into product design.
4.1
Research Method
We conducted two studies: the identification of detail design elements and measurement of visitors’ emotional feelings (kansei) towards online clothing websites. For the kansei measurement, we adopted the Kansei Engineering method described in earlier section. The visitors kansei and website specimen were then analyzed to identify associations between kansei and web design elements. Subsequently, kansei and the website samples are mapped to determine the kansei cluster.
4.2
Research Instrument
Initially, one hundred and sixty three online clothing websites were selected based on their visible differences in design such as in colors, layouts, page orientations, and typography. An investigation was conducted to identify detail design elements in all websites in the context of what consumer’s see in the external feature of a website. As a result, the study has identified 77 categories in design element, and 249 items as specified values in each design category identifiable from all websites. Table 1 shows instance from the result of design elements study. Body Bg Color Lt Website White Black Brown Grey 1 1 0 0 0 0 2 1 0 0 0 0 3 0 0 0 1 0 4 1 0 0 0 0 5 1 0 0 0 0 6 1 0 0 0 0 7 1 0 0 0 0 8 1 0 0 0 0 9 1 0 0 0 0 10 0 1 0 0 0 11 1 0 0 0 0 12 0 1 0 0 0 13 1 0 0 0 0 14 1 0 0 0 0
Lt 0 0 0 0 0 0 0 0 0 0 0 0 0 0
Page Style Dominant Item Picture Size Picture Focus Frame Table None Picture Ads. Text Small Medium Large Mix Breast Hip Full 0 1 0 1 0 0 0 0 0 1 0 1 0 0 1 0 0 1 0 0 0 0 1 0 0 1 0 1 0 1 0 0 0 0 1 0 0 0 0 0 1 0 0 0 1 0 0 1 0 0 0 0 1 0 0 1 0 0 0 1 0 0 0 0 0 0 1 0 0 0 1 1 0 0 0 0 0 1 0 1 0 1 0 0 0 0 0 1 0 0 0 0 1 0 1 0 0 0 0 1 0 0 0 0 0 1 0 0 0 0 1 0 0 0 0 0 1 0 1 0 1 0 0 0 1 0 0 0 0 0 0 1 0 0 0 0 0 0 0 1 0 0 0 0 1 0 0 0 1 0 1 0 0 0 0 0 1 0 0 0 1 0 0 0 0 1 0 0 1 0 1 0 0 0 0 1 0 0 0 0 0 0
Table 1: Detail design elements All websites were then analyzed following a set of predefined rules in the study. From the analysis, 35 website specimens were finally used. The specimen are coded numerically from one to thirty-five, and snapshot of the specimen are shown in table 2. ID Specimen
ID
1
8
Specimen
ID 15
Specimen
ID 22
Specimen
29
2
9
16
23
30
3
10
17
24
31
4
11
18
25
32
5
12
19
26
33
6
13
20
27
34
7
14
21
28
35
Table 2: Specimen and code.
ID
Specimen
Kansei Words, which are used to represent emotional responses were synthesized according to web design guidebook, experts and pertinent literatures. 40 Kansei Words were then selected according to their suitability to describe website. Among the synthesized words are adorable, professional, impressive and etc. These Kansei Words were used to developed checklist to rate websites. The kansei checklist developed was organized in a 5point Semantic Differential (SD) scale.
4.3
Participants
One hundred and twenty undergraduate students from the Faculty of Information Technology and Quantitative Science, Faculty of Architecture, Building, Planning and Survey, Faculty of Business and Management and Faculty of Electrical Engineering from the researchers’ university participated in the kansei evaluation. From each faculty, exactly thirty students consisting of fifteen males and fifteen females were recruited. All of them have prior experience as web users.
4.4
Procedure
The participants were grouped according to their faculties. Four kansei evaluation sessions were held separately for each group. During each session a briefing was given before the participants began their evaluation exercise. The thirty five website specimens were shown one by one in a large white screen to all participants in a systematic and controlled manner. Participants were asked to rate their feelings into the checklist according to the given scale. Participants were given three minutes to rate their feelings towards each specimen. They were given a break after the fifteenth website specimen, to refresh their minds. The order of checklist was also change to avoid bias. Each kansei evaluation session took approximately 2 hours to complete.
5
Results
Factor Analysis and Partial Least Square Analysis were performed using the average evaluation results between subjects, to identify associations between Kansei and design elements, and determine specimen’s kansei.
5.1
Factor Analysis (FA)
FA is a statistical data reduction technique used to explain variability among observed random variables in terms of fewer unobserved random variables called factors. FA assumes that all the rating data on different attributes can be reduced down to a few important dimensions. This reduction is possible because the attributes are related. The rating given to any one attribute is partially the result of the influence of other attributes. In this research, FA is used to find psychological structure of Kansei space, and detail result on weighted axes. The detail of Kansei space were investigated using the average value of evaluation results. Table 2 shows result of Factor Analysis after varimax rotation. Varimax, which was developed by Kaiser (1958), is the most popular rotation method that simplifies the interpretation of variables. This is because, after a varimax rotation, each original variable tends to be associated with one (or a small number) of factors, and each factor represents only a small number of variables. In addition, the factors can often be interpreted from the opposition of few variables with positive loadings to few variables with negative loadings. Factors 1 2 3 4 5 6 7 8
Variance 16.09262 12.29421 3.427578 1.856272 1.810882 0.923415 0.370649 0.250962
Contribution 40.23% 30.74% 8.57% 4.64% 4.53% 2.31% 0.93% 0.63%
Cummulative Contribution 40.23% 70.97% 79.54% 84.18% 88.70% 91.01% 91.94% 92.57%
Table 3: Contribution and cumulative contribution table In table 3, it is evident that the first factor explains 40.23% of the data and the second factor explains 30.74% of the data. Both factors represents majority of factor contributions. This shows that Factor1 and Factor2 have
dominant effect on Kansei Words. The first two factors together represent 70.97% of the variability while three factors explain 79.54% of the variability. Inclusion of the third factor is deemed considerable, and therefore the first three factors could explain most of the data. The proportion of variability explained by the fourth factor and above is minimal (4.64, 4.53, 2.31, etc respectively) and they can be eliminated as being insignificant. The following table shows partial result of factor analysis after varimax rotation. The table shows factor results in ascending order. VAR F1 Cute Refreshng Relaxing Fun Charming Lively Adorable Pretty Comfort Elegant Lovely Appealing Interesting Calm Stylish Creative Classic
VAR F2 0.4961Creative 0.5314Surreal 0.5420Profesnal 0.5845Calm 0.6085Cool 0.6090Sophisti 0.6346Fun 0.6449Impressiv 0.6518Light 0.6543Comforta 0.6707Gorgeous 0.6847Interesting 0.7156Stylish 0.7464Refreshng 0.7599Relaxing 0.7773Lively 0.7943Appealing
VAR F3 0.3969Feminine 0.4037Childish 0.4220Adorable 0.4323Cool 0.4529Cute 0.4544Charming 0.4850Appealing 0.4991Stylish 0.5166Elegant 0.5178Pretty 0.5353Interesting 0.5751Profesnal 0.5933Mystic 0.6014Surreal 0.6598Old-fash 0.6778Comfort 0.6825Refreshng
VAR F4 0.0012Calm 0.0311Neat 0.0506Lovely 0.0506Beautiful 0.0523Charming 0.0531Natural 0.0706Gorgeous 0.0751Creative 0.0763Stylish 0.0781Pretty 0.0806Cute 0.1017Chic 0.1446Futuristic 0.1524Surreal 0.1730Profesnal 0.1943Appealing 0.2042Relaxing
VAR F5 0.0467Fun 0.0586Gorgeous 0.0723Impressiv 0.0794Adorable 0.0996Cute 0.1035Appealing 0.1147Masculine 0.1174Charming 0.1185Luxury 0.1220Elegant 0.1223Simple 0.1316Classic 0.1426Old-fash 0.1444Interesting 0.1516Pretty 0.1678Profesnal 0.1949Plain
VAR F6 0.0539Lovely -0.0503 0.0593Charming -0.0477 0.0703Relaxing -0.0436 0.0735Neat -0.0265 0.0799Feminine -0.0251 0.0806Refreshng -0.0210 0.0809Mystic -0.0184 0.0865Impressiv -0.0107 0.0897Comfort -0.0059 0.1111Lively -0.0044 0.1203Appealing 0.0037 0.1387Interesting 0.0092 0.1632Surreal 0.0151 0.1662Cool 0.0179 0.1834Simple 0.0297 0.1914Boring 0.0326 0.1980Crowded 0.0405
Profesnal Cool
0.8058 Pretty 0.8113 Lovely
0.6895Sexy 0.6900Classic
0.2729Impressiv 0.2754Masculine
0.2029Lively 0.2114Lovely
0.2016Adorable 0.2079Creative
0.0461 0.0551
Gorgeous Impressiv Surreal Sophisti Luxury Masculin
0.8128Elegant 0.8227Adorable 0.8464Charming 0.8484Sexy 0.8788Cute 0.8991Beautiful
0.7034 Boring 0.7130 Light 0.7637 Neat 0.7876 Calm 0.7941 Relaxing 0.8170 Natural
0.3086Adorable 0.3138Cool 0.3193Interesting 0.3392Comfort 0.3485Lively 0.4249Refreshng
0.2118Beautiful 0.2842Relaxing 0.3081Light 0.3204Calm 0.3285Comfort 0.3909Refreshng
0.2394Classic 0.2474Light 0.2747Plain 0.3026Chic 0.3286Old-fash 0.3548Fun
0.0631 0.0664 0.0667 0.1311 0.1441 0.2227
Futuristic
0.9132Chic
0.9392Plain
0.8390 Fun
0.5000 Natural
0.6050 Cute
0.2767
Table 4: Factor Analysis result for Kansei Words
The structure of Kansei Words are observable in the analysis result. It is evident from the table that sample websites Kansei are structured by 5 factors. The first factor consists of professional, cool, gorgeous, impressive, surreal, sophisticated, luxury, masculine, futuristic and mystic. This Kansei space could be represented as ‘sophisticated’. The second factor consists of elegant, adorable, charming, sexy, cute, beautiful, chic and feminine. This Kansei space could be represented as ‘elegant-beauty’. The third factor consists of plain and simple, and therefore it could be represented as ‘simplicity’ Kansei space. The fourth factor consists of light, and therefore could be represented as ‘richness’ Kansei space. The fifth factor consist of natural and neat, and could be represented as ‘comfy’ Kansei space. The result demonstrates that website samples are structured by five factors; sophisticated, elegant-beauty, simplicity, richness and comfy. These five factors altogether explains 88.70% of the total data. Factor Analysis demonstrates that the first, second and third factors explain most of data, i.e. sophisticated, elegant-beauty and simplicity, represent 79.54% of data. This means that this first three factors are very important Kansei space. It suggests that all websites should have these three factors in order to gain good business appeal. The fourth and fifth factors, richness and comfy, are also important but have weak influence. Therefore, these two factors are suggested to be used as background / supporting features in good website design.
5.2
Partial Least Squares (PLS) Analysis
PLS is a method for constructing predictive models when the factors are many and highly collinear, and the interactions between x variables are heavy. The nature of this study best suited this analysis method, and PLS analysis were performed to identify associations between Kansei and web design element. The following describes partial results of PLS analysis. Category Body Bg Color
Body Bg Style
Page Shape Page Menu Shape
Page Style
Page Orientation
Dominant Item
Page Color
Item White Black Dk Brown Lt Brown Grey Lt Blue Picture Texture Color Tone Sharp N/S Curve Sharp Mix Frame Table None Banner-Content Content Header Footer Horizontal-Split Vertical-Split Plain Picture Advertisement Text N/S White Blue Black Pink Grey Colorfull Brown N/S
Adorable Range Appealing Range Beautiful Range Boring Range -0.03649 0.10015 -0.03670 0.10574 -0.01732 0.06569 0.02740 0.06968 0.00605 0.01114 -0.01314 -0.00356 0.06366 0.06904 0.02000 -0.04228 0.01247 0.00987 -0.00432 0.00348 0.02467 0.03151 0.04837 -0.03951 0.02520 0.00995 0.01758 -0.01612 -0.00504 0.03755 -0.00972 0.03096 -0.00153 0.02760 -0.01272 0.05540 0.03251 0.02066 0.01801 -0.06811 0.00881 0.02123 0.02607 -0.03242 0.02780 0.05560 0.02998 0.05997 0.02159 0.04319 -0.02046 0.04093 -0.02780 -0.02998 -0.02159 0.02046 0.00398 0.04094 -0.00686 0.02953 0.00807 0.06454 -0.00940 0.06019 -0.01401 -0.00420 -0.02303 0.02247 0.02693 0.02267 0.04151 -0.03773 0.03191 0.07782 0.02432 0.07020 0.02631 0.04929 -0.03636 0.07783 -0.04161 -0.03566 -0.02298 0.04147 0.03621 0.03455 0.00991 -0.03082 -0.04047 0.07705 -0.03718 0.09182 -0.02923 0.06176 0.02751 0.07709 -0.00748 -0.01118 -0.01759 0.04718 -0.05149 -0.05402 -0.03114 0.03572 0.01230 0.01128 0.02339 -0.01381 0.01914 0.01751 0.00314 -0.01527 0.02281 0.03780 0.03062 -0.02991 0.02556 0.02030 0.01075 -0.01720 0.04672 0.09980 0.04769 0.09141 0.03111 0.05634 -0.04436 0.09126 -0.03070 -0.03236 -0.01779 0.02500 -0.05308 -0.04371 -0.02523 0.04690 -0.01924 -0.02637 -0.02191 0.02371 -0.07098 0.11488 -0.06051 0.10091 -0.05233 0.08049 0.08195 0.12061 0.03249 0.02742 0.02478 -0.02271 0.00149 0.00389 -0.01037 0.01080 -0.00044 0.00531 0.02094 -0.03851 0.04368 0.03846 0.02816 -0.03155 0.01369 0.00798 0.02084 -0.03866 0.04391 0.04041 0.01276 -0.02166 0.00240 -0.00353 0.01213 -0.02476 : Highest value
:
Lowest
Table 5: PLS result for design element and kansei Table 5 shows part of PLS analysis result shown in terms best of scores for design elements in respective kansei. The first column lists design ‘Category’, which are the design elements of specimen identified in the preliminary study. The second column lists design ‘Item’, which are the value of the identified elements. The third column shows the score of each ‘Item’. In each ‘Item’, largest positive PLS score indicates elements leading to good design, and largest negative value indicates elements leading to bad design. In the table, each of maximum and minimum values is highlighted in purple and pink respectively. This translates most appropriate design value for a particular Kansei. For instance, best body background color that leads to the Kansei ‘Adorable’, is ‘Dark Brown’, and color that must be avoided is ‘White’. Best dominant element to include in targeting ‘Adorable’ website is ‘Picture’, and element to avoid is ‘Text’. The rest of the results follow accordingly. The column ‘RANGE’ lists range value for each design category in each Kansei. Range is calculated using maximum and minimum value, where Range = PLSMax - |PLSMin|
Mean of range is calculated, where
Range =
1 n ∑ Rangei n i =1
Each Kansei has means of Range, and if the mean score of an ‘Item’ is larger than Range , the item will have influence as the good design. From the result, Range for every ‘Category’ having value bigger than
Range , implies the appropriate ‘Design Element’ which influence consumer’s Kansei in website design. The rest of Kansei follows accordingly. Kansei Infl. No. 1 2 3 4 5 6 7 8 9 10 11 12 13 14 15 16 17 18 19 20 21 22 23 24 25 26 27 28 29 30 31 32 33 34 35
Adorable Design Element Page Color Product Disp. Style Hdr Menu Bg Clr Lft Menu Font Clr Header Bg Color Face Expression Body Bg Color Dominant Item Header Font Size Main Txt Existence Main Bg Color Main Font Style Main Font Size Right Menu Link St Picture Arrangemnt Picture Existence Page Style Picture Style Page Orientation Picture Focus Page Size Top Menu Bg Color Top Menu Location Hdr Menu Link St Main Font Color Image of? Fter Menu Bg Color Artistic Menu? Left Menu Link St No of people in pict Product view angle Logo Location Empty Space? Other Images? Fter Menu Font Clr
Range 0.11488 0.10644 0.10612 0.10370 0.10218 0.10024 0.10015 0.09980 0.09651 0.08813 0.08587 0.08582 0.08324 0.07868 0.07865 0.07838 0.07782 0.07776 0.07705 0.07658 0.07572 0.07260 0.07131 0.06990 0.06945 0.06919 0.06871 0.06774 0.06719 0.06478 0.06422 0.06360 0.06176 0.06093 0.05864
Appealing Design Element Header Bg Color Face Expression Hdr Menu Bg Clr Product Display Style Body Bg Color Page Color Left Menu Font Color Picture Style Page Orientation Dominant Item Main Text Existence Main Font Size Header Font Size Logo Location Picture Existence Main Bg Color Main Font Style Main Font Color Footer Menu Bg Clr Picture Arrangement Image of? Picture Focus Left Menu Link St No of people in pict Page Size Top Menu Bg Color Page Style Artistic Menu? Fter Menu Font Clr Top Menu Location Empty Space? Header Menu Link St Product view angle Page Shape Right Menu Link St
Range 0.12338 0.12216 0.12077 0.10646 0.10574 0.10091 0.10085 0.09771 0.09182 0.09141 0.08811 0.08397 0.08359 0.08352 0.08208 0.08194 0.08092 0.07968 0.07852 0.07785 0.07743 0.07635 0.07471 0.07193 0.07095 0.07025 0.07020 0.06968 0.06814 0.06789 0.06459 0.06221 0.06136 0.05997 0.05895
Beautiful Design Element Picture Existence Header Bg Color Page Color Left Menu Link St Main Font Size Main Font Style Product view angle Product Display St Body Bg Color Page Menu Shape Fter Menu Font Clr Lft Menu Font Clr Page Orientation Picture Dimension Dominant Item Body Representation Face Expression Main Text Alignmnt Main Bg Color Page Style Hdr Menu Link St Other Images? Picture Focus Page Size Fter Menu Bg Clr Main Text Existnce Right Menu Link St Picture Arrangement Face facing? Artistic Menu? Page Shape Image of? Picture Style Logo Location Left Menu Bg Color
Range 0.09660 0.08531 0.08049 0.07868 0.07780 0.07307 0.06714 0.06624 0.06569 0.06454 0.06441 0.06422 0.06176 0.05774 0.05634 0.05582 0.05531 0.05309 0.05260 0.04929 0.04898 0.04886 0.04868 0.04832 0.04548 0.04539 0.04470 0.04428 0.04412 0.04370 0.04319 0.04175 0.04135 0.04011 0.04007
Boring Design Element Picture Existence Fter Menu Font Clr Product view angle Header Bg Color Page Color Left Menu Font Clr Product Display Style Picture Style Top Menu Bg Color Main Text Existence Main Font Style Dominant Item Empty Space? Main Font Size Face Expression Main Bg Color Hder Menu Bg Clr Page Style Page Orientation Left Menu Link St Face facing? Left Menu Bg Color Fter Menu Bg Color Body Bg Color Main Font Face Left Menu Font Size Main Font Color Artistic Menu? Top Menu Link Type Hdr Menu Link St Top Menu Font Style Page Menu Shape Page Size Right Menu Link St Header Font Size
Range 0.14714 0.14382 0.13200 0.12532 0.12061 0.11534 0.11351 0.10189 0.09507 0.09380 0.09253 0.09126 0.08926 0.08588 0.08456 0.08322 0.08016 0.07783 0.07709 0.07530 0.07418 0.07222 0.07166 0.06968 0.06838 0.06794 0.06594 0.06432 0.06283 0.06223 0.06058 0.06019 0.05958 0.05953 0.05937
Table 6: Dominant design elements in each kansei Table 6 shows part of the result of the selected ‘Design Element’, which Range value is bigger than Range , for each Kansei. The results are sorted in descending order to demonstrate dominant design element from highest to lowest for each Kansei. The following table 7 illustrates part of the result of PLS score for each Kansei in relation to each sample website. In the table, largest positive value indicates website sample that best fit to the Kansei. On the other hand, largest negative value indicates most unfit website sample to the Kansei. In the table, both values are indicated in purple and pink color respectively. The result has made it possible for the study to discover and visualize which specimen highly induces what kind of consumer’s kansei.
ID Adorable Beautiful Boring
Calm
Charming
Chic
Childish Classic
Comfortable
1
3.23352
3.14276 2.39434 2.77595
2.93343 3.41967
2.06980 2.01726
3.02852
2
2.72056
2.94337 2.84746 2.70364
2.81997 2.82017
1.94619 2.08152
2.97260
3
3.68517
3.30493 2.66730 3.52251
3.55746 3.07788
2.11046 3.84500
3.60832
4
2.52333
2.92539 3.32273 2.83322
2.56347 2.45115
2.19049 2.20374
3.06234
5
3.06786
2.98098 2.83406 2.67317
2.66387 3.11172
3.12506 2.18806
3.00666
6
2.34030
2.58091 3.56973 2.66560
2.25456 2.12376
1.94987 2.79467
2.88071
7
3.16084
3.25413 2.58095 2.77491
2.90715 2.73127
1.85056 2.39251
3.20750
8
3.49967
3.35909 2.30261 3.32644
3.33457 2.66034
1.77639 2.57945
3.62130
9
2.65392
2.84483 3.31682 2.74922
2.23772 2.26767
2.05169 2.76947
2.95566
10
3.31305
3.00556 2.72732 3.49567
3.19025 2.33509
2.16910 3.48942
3.37944
11
2.96722
2.96223 3.08820 2.88259
2.68545 2.74939
2.23403 2.38529
3.61080
12
3.26369
3.43048 2.40299 3.16667
3.22916 2.85788
2.20716 3.31311
3.32008
13
2.87722
2.95498 3.19583 2.87777
2.57862 2.40100
2.45270 2.52575
3.25847
14
2.12599
2.69230 3.72111 2.68575
1.95756 2.04703
2.54259 2.33220
2.90018
15
3.32669
3.54718 2.44541 3.02450
3.12673 3.17880
2.07064 2.29411
3.16920
16
4.00896
3.66163 1.97005 3.56817
3.69670 3.20662
2.12679 3.40523
3.98117
17
3.88432
3.43218 2.31150 3.66133
3.69804 2.95288
2.11578 3.47594
3.96854
18
3.57208
3.21562 2.83233 3.49431
3.50153 2.81826
2.28145 3.95078
3.74056
19
3.62704
3.34410 2.34575 3.41167
3.44553 2.91245
2.44160 3.32148
3.73072
20
3.29579
3.24288 2.64988 3.37847
3.00881 2.60645
2.02792 2.62835
3.80632
21
2.89860
3.03359 3.17416 2.86390
2.75191 2.60149
2.01186 2.63597
3.02998
22
2.70295
2.65321 3.16572 2.75098
2.36060 2.01275
1.87660 2.45218
2.90928
23
2.82689
2.61171 3.50018 3.25762
2.20954 1.99025
2.26757 3.19859
3.21850
24
2.48816
2.48702 3.52643 2.66128
2.20659 2.01739
2.06610 2.45412
2.82323
25
3.79941
3.55885 2.37384 3.49784
3.70739 3.10873
2.10398 3.21922
3.79387
26
2.93272
3.22082 2.86249 2.62266
2.74952 3.03113
2.13778 2.42942
3.09308
Table 7: Specimen’s kansei As evident from the table, specimen design that best fit to evoke the Kansei ‘Adorable’ is specimen no. 16. The most not ‘Adorable’ specimen is specimen no. 14. The best fit sample that induced the kansei ‘Calm’ is specimen no.17. The most not ‘Clam’ specimen is specimen no. 26. Table 8 illustrates 10 results for specimen and it’s kansei. No. 1
Specimen
Kansei Chic
No. 6
Specimen
2
Crowded
7
Sexy , Elegant, Feminine
3
Boring, old-fashion
8
Childish
4
Cool, Masculine, Calm
9
Relaxing, Charming
5
Stylish, Refreshing, Comfortable
10
Simple, Plain
Table 8: Specimen’s kansei reference table
Kansei Classic
5.3
Design Guideline
Factor Analysis has shown that the first three factors contribute ample score representing the whole variables. Despite the weak influence, the study has also suggested to include the following two factors as supporting features. Thus, the total factors decided to be included in the construction of design guideline is 5. The implicated factors consist of the kansei professional, cool, gorgeous, impressive, surreal, sophisticated, luxury, masculine, futuristic, mystic, elegant, adorable, charming, sexy, cute, beautiful, chic, feminine, plain, simple, light, natural and neat. Accordingly, the identified design elements and Kansei from PLS analysis is used to form the guideline to the emotional interface design of e-Commerce website. The following table shows partial result of the constructed guideline.
KANSEI ADORABLE BEAUTIFUL CHARMING LIGHT LUXURY MASCULINE MYSTIC NATURAL NEAT PLAIN PROFESSIONAL SEXY SIMPLE SOPHISTICATED SURREAL
Body Bg Color Dark Brown Grey Dk Brown Dark Brown Black Black Black Dark Brown Light Blue Dark Brown Dark Brown Dark Brown Dark Brown Grey Dark Brown
Body Bg Style Texture Color Tone Color Tone Texture Color Tone Color Tone Color Tone Color Tone Color Tone Picture Color Tone Color Tone Picture Texture Texture
Page Style None Frame None Frame None None None None Frame Table None None None None None
Desgin Element Page Orientation Dominant Item Plain Picture V. Split Picture V. Split Picture Content N/S Vertical Split Picture Header Picture Plain Picture Vertical Split Text Footer Text Content Text Vertical Split Picture Content Picture Content N/S Vertical Split Picture Vertical Split Picture
Page Color Brown Grey Grey Blue Black Blue Black Brown Blue Brown Blue Grey Brown Grey Grey
Page Size Small Small Small Small Small Medium Medium Medium Small Medium Small Small Medium Small Small
Logo Existence No No No No No No No Yes Yes No No Yes No No No
Table 9: Kansei e-Commerce interface design guideline
5.4
Database Construction
Results from the study enable the paper to construct Kansei Database System (KDS) to streamline the Kansei e-Commerce interface design guideline. The presented KDS consists of Kansei Word Database (KW DB), web Design Element Database (DEDB), LOGIC and Kansei Design Database (KDDB). The result of Kansei space identified from Factor Analysis is to be stored in KWDB. The result of design elements identified in the study of detail design elements are to be stored in DEDB. The result from dominant design elements and design guideline identified from both FA and PLS analysis is to be stored in LOGIC. Finally, as an underpinning guide to designing the intended Kansei website design, the PLS result for specimen’s Kansei is to stored in KDDB.
KDS DEDB KW DB
LOGIC KD DB
Figure 2: Kansei Database System (KDS)
In terms of deployment, this KDS enables the set-off of computer systems for e-Commerce web design. The proposed systems are Expert Kansei Web Design (KanseiExpertWeb), Collaborative Kansei Web Design (KanseiCollaborativeWeb) and Hybrid Kansei Web Design (KanseiHybridWeb).
5.4.1
Expert Kansei Web Design (KanseiExpertWeb)
The give an illustration of the proposed deployment, the paper describes KanseiExpertWeb. In this expert system, web design acquirer will input a KW via selection form a list of existing Kansei words into the Client Interface (CI). The KW will be processed to identify the semantic taxonomy in reference to the KW DB. Inference Engine will then handle the associated design with the KW, extract the design elements with the detail attributes from DDB and LOGIC, and send a design example to be displayed on CI. Further enhancement to the example can be proposed to the system in the form of design template. This template can later be saved for end use. The system structure of KanseiExpertWeb is illustrated as the following.
KDS DEDB
LOGIC
KW DB
KD DB
Kansei word processing
Template display
Inference Engine
System Controller CI
Kansei words input
Template output
Figure 3: System Structure for ExpertWeb
5.4.2 Collaborative Kansei Web Design (KanseiCollaborativeWeb) The main objective of Kansei Engineering is to reach optimum understanding between end-user’s requirements (emotion) and product design specification by designers. Hence, results from the study are proposed to be utilized as a basis in this KanseiCollaborativeWeb. The result can be used as a bench-mark to enhance mutual understanding between parties. A system can be structured so as to provide medium for client and web designers located in separate places to collaborate in the process of designing a website. In this system, a client input a KW by key input or via selection form a list of existing KW into web client interface. The system will check existence of KW. If it exists, then the KW will be processed to identify the semantic KW in reference to the KWDB. Inference Engine will then handle the associated design elements with the KW, extract the design elements with the detail attributes from DEDB and LOGIC, and send a proposed design to be displayed on the client browser. Client can then choose to accept the design or participate in examining the web design and express his kansei. Same process happens when a designer designs a new website. The new design will be sent to client, and client will examine and express his kansei against the web design. The process repeats until agreement can be achieved. Next, web designer must classify each design elements of the accepted website design and store them to the system. Later, the system will process and analyse data generated by both client and designer, and finalize the kansei web design which induces the client Kansei. As a result, not only KWDB will be updated, but also the web design will always be updated as accuracy of kansei advances. 5.4.3 Hybrid Kansei Web Design (KanseiHybridWeb) A system can also be structured in assisting web designers during the process of designing a website. As semantic KW, design elements and attributes are identified from the experiment and stored in the databases, designers can extract design element and attribute from the system as a basis in sketching his idea of a web
design. To help examine whether the targeted kansei is induced in his design, the designer can use the system to examine the web design through the means of e.g. image recognition system. The system will auto-examine the new web design and conclude the associated Kansei in reference to the KWDB, DEDB and LOGIC. This will help web designers identify his achievement of targeted kansei design. This kind of system is possible for use in training programs and evaluation process to certify a competent kansei web designer.
6
Conclusions
Many studies have proven that Kansei Engineering works very well in the engineering field. However, in the webspace, Kansei Engineering is still in its infancy. Isolated work has shown the possibility of incorporating emotional usability in the design of websites which draws on the new paradigm of producing desirable websites as opposed to common concentration on website functional usability and performance. The research explores the implementation of Kansei Engineering in the effort of embedding emotional signature in e-Commerce website design. Factor Analysis and Partial Least Squares analysis were performed to identify factors, Kansei Word’s structure, association between Kansei responses and design elements, and determine specimen’s kansei. The results from both analysis have made it possible for the study to produce a guideline for emotional interface design of e-Commerce website. The constructed guideline is then systematized into Kansei Database System (KDS). The presented KDS could be deployed to form different kind of standalone and distributed systems, providing knowledge sharing and easy access to the guideline. From the KDS, three system structure for kansei web design, i.e. the KanseiExpertWeb, KanseiCollaborativeWeb and KanseiHybridWeb were proposed, which form a decent contribution as a design tool in the production of emotional interface design of e-Commerce website. The study has also produced a table of reference into specimen’s kansei, which delivers significant contribution to the design of Kansei e-Commerce website. Nonetheless, this study were performed exclusively to the domain of clothing website, and subjects employed were young age group. Thus, the result may not represent the whole population of e-Commerce website and target market segment. We also perceive that the adoption of Kansei Engineering is not risk free. Since Kansei is highly dependent on the indigenous characteristics of cultural races, this study of engineering kansei into eCommerce websites may not produce globally accepted features. Consideration on the universal context of kansei will be considered in our future work.
Acknowledgement The research is funded by the Ministry of Higher Education Malaysia, under the FRGS grant scheme [Project Code: 5/3/2094].
References [1] Li, Na and Ping Zhang. Consumer Online Shopping Behavior, in Customer Relationship Management. Fjermestad, J. and Romano, N. (eds), Series of Advances in Management Information Systems, Zwass, V. (editor-in-chief), M.E. Sharpe Publisher, 2005. [2] Norman, D. A. Emotional Design: Attractive Things Work Better in Interactions: New Visions of Human-Computer Interaction, IX: pp. 36-42, 2002. [3] Tractinsky, N, Katz, A.S. and Ikar, D. What is Beautiful is Usable. Interacting with Computers, 13: . 127145, 2000. [4] Dillon, A. Beyond Usability: Process, Outcome and Affect in human computer interactions. Paper presented as the Lazerow Lecture 2001, University of Toronto, March 2001. [5] Spillers, F. Emotion as a Cognitive Artifact and the Design Implications for Products That are Perceived As Pleasurable, Experience Dynamics, 2004. [6] Norman, D. A. Emotional Design: Why We Love (or Hate) Everyday Things. New York: Basic Books, 2004. [7] Aboulafia, A., and Bannon, L. J. Understanding affect in design: an outline conceptual framework. Theoretical Issues in Ergonomics Science, 5(1), 4-15, 2004.
[8] Mahlke, S. & Thüring, M. Studying Antecedents of Emotional Experiences in Interactive Contexts. CHI 2007 Proceedings (pp. 915-918). New York: ACM Press, 2007. [9] Buchanan, R. Good Design in the Digital Age. AIGA Journal of Design for the Network Economy, 1(1), American Institute of Graphic Arts: pp: 1-5, 2000. [10] Anitawati, M. L. and Nor Laila, M.N. Kansei Engineering: A Study on Perception of Online Clothing Websites. Proceedings of the 10th International Conference on Quality Management and Operation Development 2008 (QMOD '07), Sweden: Linköping University Electronic Press, ISSN 1650-3740, 2007. [11] Nagamachi, M. The Story of Kansei Engineering (in Japanese), Japanese Standards Association, 6. Tokyo, 2003. [12] Nagasawa, S. Present State of Kansei Engineering in Japan. 2004 IEEE International Conference. Vol.1. pp:333-338, 2004.