Hindawi Publishing Corporation Mathematical Problems in Engineering Volume 2015, Article ID 915429, 27 pages http://dx.doi.org/10.1155/2015/915429
Research Article KD-ACP: A Software Framework for Social Computing in Emergency Management Bin Chen, Laobing Zhang, Gang Guo, and Xiaogang Qiu Research Center of Computational Experiments and Parallel System Technology, College of Information System and Management, National University of Defense Technology, Changsha 410073, China Correspondence should be addressed to Bin Chen;
[email protected] Received 4 June 2014; Accepted 23 August 2014 Academic Editor: Praveen Agarwal Copyright © 2015 Bin Chen et al. This is an open access article distributed under the Creative Commons Attribution License, which permits unrestricted use, distribution, and reproduction in any medium, provided the original work is properly cited. This paper addresses the application of a computational theory and related techniques for studying emergency management in social computing. We propose a novel software framework called KD-ACP. The framework provides a systematic and automatic platform for scientists to study the emergency management problems in three aspects: modelling the society in emergency scenario as the artificial society; investigating the emergency management problems by the repeat computational experiments; parallel execution between artificial society and the actual society managed by the decisions from computational experiments. The software framework is composed of a series of tools. These tools are categorized into three parts corresponding to “A,” “C,” and “P,” respectively. Using H1N1 epidemic in Beijing city as the case study, the modelling and data generating of Beijing city, experiments with settings of H1N1, and intervention measures and parallel execution by situation tool are implemented by KD-ACP. The results output by the software framework shows that the emergency response decisions can be tested to find a more optimal one through the computational experiments. In the end, the advantages of the KD-ACP and the future work are summarized in the conclusion.
1. Introduction Emergency management attracts the attention of scientists from social computing because the whole process of emergent events is deeply coupled with human society and the emergency response decisions need an approach to testify their effect without the reappearance of emergent events in the society. As a new paradigm of computing and technology development, social computing helps scientists to understand and analyze individual and organizational behavior and facilitate emergency management research and application in many aspects [1]. Based on the fruitful development of computational methodology on emergency management research over the last decade, lots of work has been done to solve the problems in society domain. Both the conceptual frameworks in multiple discipline and the technological platforms developed for the domain requirements are more and more popular in the research on emergency management, especially the agent-based modelling and simulation [2]. The bottom-up technique describes the society in microview by modelling
individual behavior, communications in agents, and evolution rules of agent organizations. It is worth notifying that the modelling of agent does not emphasize the intelligence of individual. Large scale, communications and the emergence phenomena are the objects of agent-based modelling and simulation. The agent oriented platforms such as Biowar [3], GASM [4], and EpiSims [5] to study emergency problems have been proposed in many fields. Biowar developed by Carnegie Mellon University is used to study the bioattacks in city with the ability of scalable agent modelling. GASM (Global-Scale Agent Model) by Epstein simulates a global H1N1 epidemic with 6.5 billion people. EpiSims from Los Alamos national lab is used to testify the intervention measures in epidemics of smallpox from United States Department of Health and Human Services. With the help of agent-based modelling, simulation technique and the concept of artificial society [6], a novel conceptual framework based on artificial systems is introduced in the social computing. The conceptual framework called ACP (Artificial Society, Computational Experiments, Parallel Execution) approach is proposed by Wang in 2004 [7–9]. It is
2
Mathematical Problems in Engineering
a novel approach in social computing to solve the problems in society domain. ACP approach is categorized into three aspects: representing and modelling society with artificial systems, analysis and evaluation by computational experiments, and control and management of real society by parallel execution. Under the instruction of conceptual framework of ACP approach, a wide spectrum of complex systems, such as transportation, medicine, finance, and environment, can be studied in the computational manner. Actually, many realworld applications using ACP approach have been developed to solve the real problems in domains. For instance, complex socioeconomic system [10] and the research framework for e-commerce system [11] are the good applications of ACP approach in the economic area. The ACP-based framework for integrative medicine [12] is proposed to solve the problems in medicine. An overall framework of emergency rescue decision support system of petrochemical plant [13] is proposed based on ACP theory to study environment risk accidents of petrochemical plant. Parallel BRT operation management system [14] based on ACP approach has been constructed to detect the quantity of passengers on stations real-time, traffic flow on stations or at intersections, and queuing length of vehicles on the road. A novel parallel system for Urban Rail Transportation (URT) [15] based on ACP approach is proposed to address issues on safety efficiency and reliability of the operation of URT. An artificial power system [16] is set up on the models of power systems and complex power grids to provide a feasible approach for the control and management of the modern power system. Although a lot of work has been done on the concepts and theory framework to study problems by social computing, the following problems of computational experiments in emergency management are still not solved from the perspective of modelling for social systems theory and software framework of platform implementation. (i) The modelling and simulation of emergency management are not given the special consideration. The representation of society focuses on the generic modelling of agent (represented by Repast [17, 18]). The description of environments is too simple to meet the requirements from research on emergency problems, such as the building size, the place related agent contact frequency. (ii) The existing tools and platforms cannot support the design of experiment. Computational experiments cannot be done systematically and automatically. (iii) The existing applications of ACP-based frameworks are still domain specific. A generic workflow and integrated toolkit are needed to implement ACP approach, especially in the application of emergency management. Therefore, it is necessary to develop an ACP-based software framework for the research on emergency management. The artificial system is the projection of real world in the emergent scenario. The modelling of the system including the emergent events modelling and intervention measures modelling, the design of computational experiments considering the settings
of emergency parameters, the settings of large samples experiments, and the parallel execution with loose connection of real society should be considered inside the software framework. As a result, the purpose of this paper is to propose a software framework called KD-ACP applying the ACPbased computational theory and corresponding methods in studying emergency management problems. KD is short for the Chinese phonetic alphabets of China National University of Defense Technology. KD-ACP means the software framework is developed by National University of Defense Technology to implement ACP approach. The remainder of this paper is organized as follows. Section 2 summarizes the existing agent-based modelling and simulation platforms. Section 3 introduces ACP approach first and proposes the KD-ACP platform. Section 4 illustrates the modelling of Beijing city with KD-ACP; both the agent models and initial data are considered. Section 5 shows how to do experiments with KD-ACP using the H1N1 case study in artificial Beijing. In the end, the paper is concluded in Section 6.
2. Related Works There have been many efforts on social computing, especially on the emergency management. Agent-based modelling and simulation are popular in the implementation of social computation. The related works are mainly categorized into SWARM-like agent-based modelling and simulation platforms and agent-based platforms for emergency management. 2.1. SWARM-Like Agent-Based Modelling and Simulation Platforms. SWARM [19] originally proposed by Santa Fe institute is widely used in many research areas such as biology, ecology, and society. The tool provides a simulation environment for simulating agent with the support of a series of class libraries. It is worth noting that SWARM is the precursor of multiagent simulation tool; it influences lots of multiagent simulation platforms such as NetLogo [20], RePast (REursive Porus Agent Simulation Toolkit), MASON [21], and SOARS (Spot Oriented Agent Role Simulator) [22]. NetLogo is a multiagent programming language and modelling environment for simulating natural and social phenomena. It is particularly well suited for modelling complex systems evolving over time. The language is easy to study and the agent-based complex systems could be built rapidly; RePast is a software framework for agent-based simulation created at the University of Chicago. An extensible simulation package makes RePast become a generic multiagent simulation platform in social science research computing; MASON designed by George Mason University is used to serve as the basis for a wide range of multiagent simulation tasks ranging from swarm robotics to machine learning to social complexity environments. The tool is a fast discrete-event multiagent simulation toolkit in Java; SOARS is designed by Tokyo Institute of Technology to describe agent activities under the roles of social and organizational structure. Decomposition of multiagent interaction is the most important characteristics in this framework.
Mathematical Problems in Engineering All the SWARM-like agent-based modelling and simulation platforms provide a portable, lightweight, and easily extensible environment for simulating agents in arbitrary research areas. However, the heterogeneity in specific social computing domain is not considered. Furthermore, most of the platforms cannot well support large scale agent simulation because of the lightweight engine. The engine cannot afford the simulation of super cities like Beijing and New York which have millions of people. 2.2. Agent-Based Platforms for Emergency Management. Biowar proposed by Carnegie Mellon University simulates the impact of background diseases, bioterrorism attacks within a city. 62 diseases are modeled in this platform to simulate the outbreaks on the population’s behavior. GASM (Global-Scale Agent Model) is designed to study the spreading of H1N1; 6.5 billion population is modeled with the support of official statistical data. A global H1N1 spread from Tokyo is simulated in GASM. EpiSimS proposed by Los Alamos lab simulates the spread of disease in regions such as cities, allowing for the assessment of disease prevention, intervention, and response strategies. The daily movements and interactions of synthetic individuals are represented explicitly. Burke and Epstein propose a computational model of smallpox epidemic transmission and control [23]. The agents in this model interact locally with one another in social units such as homes, workplaces, schools, and hospitals. However, these platforms cannot provide a generic software framework to study emergency problems. Biowar only focuses on social networks; individuals are all modeled as the nodes of social networks. Agents in GASM and EpisimS are isomorphic, without considering the heterogeneity in specific domains. To sum up, this section briefly reviews the existing multiagent simulation platforms including SWARM-like agentbased modelling and simulation platforms and agent-based platforms for emergency management. However, they cannot satisfy the requirements of simulation performance, adaptability of software framework, and heterogeneity of individuals in research of different emergency scenarios.
3
Artificial societies
Actual societies
Testing Management and control
Operation Experimentation and evaluation
Testing Training and learning
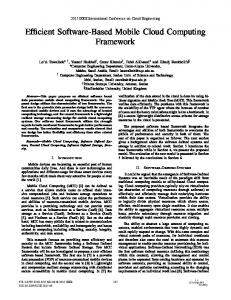
Figure 1: The parallel execution of ACP approach [8, 33].
(ii) Utilize innovative computing technologies to evaluate and analyze various factors in emergency management quantitatively; the computers are regarded as the experimental social laboratories for investigating emergency management problems. (iii) Provide an effective mechanism for the control and management of complex actual social society through comparison, evaluation, and interaction with artificial society.
3.1. The ACP Approach. ACP approach is a social computingbased research paradigm. It is composed of three components as its name: artificial society for A, computational experiments for C, and parallel execution for P. The basic idea of ACP approach is listed as follows.
It is worth notifying that “P” here is not the “parallel” in “parallel simulation” but the representation of “parallel execution.” The idea of parallel execution is to build the parallel scenarios by paralleling the actual societies and artificial societies. Consequently, parallel control and management of actual societies are implemented with the help of interactions between parallel scenarios. The goal of parallel execution is to find the best plans to adjust the methods of control and management based on the comparison and analysis of differences between actual and artificial societies. Artificial societies provide possible simulated results of evolutions by repeated computational experiments. The simulated results provide evidences for the adjustment plans. These plans are used in the control and management of actual societies, such as emergency management. After the application of these plans, the observations from actual societies are collected for the comparison with expectation. The differences are used to feedback to artificial societies. The new turn of comparison and analysis to find best adjustments of control and management is repeated. The mechanism of “parallel execution” has been proved to be effective for use in networked complex traffic systems and is closely related to emerging technologies in cloud computing, social computing, and cyber-physical-social systems [24]. In order to promote the development of parallel control and management in emergency management, the artificial society is proposed in ACP approach which is the expansion of “artificial traffic systems.” Instructed by the ACP approach, KD-ACP is also composed by three components. The details of the architecture and implementation of KD-ACP are discussed below.
(i) Model the complex societies involving human behavior and social organizations as artificial societies using multiagent modelling techniques in a “bottom-up” fashion. Artificial societies are regarded as a research platform to study emergency management.
3.2. The Software Architecture of KD-ACP. The architecture of KD-ACP is shown in Figure 2; the software framework is composed of a series of tools. These tools are grouped into three parts to support artificial society modelling, computational experiments, and parallel execution.
3. KD-ACP KD-ACP is an integrated software framework designed and implemented based on the principle of the ACP approach shown in Figure 1.
4
Mathematical Problems in Engineering
Generic Modeling Environment (GME)
A part
FSM based models
Population and Geospatial Environment Generation Tool (PGET)
Artificial society population and geospatial environment database
Artificial Society Editor (ASE)
Model Development Tool (MDT) Initialize
C++ code of models /dll of models
Scenario of artificial society Agent and emergency model repository Initialize Initialize Emergent Events Configuration Tool (EECT) Intervention Measures Configuration Tool (IMCT)
C part Experiments Design Tool (EDT)
Initialize
Settings of emergent events
Settings of intervention measures /emergency response plans
Experiments Management Tool (EMT) Artificial society runtime database
Actual society
Population data, emergent events data, and intervention measures Open source data Registration Tool (OsdRT)
Experiment plans
Artificial Society Situation Tool (ASST) Optimal emergency P part response plan
Internet
Figure 2: The software architecture of KD-ACP.
In the “A” part, Generic Modeling Environment (GME) [25] and Model Development Tool (MDT) are the kernel tools in the modelling of artificial society. GME is an open source modelling tool which supports domain-specific modelling. The domains of artificial society are created by GME in our work. Models such as agent, environment, emergent event, and intervention measure are described in specific domains first in GME. With the help of model transformation, these models are all transformed to the Finite State Machine (FSM) models. Meanwhile, code generations are supported by MDT, and these models are all implemented in C++. Artificial Society Editor (ASE) is used to describe the concrete scenario of actual society, which defines the scope of models set for artificial society; Population and Geospatial Environment generation Tool (PGET) generates the population and geospatial environment data with the support of statistical data from actual society. In the “C” part, Emergency Events Configuration Tool (EECT) initializes the models of emergent events while Intervention Measures Configuration Tool (IMCT) initializes the models of intervention measures. Experiments plans are generated by Experiments Design Tool (EDT). Based on these plans, Experiments Management Tool (EMT) is used to run and manage the computational experiments to study the emergency problems. In the “P” part, Artificial Society Situation Tool (ASST) seemed as the monitor of running artificial society. The statistical data and situation are shown by ASST at runtime. In the meantime, the emergency response plans are made by
emergency decision organizations. Parts of the influences of emergency plans are reflected on Internet. Open source data Registration Tool (OsdRT) is used to register the open source data from Internet to artificial society. KD-ACP is developed using the Browser/Server architecture, the tools are integrated in the home page of KDACP as shown in Figure 3. Each tool is activated by the click on the link. For example, Artificial Society Editor is started when the link of ASE is clicked. The working environment and programming languages of tools in KD-ACP are listed in Table 1. Moreover, the implementation of KD-ACP is mainly composed of modelling phase and computational experiments phase. It will be discussed in the next section. 3.3. The Modelling of Artificial Society in KD-ACP. It is a critical problem to focus on the key parts of society in social computing. Based on the ACP approach, the bottom-up modelling is used to build the artificial society. As a result, modelling of artificial society is composed of three basic elements: agents, environments, and rules for interactions. However, we still meet the problem that specific features should be supported in artificial society. For example, emergent events and intervention measures are required in artificial society for emergency management. The modelling of only basic elements cannot cover the specific features in domains. Therefore, domain-specific modelling [26] is introduced to solve the problems in modelling artificial society.
Mathematical Problems in Engineering
Generic Modeling Environment (GME)
Artificial society (A)
5
Computational experiments (c)
Emergent Events Configuration Tool (EECT)
Parallel execution (P)
Model Development Tool (MDT)
Intervention Measures Configuration Tool (IMCT)
EECT
MDT
Open Source Data Registration Tool (OsdRT)
IMCT
Artificial Society Editor (ASE)
ASST
ASE
Population and Geospatial Environment Generation Tool (PGET)
PGET
EDT
OsdRT
EMT
Experiments Design Tool (EDT)
Experiments Management Tool (EMT)
Artificial Society Situation Tool (ASST)
Figure 3: The implementation of KD-ACP.
Table 1: The working environment and programming languages of tools. Programming languages
Development platform
User type
General computer (desktop application)
NULL
NULL
Domain experts
Model Development Tool (MDT)
General computer (desktop application)
C++
Visual Studio
Model developers
Artificial Society Editor (ASE)
General computer (desktop application)
C#
Visual Studio
Domain experts
Population and Geospatial Environment generation Tool
General computer (desktop application)
C#
Visual Studio
Domain experts
Emergency Events Configuration Tool (EECT)
General computer (with Internet Explorer, client side)
C#
ASP.NET
Domain experts
Intervention Measures Configuration Tool (IMCT)
General computer (with Internet Explorer, client side)
C#
ASP.NET
Domain experts
C#
ASP.NET
C++
Visual Studio
C++
Visual Studio
Tools
Working environment
Generic Modeling Environment (GME)
Experiments Management Tool (EMT) Server of EMT Runtime Infrastructure of EMT
General computer (with Internet Explorer, client side) Nodes in supercomputer (Console Program, server side) Nodes in supercomputer (Console Program, server side)
Users of computation experiment
Artificial Society Situation Tool (ASST)
General computer (desktop application)
C++
Visual Studio
Domain experts
Open Source Data Registration Tool (OsdRT)
General computer (with Internet Explorer, client side)
Java
JSP
Domain experts
6
Mathematical Problems in Engineering
GME: Generic Modeling Environment Metamodeling Metamodeling for artificial society Domain-specific metamodels Agent metamodel
Environment metamodel
Emergency event metamodel
Intervention metamodel
Semantic well defined metamodels M2M transformation FSM
Petri Net
Modeling in domain
DEVS
DAE
State charts
Instance of
Modeling of artificial society
Semantic well defined models
Domain-specific models
FSM based agent models
Agent model
Environment model
Emergency event model
Intervention model
M2M transformation
FSM based environment models FSM based emergent and intervention models
M2T transformation MDT: Model Development Tool Implementation Domain-specific models relevant codes Agent model code
Environment model code
Disease model code
Intervention model code
Basic population model
Basic environment information model
Disease spreading model
Vaccination
Roadnet model
Disease state transform model
Agent behavior model Agent mentality model Agent social network model
Agent contact model
Infectors isolation Contactors isolation Close work offices
Figure 4: From metamodelling and modelling by GME to implementation by MDT of artificial society.
3.3.1. The Principle of the Modelling of Artificial Society. According to the principle of domain-specific modelling, the modelling of artificial society contains the following steps: first, metamodelling the basic elements of artificial society; second, modelling the specific features in domain of emergency management; third, implementing the models of artificial society in codes. The whole process is illustrated in Figure 4. The first and second steps are implemented in GME while the third step is implemented in MDT. The first step is metamodelling, which mainly focuses on constructing the metamodels of artificial society. Metamodelling tries to study the common patterns of artificial society. The outputs of metamodelling are metamodels, which represents the abstraction of the whole system. The basic elements of artificial society are described in metamodel. The process of metamodelling is divided into four phases. The first is the construction of the domain-specific metamodels. As shown
in Figure 4, agent metamodel, environment metamodel, emergent event metamodel, and intervention metamodel compose the metamodel of artificial society. The second is the construction of the metamodels described by typical modelling formalisms such as FSM, DAE, DEVS, and Petri Net [27]. These formalisms are all semantically well defined. The third is the definition of the model transformation from domain-specific metamodels to metamodels of typical modelling formalisms. The transformation standardizes the metamodels of artificial society by typical modelling specifications. The fourth is the definition of the transformation templates from metamodels to code framework. The templates list the basic abstract interfaces of metamodels of artificial society. These abstract interfaces are implemented in the specific-domain modelling and code generations. The second step is modelling; the models of artificial society such as agent model, environment model, emergent
Mathematical Problems in Engineering
7
Figure 5: The metamodels of artificial society in GME.
event model, and intervention model are built. Actually, the models are the instantiation of metamodels in the last step. Different from the general modelling environment like UML [28], the domain-specific modelling provides a familiar modelling environment for the domain experts in artificial society. For example, emergency response experts only concern emergent event model and intervention model inherited from metamodels. After constructing the domain-specific models based on domain-specific metamodels, domain users execute the model transformation defined in the first step. All the models of artificial society are transformed into FSM models. As a result, the models are implemented in this unified modelling formalism (FSM). The model transformation makes the simulation of the models possible. The third step is the generation of executable codes of models. The executable code framework is generated by mapping template from metamodels to code framework defined in the first step. Moreover, domain developers also add necessary codes to the framework to integrate the dynamic semantics of the models. The code framework outputs the dynamic link libraries by compiling. The dynamic link libraries are loaded in the large scale artificial society runtime infrastructure in computational experiments. 3.3.2. The Metamodelling and Modelling of Artificial Society by GME. GME is used to build metamodels and models in our work. As mentioned before, the abstraction and common patterns of society are represented in metamodels. According to the bottom-up modelling style, metamodels of agent, environment, and communications are described in GME. Figure 5 shows part of metamodels of artificial society. The features of an agent metamodel are extracted from the census figures and statistical data. Environment metamodel simulates the geospatial places for the behaviors of agents. The metamodel of communications among agents is modeled to simulate the interactions such as infection in epidemics and rumor propagation in public opinion formation events. It is worth notifying that the metamodel of communications
includes both the emergent event metamodel and intervention metamodel. From the perspective of modelling, the details from specific domains are considered in the models by the instantiation from metamodels of artificial society. For example, social relationships based on complex networks are added in agent model to support the communications. Agent activity is also used to quantify the agent activity under different scenario. Environment models are linked with the help of transportation services; subways and roads are modeled while the path search is encapsulated in the services. Emergent event model and intervention model are also the domain-specific models. The modelling of artificial Beijing in GME will be discussed in detail in next section. 3.3.3. The Implementation of Models of Artificial Society by MDT. As mentioned before, MDT is used to implement models such as agent, environment, emergent event, and intervention. According to the template of code framework, the implementations of models are generated by MDT. The implementations are classified into two categories: FSM models and services. FSM models such as agents and environments are built under the specification of Finite State Machine (FSM) [29] in MDT, while all the services such as transportation are encapsulated under the Public Service Standard. This standard provides a generic interface specification for modelers to encapsulate public common services in artificial society. FSM models like agent are built statistically from the quantitatively analyzed characteristics, such as demographic attributes, social behaviors, emergency behaviors, and social networks. Social behaviors describe the daily behaviors of individuals while emergency behaviors describe the individual behaviors in emergent events. For example, infected individuals are all isolated in hospital in SARS. Isolation is modeled as a typical emergency behavior in our work. Correspondingly, services are used to simulate the macroactual society. Take transportation service for instance; the path search is needed by almost every agent during moving from spot to spot.
8
Mathematical Problems in Engineering
Artificial society description in emergency
Description of artificial society framework +
Statistical data of real society
Agent role set Agent status set Agent behavior set Agent relationship set Environment set Artificial Society Editor (ASE)
Description of emergency
Geospatial statistical data Population statistical data
Data collection
Social relationship statistical data
Environment statistical data Actual society
Geospatial and Social Environment Generation Tool (GSeT) Emergency statistical data
Population behavior statistical data
Emergent event set Agent status in emergency Emergency management
Emergency organization statistical data
Agent model repository and population database
Agent metamodeling
···
+
Customized agent modeling
Social relationship modeling
Emergency Social behavior behavior modeling modeling
Modeling Building
Agent model Relationship model Daily
Behavior model Daily
Emergency Statistical model Job, age Sex, location
Emergency Intervention Response
Emergency Social behavior behavior model model Encapsulate
Agent modeling
Climate service
Artificial society population and geospatial database
Mapping
Geographical service
Transportation service
Intervention service
Organization service
Encapsulate
C++ Climate model
C++ Geographical model
C++ Transportation model
C++
Public service standard
Terminal of agent modeling and artificial society describing
Model Development Tool (MDT)
Agent model and service repository + emergency model repository
Organization model
Public service modeling
Figure 6: The editing and initialization of KD-ACP.
MDT provides domain experts with a tool to obtain the code implementations of models. With the help of compile environment like visual studio, MDT also supports the further programming development of the specific domain details which cannot be described in modelling step. Both the FSM models and services are developed by the MDT first and then stored in the agent model and service repository. The repository manages the models according to the requirements from emergency problems and provides the models for EDT to make the experiment plans. 3.4. The Editing and Initialization of Artificial Society by ASE and PGET. As shown in Figure 6, ASE is used to edit the scenarios of artificial society within emergent events. The editing is composed of two parts: (1) the statistical information of artificial society in daily life, such as the roles of agents, the relationships of agents, and the types of environments, and (2) the statistical information of artificial society in emergency, including the statistical data of emergent
events, the emergency organization, and emergency related behaviors of agents. According to the requirements of the editing, these statistical data are collected from actual society manually by the domain experts. Based on these statistical data, PGET generates the artificial society population and geospatial environment database. The database supports the instantiation of artificial society at individual level. For example, the attributes such as age and gender of each agent can be found in the database. With the support of the database, FSM models, and service repository discussed before, it is sufficient for domain experts to study the emergency problems by computational experiments. 3.5. The Computational Experiments and Parallel Execution in KD-ACP. The tools of “C” part and “P” part in KD-ACP are used to support the process of computational experiments and parallel execution. The working process is shown in Figure 7; EECT and IMCT are both the starting and ending
Mathematical Problems in Engineering
∙ Input: models of emergency events ∙ Output: settings of agent behavior in emergent events + settings of emergent events
Emergency Events Configuration Tool (EECT)
Intervention Measures Configuration Tool (IMCT)
Artificial society population and geospatial environment database
∙ Input: models of intervention measures ∙ Output: settings of agent behavior in intervention measures + settings of intervention measures
Load
Load
∙ Input: description of artificial society + artificial society population and geospatial environment society + emergent events configuration + intervention measures configuration Experiments ∙ Output: experiment plan + artificial design tool (EDT) society models + artificial society initial data file
Load Output
Output
Output
Load
Agent model and service repository + emergency model repository Output
9
Input Artificial society models
Artificial society initial data file
Experiment plan
Output Load
∙ Input: data from internet networks ∙ Output: population data + emergency events data + intervention measures data Open Source Data Registration Tool (OsdRT) Emergency response plans
Load
Deploy TIANHE-1A super computer
Experiments Management Tool(EMT) + Deploy large scale artificial society runtime infrastructure
∙ Input: experiment plan + artificial society models + artificial society initial data file ∙ Output: artificial society runtime state data
Cluster Runtime infrastructure
Internet
Output The most optimal emergency response plan
Actual society
Output Emergency decision organization
∙ Input: runtime statistical data ∙ Output: graphics charts of artificial society statistical data + Load situation of artificial society Artificial Society Situation Tool (ASST)
Artificial society runtime database
Figure 7: The computational experiments and parallel execution of KD-ACP.
point. The emergent events and intervention measures are configured by EECT and IMCT, respectively. The configurations of emergent events are used to simulate both the real emergencies like SARS and H1N1 and the supposed emergencies for experiments. Similarly, the configurations of intervention measures are also used to reproduce the real one and simulate the supposed one. The repeat of the emergency is used to verify the models while the supposed configurations are used to obtain the optimized decision plan to the response of the possible emergencies. With the input of artificial society model and service repository, artificial society population and geospatial environment database, and the configurations discussed before, EDT generates the experiment plans to meet the requirements of research on emergency management. The output of EDT includes artificial society models, artificial society initial data files, and experiment plan. The models are downloaded from the repository while the data file is the collection of data from the database to initialize the models. When the models and data files are ready, EMT loads the experiment plan and deploys the models and data to the cluster or TIANHE-1A supercomputer [30] which was the world’s fastest supercomputer built by National University of
Defense Technology (NUDT) in China in 2010. According to the plan, the experiments are done repeatedly on the large scale artificial society runtime infrastructure [31, 32] by the multisample settings. The work process is the implementation of computational experiments in ACP approach. Traditionally, emergency response plans are made by emergency management theories and experiences. The only way to test the effective of plans is the feedback results of real world. ACP approach provides a novel method to support emergency response plan making by parallel execution. As shown in Figure 7, the work process of KD-ACP is composed of two loops. The inner loop composed by red arrows describes the process of computational experiments while the outer loop of yellow arrows illustrates the process of parallel execution. During the runtime of computational experiments, the statistical data of artificial society is collected and stored in the artificial society runtime database. Based on the database, ASST outputs the customized situation of running artificial society by graphics charts and situation maps. The information is sent to the organizations of emergency decision to support making the emergency response plans. With the help of computational experiments loop, these plans are simulated repeatedly to find the most optimal one.
10
Mathematical Problems in Engineering
Internet
Emergent Events Configuration Tool (EECT) Actual society
Intervention Measures Configuration Tool (IMCT)
Open source information in social media
Knowledge
Data acquisition ∙ Web information collecting ∙ Deep mining in social media ∙ Web information denoising ∙ Information filtering
Data extraction ∙ Basic element extracting ∙ Individuals and organizations extraction ∙ Sentiment analyzing and opinion mining ∙ Social network analyzing
Data standardization ∙ Domain knowledge description ∙ Information fusion and collision detection ∙ Domain knowledge construction ∙ Social media information standardization Open Source Data Registration Tool (OsdRT)
Figure 8: The compositions of OsdRT [34].
Moreover, the most optimal plan is used to the response of emergency in actual society. According to the idea of parallel control in [24], the feedback of actual society is partly collected from Internet networks by OsdRT. As shown in Figure 8, OsdRT is composed of three components: data acquisition, data extraction, and data standardization. Data acquisition collects, mines, and filters information from social sensing networks. Data extraction includes basic element extracting, individual and organization extracting, sentiment analyzing, and social networks analyzing. Data standardization specifies the useful knowledge and sent it to configuration tools in KD-ACP. By processing in OsdRT, the knowledge about emergent events and intervention measures are analyzed first and registered in the EECT and IMCT. The registration updates the settings of emergent events and intervention measures. This loop composed of yellow arrows implements the parallel execution in ACP approach. The implementation of parallel control and management provides a data-driven approach that considers both the engineering and social complexity for modelling, analysis, and decision making in emergency management.
4. Modelling Beijing City with KD-ACP 4.1. How to Build the Artificial Beijing. According to the modelling of artificial society in KD-ACP discussed before, the Beijing city is modeled as follows. To meet the requirements of emergency managements, the basic elements of artificial society are extended. As shown in Figure 9, six elements are required to simulate the city: agents, environments, transportation, activity schedule, communication, and agent activity. 4.1.1. Modelling Artificial Beijing. Figure 10 shows the main GUI of GME for the modelling of artificial modelling in public health events. Metamodels are listed in the left area of Figure 10; the list provides basic syntax elements for domain experts to model artificial society. Domain experts build
models based on the knowledge of their own. Meanwhile, GME supports hierarchy for building large scale systems. The syntax symbol listed in GUI can be extended in new tab by double clicking. Take agent for example; the model of agent can be detailed by edition in another tab page of agent. As shown in the center of Figure 10, the models of artificial Beijing consist of five parts: models of agent and environment, domain models of public health events, intervention models, controller models, and services. Agent model describes individuals in society; it is composed of basic population information, action, social relationships, activity schedule, and disease related information. Activity schedule represents individual’s physical action model, focusing on the daily action of agents. Environment model includes physical entities such as buildings, playground, transportations, and agents contained in environment. Domain models of public health events are composed of the propagation model of disease, disease state transition model, and so on. Intervention models include the settings of vaccination, isolation, and so on. The models mentioned before are all FSM models. The mechanisms of these models will be detailed in next sections. Controller models and services are the public service modules; they are implemented in the development in MDT. 4.1.2. Modelling Agents and Environments. Under the specification of FSM, agent and environment models are implemented in two parts: the state space and state transitions. The state space is composed of the demographic attributes and behavior related attributes. The transitions are triggered when the conditions of states are satisfied. As shown in Figure 11(a), the action of agent is changed when the “next time” condition is satisfied in agent model while the agents list is changed when the agent arrival condition is satisfied in the environment model. 4.1.3. Modelling Activities. Agent activities come from the agent state transitions of actions such as movements and communications. The actions of agents are instructed by the activity schedule shown in Table 2. Activity schedule lists
Mathematical Problems in Engineering
11
Artificial Beijing
Activity schedule
Agent activity
Agent activity
Communication by social relationship networks
Environments
Communication by social relationship networks
Agents
Transportation
Environments
Figure 9: The basic elements of artificial society.
Controller models Intervention models
Services
Models of agent, environment, and
Domain models of public health events
activity schedule
Modeling aspect of domain experts
Syntax elements of DSM
Figure 10: The models of artificial Beijing in GME.
all the actions with probability in one day for agents in both normal and emergent situation [38]. There are several types of activity schedule in artificial Beijing: student agent activity schedule, worker agent activity schedule, emergent agent schedule, and so on. For example, Table 2 gives an agent activity schedule. Upon the instruction of activity schedule, student agent changes the actions by 𝑝𝑖 after state transitions. The 𝑝𝑖 in the table means the action probability in the relevant period. In the duration from 08:00 to 12:00, a student agent either goes to classroom to have class or goes to library to study. The probability of class action is 𝑝2 while the probability of study action is 1 − 𝑝2 .
Agent behaviors are decided by the settings of activity schedule. In addition to the daily activity schedule mentioned before, emergent activity schedules are also considered in our work. Take public health events for instance; an infected agent changes schedule from a normal one to emergent one. The workflow of a susceptible agent is illustrated in Figure 12 to show the change of behaviors. After the infection, the agent is set in incubation phase. Not all the incubation agents will become symptomatic. Some of them turn back to being susceptible and some of them become symptomatic. The symptomatic agents change their activity schedule from normal to emergent. In the emergent case,
12
Mathematical Problems in Engineering Q
Q
Σ
q0
Advance to next action time
𝛿 Find next action in activity schedule by time
Current action
Current environment (location)
F
Next action Next environment (location)
Find next environment in activity chain by action
Σ
q0 Agents entered
Current agent list
Infected agents entered
Current pollution level
𝛿
Add agents to current agents list
F
Next agents list Next pollution level
Compute pollution level by infected agents
(a) The state transitions of agent
(b) The state transitions of environment
Figure 11: The state transitions of models.
Table 2: The activity schedule of a student agent. Duration (Δ𝑡) 00:00–06:00 06:00–08:00 08:00–12:00 12:00–14:00 14:00–18:00
18:00-19:00
19:00–22:00
22:00–24:00
Activity Sleep Breakfast Sports-breakfast-travel Class Study Lunch Lunch-shopping Class Study Dinner Sports-shopping Study Rest Dinner-rest Study Rest Sleep
Location Dormitory Dormitory/restaurant Playground-dormitory/restaurant Classroom Library Restaurant Restaurant-convenience store Classroom Library Dormitory/restaurant Playground/convenience store Classroom/library Dormitory Dormitory/restaurant-dormitory Classroom/library Dormitory Dormitory
infected agents go to hospital according to the treatment schedule or stay in dormitory according to isolation schedule. After the treatment in hospital or self-immunoprocess, agents become healthy and immune of disease. If the agents are treated in the hospital, they are not allowed to get out until recovered. Moreover, activity schedules are also influenced by the emergency response plans. For example, in the case of isolation in emergency response plans, the activity schedule of agents who had contacted with infected is changed. Only the locations including home and dormitory compose this emergent schedule. Likewise, based on the statistical data from emergency response plans, the additional possibilities
Probability 𝑃0 (1.00) 𝑃1 (0.68) 1 − 𝑃1 (0.32) 𝑃2 (0.77) 1 − 𝑃2 (0.23) 𝑃3 (0.90) 1 − 𝑃3 (0.10) 𝑃4 (0.70) 1 − 𝑃4 (0.30) 𝑃5 (0.63) 𝑃6 (0.25) 1 − (𝑃5 + 𝑃6 ) (0.12) 𝑃7 (0.45) 𝑃8 (0.20) 1 − (𝑃7 + 𝑃8 ) (0.35) 𝑃9 (0.72) 1 − 𝑃9 (0.18)
𝑇Location (minute) 360 120 240 120 240
60
180
120
are added into activity schedules. The behaviors of agents also change with activity schedules. In the view of ACP approach, the injection of new emergency response plans implements the parallel execution of microagent behaviors. In another aspect, contact frequency is also another crucial element to determine the infected rate in public health event. It is important to model the contact frequency and contact time of individuals. Based on the studies on the contact behavior of human being by questionnaire survey, Edmunds found that the contact frequency of individual could be fitted approximately into a normal distribution, and the mean and the standard deviation distributions are
Mathematical Problems in Engineering
13
Immune
Susceptible agent
Healthy and immune Yes
No Contact with infected agents
No
Self-immunoprocess Infection Yes No
Incubation
Recovered No
Yes Symptomatic No Yes Choose schedule
Self-isolation
Stay symptomatic
Go to hospital
Receive treatment
Yes No
Figure 12: The workflow of a susceptible agent.
16.8 and 8.5 [39]. So it is possible to apply normal random variable to model the contact frequency. In our work, BoxMuller method [40] is used to generate the random variable of contact frequency, shown in the following: 1/2
𝐹𝐶 = 𝜇𝐹 + 𝜎𝐹 (−2 ln (𝛾1 ))
cos (2𝜋𝛾2 ) ,
(1)
in which 𝐹𝐶 is the random variable of contact frequency, 𝜇𝐹 is the mean value of normal distribution, 𝜎𝐹 is the standard deviation of normal distribution, and 𝛾1 and 𝛾2 are the uniform random variables distributed in the interval [0, 1]. Based on (1) and survey data [41], the contact frequencies of agent 𝐹contact (𝐴 𝑖 ) are discretized as in Table 3 within the consideration of activity differences. Similarly, the duration per contact between individuals is another key factor of AHC transmission. The duration of contact could also be modeled by the normal random variable in the following [42]: 1/2
𝑇𝐶 = 𝜇𝑇 + 𝜎𝑇 (−2 ln (𝛾1 ))
cos (2𝜋𝛾2 ) ,
[0, 1]. In addition, because the time spent in specific location 𝑇Location (𝐴 𝑖 ) also follows the random distribution like (3) in our work. In order to make the duration of contact 𝑇contact (𝐴 𝑖 ) shorter than the 𝑇Location (𝐴 𝑖 ), the mean and standard deviation of (2) is set up in (3) and (4) [42]:
(2)
in which 𝑇𝐶 is the random variable of duration per contact, 𝜇𝑇 is the mean value of normal distribution, 𝜎𝑇 is the standard deviation of normal distribution, and 𝛾1 and 𝛾2 are the uniform random variables distributed in the interval
𝑇Location , (𝜇𝐹 + 𝜎𝐹 )
(3)
𝑇Location , (10𝜇𝐹 + 10𝜎𝐹 )
(4)
𝜇𝑇 = 𝜎𝑇 =
in which 𝑇Location is the time of an activity in a specific location set in Table 2. 𝜇𝑇 and 𝜎𝑇 are the mean and standard deviation of contact frequency. As a result, the duration of agent 𝑇contact (𝐴 𝑖 ) in specific locations (listed in Table 2) is also discretized in Table 3 within the consideration of activity differences. 4.1.4. Modelling Transportation. In artificial Beijing, three kinds of travel models are considered: walking inside the district, travelling by road networks, and travelling by subway networks. According to the traveling models, the agent movements are implemented by the compositions of traveling models before. So it is important to build the basic road
14
Mathematical Problems in Engineering Table 3: The contact frequency and duration in different locations and activities by social relationships in case of student and teacher.
Social relationship
Student-student
Teacher-student
Activity Sleep Breakfast Breakfast Sports Class Study Lunch Shopping Dinner Dinner Rest Class
Location Dormitory Restaurant Dormitory Playground Classroom Library Restaurant Convenience Store Restaurant Dormitory Dormitory Classroom
Subway network of Beijing city (red lines)
𝑇contact (𝐴 𝑖 ) (minute) 0 𝑁(5,2) 𝑁(5,2) 𝑁(2,1) 𝑁(2,1) 𝑁(2,1) 𝑁(15,8) 𝑁(20,3) 𝑁(10,8) 𝑁(15,8) 𝑁(6,3) 𝑁(2,1)
𝐹contact (𝐴 𝑖 ) 0 𝑁(3,2) 𝑁(2,1) 𝑁(5,3) 𝑁(2,1) 𝑁(2,1) 𝑁(3,2) 𝑁(2,1) 𝑁(2,1) 𝑁(3,2) 𝑁(5,2) 𝑁(2,1)
Road network of Beijing city (green lines)
Figure 13: The implementation of transportation for artificial Beijing.
and subway networks. With the help of Google map, the key points of road are sampled first and the road networks are generated by the links among point. Similarly, subway networks are generated by the links between subway stations mapped from the real stations in Google map. Figure 13 shows the road and subway networks in artificial Beijing, with the road networks in green and the subway networks in red. Most of the districts in Beijing city are covered by these two networks. The algorithm of hierarchical route planning is proposed as follows. (i) Find the next position where agent will be located in next action. (ii) Obtain the traveling models from the statistical transportation data. (iii) Search the path from the starting position to the nearest road entry or subway stations.
(iv) Search the optimal path from the starting station or road entry to the nearest station or road exit of target position. (v) Search the path from the target subway station or road exit to the target position. (vi) Attach the subway train number or the bus number including the transfer information to the path according to the timetable of subway or bus. (vii) Connect all the paths obtained before. Generate the path from the starting position to the target position. Based on the algorithm for each agent in artificial Beijing, the transportation is simulated during the computational experiments. It is worth noting that the activities inside the buses or train cars are considered, because the agent communication during travelling is also necessary to be simulated.
Mathematical Problems in Engineering
(a) The implementation of agent in MDT
15
(b) The code framework of agent
Figure 14: The agent model implementation in MDT [35].
4.1.5. The Implementation of Models by MDT. All the models are developed in the MDT; Figure 14 shows the GUI of the tool. MDT is used to implement the state space and state transitions of FSM models. The code framework is shown in Figure 14(b). Using the C++ inheritance features and the techniques of dynamic link library (dll), the models are encapsulated in the dll components. The flexible composition mechanism is designed to support the models evolution in computational experiments. 4.1.6. The Description of Artificial Beijing by ASE. As mentioned in Section 3.4, ASE describes the artificial Beijing in macroview. The statistical information of Beijing city is collected by ASE. Table 4 lists part of the description of artificial Beijing generated by ASE. 4.2. How to Obtain the Data of Beijing City 4.2.1. Population and Geospatial Environment Database of Beijing City. Based on the models developed for Artificial Beijing, it is necessary to generate the initial data to do the computational experiments. Because the individual level data are not available, it is necessary to construct an individualbased population database for both accurate computational experiment and determining optimal decisions. According to the state spaces of models discussed in Section 4.1.2, the geospatial and population database of Artificial Beijing is designed as shown in Figure 15. The kernel part of database consists of the tables such as agent list table, geospatial environment list table, household list table, and agent distribution table. Agent list table is an individual level table used to store the data to initialize the state space of agent model such as id and gender age. Geospatial environment list table is also an individual level table which stores the data of environment attributes such as id, street id, and type. Household list table and agent distribution table store the statistical data for the data generation for agent and environment models. With the help of the geospatial and population database, the data generating of artificial Beijing is proposed in the next section.
4.2.2. Generating Geospatial and Social Environment Data for Artificial Beijing by PGET. The algorithm of generating geospatial and social environment data for artificial Beijing is used to quantify the spatial distribution of population and formalize geospatial behavior of each agent. The algorithm shown in Figure 16 is capable of generating a synthetic artificial society, which allows multiresolution statistical data, social interactive behavior, and multilayer social networks to be integrated together. The synthetic population can represent individual agents in the form of households and household members, and the synthetic population is statistically equivalent to a real population. For each household, characteristics, such as address, household size, family types and relationships, are generated. Each person is described by characteristics such as age, gender, social role, and correlated locations. The algorithm provides an effective methodology to reconstruct the computing environment in high resolution by using statistical data in low resolution, leading to better prediction and management of emergencies. The details of algorithm are illustrated in [36]. As shown in Figure 17, the implementation of the algorithm is embedded inside the GEPT. The collective input data such as the data files of population distribution is collected in the tool first; then the algorithm is activated to generate the database. The generation lasts almost twelve hours one time with the specified parameters settings. When the generation is finished, the data of artificial Beijing is obtained in the database with 19,610,000 agents and 16,000 environments.
5. H1N1 Experiments in Artificial Beijing with KD-ACP With the support of the artificial Beijing modeled before, the computational experiments and parallel execution are also implemented by KD-ACP. The experiments are designed to find the most optimal emergency decision response plans. Epidemic in city is a typical scenario in emergency management. H1N1 epidemic in Beijing in 2009 is used to be the used case to test KD-ACP. According to Section 3.4, it is necessary to model emergency management first in order to support the computational experiments.
16
Mathematical Problems in Engineering Table 4: The description of artificial Beijing generated by ASE.
Statistical features of artificial Beijing
Descriptions of statistical features
Data source/default values
{Baby, child, primary student, middle school student, college student, worker, . . ., retired} {Super market, store, restaurant, park, stadium, hospital, school, clinic, commercial building, dormitory building, . . ., residential building} {Age distribution of population, sex distribution of population, household distribution of population, retired age distribution, . . ., children distribution}
Environment data
{Distribution of all types of environments}
Relationships
{Classmate, relative, college, friendship, . . ., family}
Demographic data file of Beijing Demographic data file of Beijing Demographic data file of Beijing Environment distribution data file of Beijing Demographic data file of Beijing
Varying parameters
Age difference of couples 𝑁(𝜇,𝜎) Minimum marriage age (male, female) Age difference of children 𝑁(𝜇,𝜎) Enrollment rate of kindergarten 𝛼 Enrollment rate of primary school 𝛽 Enrollment rate of middle school 𝛾 Enrollment rate of college 𝛿 Entrance age of kindergarten 𝛼 Entrance age of primary school 𝛽 Entrance age of middle school 𝛾 Entrance age of middle school 𝛿
𝑁(0,3) ∈ [0, 12] (22, 20) 𝑁(1,3) ∈ [1, 10] 0.8 1 1 0.8 3 7 13 19
Agent roles Environment types Demographic data
Age distribution information table
Agent set table
Geospatial environment set table
Household set table
Figure 15: The geospatial and population database of Beijing city.
5.1. Modelling Emergency Management. The modelling of emergency management consists of two parts: the modelling of emergent events and the modelling of intervention measures. H1N1 and the intervention measures for H1N1 are modeled in our case. 5.1.1. Modelling H1N1 by MDT. H1N1 Model in agent simulates the states transitions of health status and the relevant actions. Referring to SIR (Susceptible\Infective\Recovered) [43, 44] models, agent has three health statuses: susceptible, infected, and healthy with immunity. Only susceptible agent can be infected by the contact with infected agents. After
the three infected phases (incubation, being symptomatic, and recovery) of H1N1 model, agent is healthy again. It is worthy mentioning that the recovered agents can be infected iteratively when the immunity disappears gradually by time. The state transitions are illustrated in Figure 18. According to [45], the latent period of H1N1 was in a Weibull distribution within people, from one to seven days [46, 47]. The distribution was usually centered in the range between one and three days. A Weibull random variable [40] is used to model the latent period, as described in 𝑇Lat = 𝛼 × [− ln (1 − 𝛾)]
1/𝛽
+ 𝜐 (𝑇Lat ≥ 𝜐) .
(5)
Mathematical Problems in Engineering
17
Generate GUID
Assign individual administrative region
Assign individual household
Generate house buildings
Consumption Entertainment locations locations
Generate family structure
Locate household to house building
Correlated individual with other locations
Assign family role to every member
Census data
Distribute environment locations on the map
School
Workplace
Assign school or workplace to individual
Generate friendship in school
Generate family relation
Generate neighborhood relation
Endow individual with age, gender, social role
Generate coworker relations in workplace Environment list Social network
Population Environment
Figure 16: The algorithm of generating geospatial and social environment data [36].
Geospatial and social environment generation tool
Geospatial population data Population data of street
Browse Statistical characteristic of population Population types
Edit
Workspaces
Edit
Household types
Edit
Roles in household
Edit
Parameters distribution settings Household structure
Edit
Social roles
Edit
Population distribution data Data type Age distribution
File path
Sex distribution Household distribution Household num Pop distribution Retired distribution
Browse Browse Browse Browse Browse Browse
Figure 17: The GUI of Population and Geospatial Environment generation Tool (PGET).
18
Mathematical Problems in Engineering
Infected co ve r
y
Time (day)
Re
Infectivity
t ac nt ents o c g by a d cted e t e fec nf In ith i w
Infectivity −1
before being Decrease after being Susceptible Increase symptomatic symptomatic
Health with immunity
1
2
3 4 Symptomatic
5
6
7 Recovered
Figure 19: The distribution of infectivity rate of an infected agent [37]. Immunity
Decrease by time
Table 5: The proportion of infectivity.
Figure 18: The transitions of agent health status.
Days (𝑖) −1 1 2 3 4 5 6 6 Proportion of infectivity 0.3 0.5 1 0.8 0.4 0.2 0.1 0.05
𝑇Lat denotes the duration of latent period. 𝜐, 𝛼, and 𝛽 are the location parameter, scale parameter, and shape parameter of Weibull distribution, respectively. 𝛾 is a uniform random number in the range [0, 1]. According to statistics [47], 𝜐, 𝛼, and 𝛽 are set as 0, 1.8, and 1.21, respectively. Then the mean (standard deviation) of latent period is calculated as 1.59 days (0.58 day2 ). Furthermore, infectious period is set as 7 days. A susceptible student’s probability of getting infected depended on the infectivity of infectious agents, his own immunity level, the duration of the contact action, and so on. The infectivity of an infected agent evolved with time during the infectious period. According to the statistics of infectivity in the chart with red bars in Figure 19, an infected student had the highest level of infectivity in the second day after he had the first symptom. The infectivity levels in other days in comparison with the second day are in Table 5. The day labeled as “−1” means the day before the starting of the symptomatic period. Based on the algorithm discussed before, the H1N1 model is developed with the help of MDT. The settings of influenza model will be discussed in Section 5.2.1. 5.1.2. Modelling Intervention Measures by MDT. In correspondence, intervention measures model is used to cease the outbreak of H1N1. As discussed in [42, 48, 49], if the appropriate measures are taken when the infectious disease emerges, the transmission of the disease could be slowed down and the damage could be decreased. Therefore, it is necessary and important to design emergency intervention measures in the artificial Beijing. According to the Ministry of Health in China, the intervention policies [50] are designed to control the spread of influenza such as H1N1. The intervention measures of these policies including are interventions activated time, vaccination rate, antibiotic, delay to hospital, isolation duration, close workspace duration, and limitation of activities listed in Table 6. Similarly, the models of these intervention measures are also developed with the help of MDT. Using the reasonable data ranges listed in Table 6, intervention models can be initialized to do the computational experiments. These experiments are used to show how
to restrain the H1N1 transmission. The settings of these intervention measures in IMCT are introduced in Section 5.2.2. 5.2. Experiment Settings 5.2.1. H1N1 Settings by EECT. EECT is designed to initialize the emergent events models such as H1N1. The settings come from the specified emergent event models. As shown in Figure 20, in the H1N1 used case, the settings are composed of the distribution of infection source, infection rate, infection period, and so on. The infection rate changes with environments and infection periods. The settings are initialized from both the research of medicine on H1N1 and the data of H1N1 outbreak in Beijing in 2009. The process of influenza in artificial Beijing is simulated to repeat the possible scenarios of H1N1 break. During the computational experiments of artificial Beijing, the H1N1 settings such as the period of being symptomatic are updated by the dynamic data registrations from OsdRT. The updating corrects the H1N1 model during the experiments. With the help of OsdRT, artificial Beijing is able to approach actual society. It is also an implementation of parallel execution. 5.2.2. Intervention Measures Settings by IMCT. In the H1N1 case, the settings of intervention measures are shown in Figure 21 in IMCT. These measures are designed under the instruction of Emergency Decision Organizations like China Disease Center (CDC). The measures such as vaccination rate, the rate of closed workspace, and the starting time can be initialized in the tool. Emergency response plans are implemented in these settings. As illustrated in Figure 7, all the possible compositions within value settings in reasonable intervals are tested to find the most optimal emergency response plan. For example, different compositions of measures such as vaccination rates and rates of workspace closed are used to design the plans of experiments. By the analysis of the results, the best composition of intervention measures can be obtained. The analysis will be discussed in case study in detail.
Mathematical Problems in Engineering
19 Table 6: The intervention measures of influenza.
Intervention measures Interventions activated Time Vaccination rate Antibiotic rate Delay to hospital Isolation duration Close workspace duration Limitation of agent activity duration
Values 𝑇Intervention ∈ [0, 80th day] 𝑅Vaccination ∈ [0, 1] 𝑅Antibiotic ∈ [0, 1] 𝐻ospital (𝐴 𝑖 ), 𝑇infected < 𝑡 < 𝑇recovered + 𝑇HDelay , 𝑇HDelay ∈ (0, 3th day] 𝐼solation (𝐴 𝑖 ), 𝑇Intervention < 𝑡 < 𝑇Intervention + 𝑇IDuration , 𝑇IDuration ∈ (0, 14th day] 𝐶lose (𝐸𝑖 ), 𝑇Intervention < 𝑡 < 𝑇Intervention + 𝑇CWDuration , 𝐸𝑖 ∈ Workspace, 𝑇CWDuration ∈ (0, 7th day] 𝐿 imitation (𝐴 𝑖 ), 𝑇Intervention < 𝑡 < 𝑇Intervention + 𝑇LAADuration , 𝑇LAADuration ∈ (0, 7th day]
𝑅Vaccination means the vaccination rate of artificial Beijing while 𝑅Antibiotic means the antibiotic rate used for infected agents in hospital. 𝐻ospital (𝐴 𝑖 ) means that the infected agent 𝐴 𝑖 is sent to hospital; he or she will receive the retreatment immediately. 𝐼solation (𝐴 𝑖 ) means that the infected agent 𝐴 𝑖 is isolated at home; he or she can only contact with the other agents until isolation duration is over. 𝐶lose (𝐸𝑖 ) means that the environment 𝐸𝑖 typed of workspace is closed until the close workspace duration is over. 𝐿 imitation (𝐴 𝑖 ) means that the activities of agent 𝐴 𝑖 are limited, only the workspace and home are allowed until limitation duration is over.
H1N1 influenza Disease model Incubation: Weibull distribution Symbolic: LogNormal distribution Recovering: LogNormal distribution
Transmission model
Settings of H1N1 influenza model
Figure 20: The settings of H1N1 in EECT.
It is worth notifying that the settings of intervention measures are also influenced by OsdRT. For example, the H1N1 outbreak areas are notified by OsdRT. The intervention measures such as close workspace are used only in the outbreak areas. Therefore, the unnecessary computation of intervention measures is avoided. So the data injection by OsdRT not only makes artificial society approach actual society, but also increases the performance of computational experiments. 5.3. Experiments by EMT. When the initialization of artificial Beijing is ready, EMT is used to do the computational experiments. EMT is composed of two parts: the central controller in the central node and the residential service deployed in the computational nodes. Central controller loads the experiment plans and controls the whole
experiments process; the GUI of controller is shown in Figure 22; EMT manages the computational experiments in four steps: cluster configuration, load experiment plans, models deployment, and running experiments. 5.3.1. Cluster Configuration. Before the configuration, cluster information is collected from the residential services inside the cluster. The information includes nodes amount, node names, node IPs, and CPU occupations. It is used to quantify the computing power of the cluster. The cluster configuration is based on this information. The nodes are selected for experiments. Then the LP (local process) [51] number for each node is set according to the number of the CPU kernels. After the configuration, the experiment plans are loaded to customize the models and data.
20
Mathematical Problems in Engineering
Surveillance
Hospital
Streets of close workspaces
Vaccination Antibiotic Close workspace Isolations Respirator Limitations of activities
Figure 21: The settings of intervention measures in IMCT.
List of experiment plans
Start | Pause | Reset | Stop | Speedup | Slowdown | Back
Information of experiment plan
NodeName | CPU occupation | Memory occupation | Network | Models | Status
Figure 22: The deployment and running of experiments in EMT.
5.3.2. Load Experiment Plan. As discussed in Section 3.5, the description of experiment plans is composed of the information in three aspects: models and the initial data for the experiments, the deployment mapping tables from the models to the nodes, and the plan of experiment execution. When the experiment plan is loaded by the EMT, the file names and model descriptions of models and data are listed. With the support of cluster configuration, models can be mapped to the nodes in the GUI according to the computation requirements. EMT also provides the setting of experiments itself, including the running times, start time, and end time.
5.3.3. Models and Data Deployment. Models are stored in the agent population and services repository. According to the settings in experiment plan, the customized models are downloaded from the repository first; then the models such as agent model, environment model, emergent events model, and intervention measures model are integrated to be the composition models of artificial Beijing. The models and data locations in the nodes are configured in the “model path” and “data path” in the GUI of central controller. Finally the models are uploaded to the nodes in cluster with the consideration of partition. The partition of artificial society
Mathematical Problems in Engineering models is different from the multiagent system in [52]. Models in artificial society are divided into three levels: agents and environments, grids, and city. Agents and environments are encapsulated in grids which compose the whole city. Thus the partition of artificial society becomes the partition of grids. The parallelism degrees are found to support the partition of models: agent independence and grid independence. According to the parallelisms, agents are partitioned to LPs according to the population distribution in grids. Agent movements among grids are simulated by the movement events among grids in different LPs. As a result, a two-tier parallel architecture is proposed to support the simulation of artificial society. The architecture is detailed in [53]. 5.3.4. Running of Experiments. When the preparation is ready, the experiments can be done by the central controller of EMT. The running and control commands of the experiments are grouped into three aspects: start, pause, or stop the experiments; get the running information of the nodes such as the snapshot of the desktop of node. With the help of these commands, users can run the computational experiments to do the research on the emergency management. It is worth notifying that the simulation engine is optimized in order to support the ten million agent simulation. Using GPU as coprocessor, a two-tier parallel simulation engine is designed with support of MPI and OpenCL through phased synchronization [54]. One-sided communication is used for reflection of remote simulation objects and message passing between processes. A general kernel function prototype is elaborately designed and conditionally compiled for execution on both CPU and GPU. Moreover, the optimization operations like load balance is developed under the instruction of activity-based simulation [55]. The densely populated grids are given more CPU and memory resource according to the activity predictions. 5.4. Results of H1N1 Experiments with KD-ACP. On the basis of artificial society models and the intervention measures mentioned in Section 5.1.2, a series of computational experiments are performed to study the H1N1 influenza in Beijing. In our case of artificial Beijing, 19,610,000 agents are simulated in the cluster within 48 CPU cores and 128 G memories, the nodes are connected by kilomega networks. It takes 18 hours to simulate a 250-day disease spreading. In order to illustrate how the optimal plans are obtained by KD-ACP, the experiments are divided into four groups: the experiments of model validation, the experiments of sensitivity analysis of vaccination rate, the experiments of sensitivity analysis of isolation, and the experiments of the combination of intervention measures. These four groups show the general process of the research on emergency management in H1N1 influenza. Firstly, the models of H1N1 are validated with the support of historical data. Secondly, the traditional medical interventions of pandemic such as vaccination are analyzed to find the optimal plan. Thirdly, the traditional nonmedical interventions of pandemic such as isolation are analyzed to find the optimal plan. Finally, the combination of interventions is tested to show the combined effect.
21 It is worth mentioning that all the experiments in our work are performed 100 times. These experiments are initialized with different settings of interventions in IMCT. The results shown in the figures are the mean values. 5.4.1. The Experiments of Model Validation. In our artificial Beijing, the models of H1N1 influenza are built based on the existing researches. Wang and her colleagues had studied the H1N1 influenza by SEIR (Susceptible\Exposed\ Infective\Recovered) models [56]. With the support of their work, we build the models of artificial Beijing in the manner of multiagents. In Figure 23, the control group shown in red line is drawn based on the realistic statistical data collected in H1N1 influenza in Beijing in 2009. The influenza lasts more than six months, and more than 170,000 people are infected. Comparing with the control group, the simulated results without interventions are drawn in blue. It is obvious that the simulated case fits the control group well before 70 days. But the ascending of control group is slowed after 70 days, and the peak value (17,883) is much less than the simulated results (25,135). It is because the vaccination is activated at day 67 in control group according to the intervention measures used in 2009. The restrain by vaccination becomes effective eight days later. The change of infected number after vaccination is shown by red spotted line. The trend of control group is different from the simulation data after 75 days. However, the simulated results (blue line) in computational experiments fit the control group (as shown in Figure 23) in the first 70 days when no intervention measures are executed. The key features such as effective basic reproduction number (𝑅0 ) are also almost the same in both cases. Therefore, it can be concluded that the models of artificial society built in microview are validated by the realistic statistical data in influenza in Beijing in 2009. In this group of experiments, no interventions are executed in order to validate the models. Therefore, the simulated results of this extreme case which cannot happen today could be obtained. As shown by blue line, the number of infected agents without interventions reaches peak value at day 91 with 25,135, consisting of 8,052 in symptomatic phase and 28,950 in recovery phase. It is obvious that the total number of infected agents grows slowly at the beginning time. Then the number increases quickly when the influenza breaks, and it reaches its maximum value with 383,870 in the end. This phenomenon can be explained as in the following. At the beginning of influenza, due to the limited number of infected agents, the propagation of the disease remains slow but many agents become susceptible. When the number of infected agents increases rapidly, the spreading becomes significant. However, the number of infected agents decreases after day 91. It is because the disease spreading relies on the social networks and spatial contact networks [49]. It means that the infected agents can only infect agents either in the social relationship networks or in the spatially contacted. 5.4.2. The Experiments of Sensitivity Analysis of Vaccination Rate. According to Section 5.1.2, vaccination is a typical
22
Mathematical Problems in Engineering Table 7: The initial settings of experiments of vaccination.
25,000
Value
Parameters
Infected agents
19,610,000 40
Agent count Initial infected count Interventions activated time (𝑇Intervention ) Vaccination rate (𝑅Vaccination )
20,000
15,000
0 {0%, 10%, 30%, 50%, 70%}
10,000 Loading intervention of vaccination 25,000
5,000
20,000 0
50
100
150
200
250
Day, d
Statistical data Simulation data
Figure 23: The results with no intervention executed, and the comparison with realistic statistical data in Beijing in 2009.
Infected agents
0
15,000
10,000
5,000
medical intervention in influenza. Traditionally, the effectiveness of vaccination can only be evaluated after the influenza, and the key settings such as vaccination rate are determined by the experience. It is always difficult for emergency management organizations to find the most optimal vaccination rate in advance. Therefore, the sensitivity of vaccination rate is analyzed in this group of experiments. The settings are listed in Table 7; average results are shown in Figure 24. Vaccination rates are set linearly (10%, 30%, 50%, and 70%) to test the changes of influenza. The peak value of infected agents decreases from 25,135, 22,392, 15,787, 6,907 to 638, respectively. It shows that the more the agents are vaccinated, the smaller the peak value of the infected agents will be. In the case of 70% vaccination, the total infected agent is only 13,799. It means that the influenza in this case does not happen due to the high vaccination rate. The change of peak values also shows an interesting phenomenon. Vaccination rates increase linearly; the peak values decrease slower than the ascending of vaccination rates at beginning, but the descending becomes more and more faster with the linear increase of vaccination rate. It means that the small scale of vaccination (less than 30%) does not make sense. With the increase of vaccination rate, the number of susceptible agents decreases significantly. In sequence, the possibility of infections is lowered greatly. Additionally, it could be found that the decrease of peak values comes later than the increase of the vaccination rates. This is quite reasonable according to Mei et al.’s work in [57]. As a result, it is concluded that high vaccination rate is effective in the control of H1N1 influenza, though costly. 5.4.3. The Experiments of Sensitivity Analysis of Isolation. According to Section 5.1.2, isolation is a typical nonmedical intervention. It is the most used intervention measure in
0
0
50
100
150
200
250
Day, d
No vaccination 10% vaccination 30% vaccination
50% vaccination 70% vaccination
Figure 24: The results of loading intervention of vaccination.
the emergency management in influenza. As mentioned before, a problem also exists that the measure cannot be validated before the intervention. Therefore the sensitivity of isolation is analyzed in this group of experiments. It is worth mentioning that the isolation is usually combined with the hospital policy. It means the infected individual is sent to hospital; meanwhile the people who contact with the infected are all isolated. As a result, parameters delay to hospital and isolation duration are designed together in the settings of experiment. Delay to hospital stands for the period from infection time to hospital time while Isolation duration represents the period when an agent cannot contact others if he has contact with an infected agent. The settings of these parameters are listed in Table 8; average results are shown in Figure 25. Firstly, the parameter delay to hospital is simulated alone to test the sensitivity. The simulated results are shown in solid line in Figure 25. The peak value decreases from 6,708 to 2,218 when the delay to hospital decreases from 1.5 days to 1 day. The half day change brings the 67% reduction. Moreover, the peak value almost approximates to zero in the case of 0.5 days. The influenza does not happen in this case. It can be concluded that the earlier the infected agents
Mathematical Problems in Engineering
23
Table 8: The initial settings of experiments of isolation. Parameters Agent count Initial infected count Interventions activated time (𝑇Intervention ) Delay to hospital (𝑇HDelay ), isolation duration (𝑇IDuration )
Value 19,610,000 40 80 {(1.5, 0), (1, 0), (0.5, 0), (1.5, 3), (1, 3), (0.5, 3)}
Loading intervention of isolation
7000 6000
Infected agents
5000 4000 3000 2000 1000 0
0
50
100
150
200
250
Day, d
Delay to hospital Delay to hospital Delay to hospital Delay to hospital Delay to hospital Delay to hospital
= = = = = =
1.5 1.0 0.5 1.5; isolation duration = 3 1.0; isolation duration = 3 0.5; isolation duration = 3
Figure 25: The results of loading intervention of isolation.
are sent to hospital, the less the agents will be infected. So the construction of effective mechanism to find infected individuals is important in the emergency management of influenza. Secondly, the parameter isolation duration is added to simulate the isolation of intervention. Obviously, the isolation measure decreases the infected agents greatly. Compared to the parameter delay to hospital of 1.5-day case, the peak value decreases from 6,708 to 362 when the isolation is added in the intervention. The reduction of 6346 agents comes from the 3day isolation of agents who had contacted with the infected agents. However, the decrease of parameter delay to hospital cannot bring the similar reduction in the 3-day isolation cases. According to the figure, the peak value decreases from 362 to 51; from 1.5-day case to 0.5-day case, only 311 agents are saved from infection. As a result, the sensitivity of simulated results does not change obviously with delay to hospital in the case of isolation. It can be concluded that isolation is a more effective measure. Though it is not easy for emergency management organizations to decrease the delay to hospital due to the current monitoring mechanism, the influenza can still be controlled by isolation.
5.4.4. The Experiments of Combination of Intervention Measures. Isolation is not the only nonmedical intervention in influenza, close workspace is another common measure. When close workspace is activated, the workspaces are all closed, agents can only stay home at the closed time. Luckily, isolation and close workspace are independent from one another. It is possible for emergency management organizations to use these two measures together. So this group of experiments is designed to obtain the effectiveness of the combination of intervention measures. The parameters are initialized with different settings listed in Table 9. Parameters delay to hospital and isolation duration is set in the middle values (1 day, 3 days) according to the last section. According to the experience, close duration is set as seven days. It is known that close workspace is a really cost intervention measure; the activated time is a key parameter. With the fixed parameters mentioned before, the change of interventions activated time is analyzed in this group of computational experiments. The average results are shown in Figure 26. Compared with the simulated results of experiments discussed above, Figure 26 strongly illustrates that influenza is ceased when the intervention measures are combined together. The peak value of infected agents is 141 in the “80th days of close-workspace and isolation with 1 day delay to hospital” case while 25,135 in “no intervention” case, 2,218 in “1 day delay to hospital” case, 203 in “1 day delay to hospital and isolation” case. The interventions bring a great reduction of infection; the peak values decrease from ten thousands level to hundred level. On the other hand, the peak value even decreases to 108 when the execution time of close workspace is 10 days earlier. The date of maximum value of infected agents is advanced from the 135th day to the 108th day. The whole circle of H1N1 influenza is reduced. The results of this group of experiments show that intervention measures should be activated as soon as possible, and the compositions of interventions are more effective in emergency management of H1N1 influenza. In summary, based on the general process, lots of experiments could be done by KD-ACP to study emergency management in H1N1 influenza. Many conclusions are obtained based on the analysis of the experiments in this section. According to these conclusions, the most optimal response in our case study is the case of “70th days of close-workspace and isolation with 1 day delay to hospital.” It is because this case has the fewest infected agents relatively. But the modelling of H1N1 influenza is not sufficient. Economic and social factors of interventions, such as the money cost by vaccination and isolation, the influence of the close-workspace in society,
24
Mathematical Problems in Engineering
Table 9: The initial settings of experiments of isolation and close workspace. Parameters Agent count Initial infected count Interventions activated time (𝑇Intervention ) Delay to hospital (𝑇HDelay ), Isolation duration (𝑇IDuration ) Close workspace duration (𝑇CWDuration )
Value 19,610,000 40 70th day, 80th day 1 day 3 days 7 days
Loading intervention of isolation and close workspace 200
Infected agents
150
100
50
right corner in Figure 27. Five statuses are shown in the figure: health without vaccination, health with vaccination, incubation, being symptomatic, and convalescence. ASST provides a very direct feeling for the emergency experts. Partly with the situation from ASST, Emergency Decision Organization makes the emergency response plans to the response of the emergency scenario. With the help of plans, the epidemic in actual society can be restrained. In the meantime, the influenza information is reflected in the Internet. According to Figure 8, the data acquisition, data extraction, and data standardization of H1N1 influenza are processed in OsdRT. OsdRT is implemented by Dr. Cao’s team from Institute of Automation from Chinese Academy of Sciences [58]. The tool provides not only the reports of H1N1, SARS, hand-footmouth disease, and intestinal diseases are all monitored. The web page is shown in Figure 28; H1N1 reports from Internet are collected first. Based on the data extraction of the reports, H1N1 case of distribution is obtained and shown in the incidence map. As a result, H1N1 incidence data is regarded as the knowledge which is sent to EECT and IMCT. The settings of emergent events and intervention measures are modified in order to make artificial society approach actual society in next turn of computational experiments. With the help of OsdRT, the loop of parallel execution process integrates ACP approach.
6. Conclusion 0 50
100
150
200
250
Day, d Delay to hospital = 1; isolation duration = 3 Start close time = 70; close duration time = 7 Delay to hospital = 1; isolation duration = 3 Start close time = 80; close duration time = 7
Figure 26: The results of loading interventions of isolation and close workspace.
and even opinion transmission of H1N1 in internet, are not considered in our case study. Without the analysis of these factors, it does not make sense to talk about the most optimal intervention measures. However, KD-ACP had provided a software framework and general process of the research on emergency management. Supported by KD-ACP, the experts of emergency management are able to study emergent events such as H1N1 influenza as detailed as possible. Based on the experiments and analysis again and again, the most optimal intervention measures will be found ultimately. 5.5. Parallel Execution by ASST and OsdRT. As discussed in Section 3.5, ASST and OsdRT are used to support the parallel execution of artificial Beijing. The statistical data is collected and stored in artificial society runtime database at runtime. ASST downloads the infection data from the database and displays it in the map. As shown in Figure 27, the infected agents are distributed in the districts in Beijing. The snapshot gives the geospatial distribution of the H1N1 epidemic. The legends of the agents in different status are listed in the left
This work provides an integrated software framework for social Computing in emergency management. From a system perspective, KD-ACP provides a reliable, flexible, low cost, and effective platform for the scientists to do the research on emergency response problems. The analysis and prediction of these problems with inherent complexity can be solved by the repetition of possible alternative experiments on the software framework. Therefore, KD-ACP which is an attempt to implement ACP approach seemed as an effective computational framework to support the decision making in emergency response. Currently, KD-ACP is used to study the H1N1 epidemic in Beijing in 2009. The most optimal compositions of intervention measures are testified to support the response to next influenza. However, it is still a long way ahead before the automation, systematization, and practicalization of KDACP. A lot of work will be carried out along several directions as in the following. (i) The parallel execution process in KD-ACP is actually not strongly connected with the emergency response organization. Traditional experience and theory still play a dominant role in the decision of emergency management. It is necessary to propose a mechanism of hall for workshop to facilitate the parallel execution loop in actual society. (ii) Section 3.3 introduces the principle and process of modelling artificial society. Metamodels and models of artificial Beijing are built by GME. Model transformation and code generation are used to implement codes from FSM based models. But many details
Mathematical Problems in Engineering
Mentougou district
Shijingshan district
25
Haidian district
Dongcheng district
Health without vaccination Legend of agent health status
Health with vaccination Incubation Symptomatic Convalescence
Fangshan district
Daxing district
Fengtai district
Xicheng district
Figure 27: The situation of artificial Beijing by ASST. H1N1 Districts of Beijing H1N1 case of distribution
Incidence map Distribution of H1N1 reports from internet Incidence of H1N1 (1/100000) Fangshan district Liangxiang town Population: 19000 Incidence: 1357.89
Figure 28: The implementation of OsdRT by Institute of Automation from Chinese Academy of Sciences.
are still not illustrated due to the topic of this paper. The key techniques such as template of code framework and model transformations from specific domains to FSM will be focused and introduced in detail in our next paper. (iii) The performance of computational experiments in KD-ACP is still slower than expectation. The optimization of simulation engine and models structure is necessary to improve the performance. So it is possible to run artificial society with the real world in parallel.
collaborate with each other in solving the emergency management problems by social computing.
In summary, KD-ACP paves a new way for scientists in both emergency management and computation simulation to
(iv) Computational experiments testify the effectiveness of intervention measures.
Research Highlights (i) KD-ACP is implemented based on ACP approach. (ii) Artificial Beijing is built with the help of KD-ACP. (iii) H1N1 is modeled to simulate the influenza in Beijing in 2009.
26
Mathematical Problems in Engineering
Conflict of Interests The authors declare that there is no conflict of interests regarding the publication of this paper.
Acknowledgment
[16]
[17]
This work was supported in part by the National Science Foundation of China (nos. 91024030, 71303252, 61403402, and 91324013). [18]
References [1] W. Mao and F.-Y. Wang, Advances in Intelligence and Security Informatics, Academic Press, Oxford, UK, 2012. [2] E. Bonabeau, “Agent-based modeling: methods and techniques for simulating human systems,” Proceedings of the National Academy of Sciences of the United States of America, vol. 99, no. 3, pp. 7280–7287, 2002. [3] K. M. Carley, D. B. Fridsma, E. Casman et al., “BioWar: scalable agent-based model of bioattacks,” IEEE Transactions on Systems, Man, and Cybernetics A: Systems and Humans, vol. 36, no. 2, pp. 252–265, 2006. [4] J. M. Epstein, “Modelling to contain pandemics,” Nature, vol. 460, no. 7256, p. 687, 2009. [5] Los Alamos National Laboratory Reports about EPISIMS, Los Alamos National Laboratory, 2003. [6] C. H. Builder and S. C. Bankes, “Artificial societies: a concept for basic research on the societal impacts of information technology,” RAND Report 149, RAND Corp., 1991. [7] F.-Y. Wang, “Computational theory and method on complex system,” China Basic Science, vol. 6, no. 5, pp. 3–10, 2004. [8] F.-Y. Wang, “Toward a paradigm shift in social computing: the ACP approach,” IEEE Intelligent Systems, vol. 22, no. 5, pp. 65– 67, 2007. [9] F.-Y. Wang and S. Tang, “Artificial societies for integrated and sustainable development of metropolitan systems,” IEEE Intelligent Systems, vol. 19, no. 4, pp. 82–87, 2004. [10] D. Wen, Y. Yuan, and X.-R. Li, “Artificial societies, computational experiments, and parallel systems: an investigation on a computational theory for complex socioeconomic systems,” IEEE Transactions on Services Computing, vol. 6, no. 2, pp. 177– 185, 2013. [11] F. Wang, F. Zeng, and Y. Yuan, “An ACP-based approach for complexity analysis of E-commerce system,” Complex Systems and Complexity Science, vol. 5, no. 3, pp. 1–8, 2008 (Chinese). [12] F.-Y. Wang and P. K. Wong, “Research commentary: intelligent systems and technology for integrative and predictive medicine: an ACP approach,” ACM Transactions on Intelligent Systems and Technology, vol. 4, no. 2, pp. 1–6, 2013. [13] J. Sifeng, X. Gang, F. Dong, and H. Chunpeng, “Study on the emergency rescue decision support system of petrochemical plant based on ACP theory,” in Proceedings of the 6th Management Annual Meeting (MAM ’11), 2011, (Chinese). [14] X. Dong, D. Fan, G. Xiong, F. Zhu, Z. Zhang, and Y. Yao, “Parallel Bus Rapid Transit (BRT) operation management system based on ACP approach,” in Proceedings of the 6th Management Annual Meeting (MAM ’11), Beijing, China, 2011. [15] B. Ning, F.-Y. Wang, H.-R. Dong, R.-M. Li, D. Wen, and L. Li, “Parallel systems for Urban rail transportation based on ACP
[19] [20]
[21]
[22]
[23]
[24]
[25]
[26]
[27]
[28]
[29]
[30] [31]
[32]
approach,” Journal of Transportation Systems Engineering and Information Technology, vol. 10, no. 6, pp. 23–28, 2010 (Chinese). F.-Y. Wang, J. Zhao, and S.-X. Lun, “Artificial power systems for the operation and management of complex power grids,” Southern Power System Technology, vol. 2, no. 3, pp. 1–11, 2008 (Chinese). M. J. North, T. R. Howe, N. T. Collier, and J. R. Vos, “Repast simphony development environment,” in Proceedings of the Agent 2005 Conference on Generative Social Processes, Models and Mechanisms, 2005. M. J. North, T. R. Howe, N. T. Collier, and J. R. Vos, “Repast Simphony runtime system,” in Proceedings of the Agent Conference on Generative Social Processes, Models and Mechanisms, 2005. SWARM Development Group. Swarm 2.1.1 Reference Guide, 2000, http://www.swarm.org. S. Tisue and U. Wilensky, “NetLogo: a simple environment for modeling complexity,” in International Conference on Complex Systems, pp. 16–21, 2004. S. Luke, C. Cioffi-Revilla, L. Panait, K. Sullivan, and G. Balan, “MASON: a multiagent simulation environment,” Simulation, vol. 81, no. 7, pp. 517–527, 2005. M. Ichikawa, H. Tanuma, Y. Koyama, and H. Deguchi, “SOARS: introduction as a social microscope for simulations of social interactions and gaming,” in Organizing and Learning through Gaming and Simulation. Proceedings of the 38th Conference of the International Simulation and Gaming Association (ISAGA ’07), pp. 149–158, 2007. D. S. Burke, J. M. Epstein, D. A. T. Cummings et al., “Individualbased computational modeling of smallpox epidemic control strategies,” Academic Emergency Medicine, vol. 13, no. 11, pp. 1142–1149, 2006. F.-Y. Wang, “Parallel control and management for intelligent transportation systems: concepts, architectures, and applications,” IEEE Transactions on Intelligent Transportation Systems, vol. 11, no. 3, pp. 630–638, 2010. Z. Moln´ar, D. Balasubramanian, and A. L´edeczi, “An introduction to the generic modeling environment,” in Proceedings of the TOOLS Europe 2007 Workshop on Model-Driven Development Tool Implementers Forum, Zurich, Switzerland, 2007. S. Kelly and J.-P. Tolvanen, Domain Framework, in DomainSpecific Modeling: Enabling Full Code Generation, John Wiley & Sons, Hoboken, NJ, USA, 2007. B. P. Zeigler, H. Praehofer, and T. G. Kim, Theory of Modeling and Simulation: Integrating Discrete Event and Continuous Complex Dynamic Systems, Academic Press, San Diego, Calif, USA, 2000. G. Booch, J. Rumbaugh, and I. Jacobson, The Unified Modeling Language: User Guide, Addison-Wesley, Reading, Mass, USA, 1999. F. Wagner, R. Schmuki, T. Wagne, and P. Wolstenholme, Modeling Software with Finite State Machines: A Practical Approach, CRC & Taylor & Francis, Boca Raton, Fla, USA, 2006. T. Espiner, “China builds world’s fastest supercomputer,” ZDNet UK, October 2010. B. Chen and G. Guo, “A two-tier parallel architecture for artificial society simulation,” in Proceedings of the ACM/IEEE/SCS 26th Workshop on Principles of Advanced and Distributed Simulation (PADS ’12), pp. 184–186, July 2012. G. Guo, B. Chen, X. G. Qiu, and Z. Li, “Parallel simulation of large-scale artificial society on CPU/GPU mixed architecture,”
Mathematical Problems in Engineering
[33]
[34]
[35] [36]
[37]
[38]
[39]
[40]
[41] [42]
[43] [44]
[45]
[46]
[47]
[48]
[49]
in Proceedings of the ACM/IEEE/SCS 26th Workshop on Principles of Advanced and Distributed Simulation (PADS ’12), pp. 174–177, July 2012. S.-X. Lun, “Research on the classification of parallel execution modes of ACP theory,” Acta Automatica Sinica, vol. 38, no. 10, pp. 1602–1608, 2012. F.-Y. Wang, “A framework for social signal processing and analysis: from social sensing networks to computational dialectical analytics,” Science China, vol. 43, no. 12, pp. 1598–1611, 2013. G. Guo, One Model User’s Manual, version 1.2, National University of Defense University, 2011. Y. Ge, R. Meng, Z. Cao, X. Qiu, and K. Huang, “Virtual city—an individual-based digital environment for human mobility and interactive behavior,” Simulation: Transactions of the Society for the Modeling and Simulation International, 2014. M. Kretzschmar and R. T. Mikolajczyk, “Contact profiles in eight European countries and implications for modelling the spread of airborne infectious diseases,” PLoS ONE, vol. 4, no. 6, Article ID e5931, 2009. W. Duan and X. Qiu, “Fostering artificial societies using social learning and social control in parallel emergency management systems,” Frontiers in Computer Science, vol. 6, no. 5, pp. 604– 610, 2012. W. J. Edmunds, C. J. O’Callaghan, and D. J. Nokes, “Who mixes with whom? A method to determine the contact patterns of adults that may lead to the spread of airborne infections,” Proceedings of the Royal Society B: Biological Sciences, vol. 264, no. 1384, pp. 949–957, 1997. J. Banks, J. S. Carson, B. L. Neison, and D. M. Nicol, DiscreteEvent System Simulation, Prentice Hall, Englewood Cliffs, NJ, USA, 4th edition, 2007. H. Yongxia, “Investigation and analysis of college students’ work and rest,” Value Engineering, vol. 31, no. 3, 2012 (Chinese). W. Duan, Z. Cao, Y. Wang et al., “An ACP approach to public health emergency management: using a campus outbreak of h1n1 influenza as a case study,” IEEE Transactions on Systems, Man, and Cybernetics Part A: Systems and Humans, vol. 43, no. 5, pp. 1028–1041, 2013. H. W. Hethcote, “The mathematics of infectious diseases,” SIAM Review, vol. 42, no. 4, pp. 599–653, 2000. G. Chowell, E. Shim, F. Brauer, and et al, “Modelling the transmission dynamics of acute haemorrhagic conjunctivitis: application to the 2003 outbreak in Mexico,” Statistics in Medicine, vol. 25, no. 11, pp. 1840–1857, 2006. Y. Ge, L. Liu, B. Chen, X. Qiu, and K. Huang, “Agent-based modeling for Influenza H1N1 in an artificial classroom,” Systems Engineering Procedia, vol. 2, pp. 94–104, 2011. A. R. Tuite, A. L. Greer, M. Whelan et al., “Estimated epidemiologic parameters and morbidity associated with pandemic H1N1 influenza,” CMAJ, vol. 182, no. 2, pp. 131–136, 2010. L. Brouwers, B. Cakici, M. Camitz, A. Tegnell, and M. Boman, “Economic consequences to society of pandemic H1N1 influenza 2009—preliminary results for Sweden,” Euro Surveillance, vol. 14, no. 37, pp. 1–7, 2009. Y. Ge, L. Liu, X. Qiu, H. Song, Y. Wang, and K. Huang, “A framework of multilayer social networks for communication behavior with agent-based modeling,” Simulation: Transactions of the Society for the Modeling and Simulation International, vol. 89, no. 7, pp. 810–828, 2013. W. Duan, X. Qiu, Z. Cao, X. Zheng, and K. Cui, “Heterogeneous and stochastic agent-based models for analyzing infectious
27
[50]
[51] [52]
[53]
[54]
[55]
[56]
[57]
[58]
diseases’ super spreaders,” IEEE Intelligent Systems, vol. 28, no. 4, pp. 18–25, 2013. The Preparation and Emergency Response Plans to Pandemic Published by Ministry of Health, Ministry of Health, 2005, (Chinese). R. M. Fujimoto, Parallel and Distributed Simulation Systems, Wiley Interscience, 2000. F. Cicirelli, A. Giordano, and L. Nigro, “Distributed simulation of situated multi-agent systems,” in Proceedings of the 15th IEEE/ACM International Symposium on Distributed Simulation and Real Time Applications (DS-RT ’11), pp. 28–35, September 2011. B. Chen and G. Guo, “A two-tier parallel architecture for artificial society simulation,” in Proceedings of the 26th ACM/IEEE/SCS Workshop on Principles of Advanced and Distributed Simulation (PADS ’12), pp. 184–186, July 2012. G. Guo, B. Chen, and X. Qiu, “Parallel simulation of largescale artificial society with GPU as coprocessor,” International Journal of Modeling, Simulation, and Scientific Computing, vol. 4, no. 2, Article ID 1350005, 2013. B. Chen, L.-B. Zhang, X.-C. Liu, and H. Vangheluwe, “Activitybased simulation using DEVS: increasing performance by an activity model in parallel DEVS simulation,” Journal of Zhejiang University: Science C, vol. 15, no. 1, pp. 13–30, 2014. X.-L. Wang, P. Yang, Z.-D. Cao et al., “Quantitative evaluation on the effectiveness of prevention and control measures against pandemic influenza A (H1N1) in Beijing, 2009,” Chinese Journal of Epidemiology, vol. 31, no. 12, pp. 1374–1378, 2010 (Chinese). S. Mei, A. D. van de Vijver, L. Xuan, Y. Zhu, and P. M. A. Sloot, “Quantitatively evaluating interventions in the influenza A (H1N1) epidemic on China campus grounded on individualbased simulations,” Procedia Computer Science, vol. 1, no. 1, pp. 1675–1682, 2010. X. Qiu, Z. Cao, and Z. Li, Mid-Term Reports of China National Science Foundation 91024030, 2014.
Advances in
Operations Research Hindawi Publishing Corporation http://www.hindawi.com
Volume 2014
Advances in
Decision Sciences Hindawi Publishing Corporation http://www.hindawi.com
Volume 2014
Journal of
Applied Mathematics
Algebra
Hindawi Publishing Corporation http://www.hindawi.com
Hindawi Publishing Corporation http://www.hindawi.com
Volume 2014
Journal of
Probability and Statistics Volume 2014
The Scientific World Journal Hindawi Publishing Corporation http://www.hindawi.com
Hindawi Publishing Corporation http://www.hindawi.com
Volume 2014
International Journal of
Differential Equations Hindawi Publishing Corporation http://www.hindawi.com
Volume 2014
Volume 2014
Submit your manuscripts at http://www.hindawi.com International Journal of
Advances in
Combinatorics Hindawi Publishing Corporation http://www.hindawi.com
Mathematical Physics Hindawi Publishing Corporation http://www.hindawi.com
Volume 2014
Journal of
Complex Analysis Hindawi Publishing Corporation http://www.hindawi.com
Volume 2014
International Journal of Mathematics and Mathematical Sciences
Mathematical Problems in Engineering
Journal of
Mathematics Hindawi Publishing Corporation http://www.hindawi.com
Volume 2014
Hindawi Publishing Corporation http://www.hindawi.com
Volume 2014
Volume 2014
Hindawi Publishing Corporation http://www.hindawi.com
Volume 2014
Discrete Mathematics
Journal of
Volume 2014
Hindawi Publishing Corporation http://www.hindawi.com
Discrete Dynamics in Nature and Society
Journal of
Function Spaces Hindawi Publishing Corporation http://www.hindawi.com
Abstract and Applied Analysis
Volume 2014
Hindawi Publishing Corporation http://www.hindawi.com
Volume 2014
Hindawi Publishing Corporation http://www.hindawi.com
Volume 2014
International Journal of
Journal of
Stochastic Analysis
Optimization
Hindawi Publishing Corporation http://www.hindawi.com
Hindawi Publishing Corporation http://www.hindawi.com
Volume 2014
Volume 2014