methods consider the GO simply as a list of terms, ignoring any structural .... To prevent that larger lists of ..... [11] V. Iyer, M. Eisen, D. Ross, G. Schuler, T. Moore,.
Kernel Based Functional Gene Grouping Holger Fröhlich, Nora Speer, Christian Spieth, and Andreas Zell Abstract— During the last years, high throughput experiments have become very popular. During the analysis of such data the need for a functional grouping of genes arises. In this paper, we propose grouping genes according to their biological function by means of kernel functions, which are similarity measures having special mathematical properties and play a crucial role e.g. in SVM classification. Thereby our kernel functions rely on functional information on the genes provided by Gene Ontology annotation. We investigate and compare several provably symmetric, positive semidefinite kernel functions in combination with spectral clustering, dual kmeans and average linkage and demonstrate that our approach leads to good clustering results.
I. I NTRODUCTION Modern DNA microarray analysis has lead to an enormous and fast collection of experimental data, which has to be analyzed to gain insight into biological processes. Thereby different techniques are applied. Sometimes statistics are used to find significantly regulated genes. Other methods cluster genes according to their expression profiles [7]. The hypothesis is that genes with expression pattern similarity to known genes involved in the examined biological process, may play a role in the process, too. In both cases, researchers often end up with long lists of interesting candidate genes that need further examination. At this point, a second step is almost always applied: biologists categorize these genes to known biological functions and thus try to combine a pure numerical analysis with biological information. In this paper, we address the problem of finding functional gene clusters just based on Gene Ontology (GO) terms. The advantage of such a method is that no prior knowledge about relevant pathways is necessary except a mapping from genes to the GO. The latter is often available in public databases. While GO analysis is an increasingly important field, existing techniques suffer from some weaknesses: Many methods consider the GO simply as a list of terms, ignoring any structural relationships [2, 9, 20, 23, 31]. Others regard the GO primarily as a tree and convert the GO graph into a tree structure for determining distances between nodes [14]. Again others use a very simple distance measure that relies on counting path lengths [13]. This is a delicate approach in unbalanced graphs like the GO, whose subgraphs have different degrees of detail. Besides, such a distance does not depend on the distribution of terms in the dataset. Therefore it may not be feasible for clustering, because it may be impossible to resolve different clusters, if the data concentrates on a subgraph of the GO. The aim of many methods is primarily either to use the GO for preprocessing University of Tübingen, Centre for Bioinformatics gen (ZBIT), Sand 1, D-72076 Tübingen, Germany, {froehlic,nspeer,spieth,zell}@informatik.uni-tuebingen.de
TübinEmail:
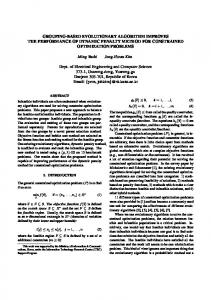
[1] or as a visualization tool [6]. Only a few approaches utilize its structure for computation. Many methods are scoring techniques describing a list of genes annotated with GO terms [2, 6, 9, 14, 20, 23, 31]. To our best knowledge, so far there exist no clustering based methods that produces a biologically plausible functional grouping of genes just based on the GO despite those proposed in our earlier publications [27, 25, 28, 26]. In this paper we concentrate on functional similarity measures between genes, which are provably symmetric and positive semidefinite kernel functions [22]. Such kernel functions play a crucial role in kernel based learning methods, e.g. like the well known SVM [30], dual k-means [24] and many others. Formally, any kernel function can be understood as a dot product k(x, x′ ) = hφ(x), φ(x′ )i between a pair of objects x, x′ in some feature space H to which the data lying in input space X is mapped via the function φ : X → H. It is known that a function k is a kernel if and only if the kernel matrix K = (k(xi , xj )ij ) computed on a set of objects {xi }N i=1 is symmetric and positive semidefinite [22, 24]. Given an appropriate kernel function as a special similarity measure, we can cluster genes according to their biological function, for instance by spectral clustering [18], dual kmeans [24] or average linkage. We investigate several possible kernel functions and highlight their advantages and disadvantages. The organization of this paper is as follows: a brief introduction to the Gene Ontology is given in section II. Section III explains the proposed kernel functions in detail. Their performance on real world datasets is shown in section IV. Finally, in section V we conclude. II. T HE G ENE O NTOLOGY The Gene Ontology (GO) is one of the most important ontologies within the bioinformatics community and is developed by the Gene Ontology Consortium [29]. It is specifically intended for annotating gene products with a consistent, controlled and structured vocabulary. Gene products are for instance sequences in databases as well as measured expression profiles. The GO is independent from any biological species. It represents terms in a Directed Acyclic Graph (DAG), covering three orthogonal taxonomies or "aspects": molecular function, biological process and cellular component. The GO graph consists of over 19,000 terms (as of October 2005), represented as nodes within the DAG, connected by relationships, represented as edges. Terms are allowed to have multiple parents as well as multiple children. Two different kinds of relationship exist: the "is-a" relationship (see for example Fig. 1: photoreceptor cell differentiation is a child of cell differentiation) and the
cell differentiation GO:0030154
is-a
regulation of cellular process GO:0050794
part-of
photoreceptor cell differentation GO:0046530
part-of
is-a
regulation of development GO:0050793
substracting its smallest negative eigenvalue λmin from the diagonal, if there is any:
is-a
K ← K − λmin I
regulation of cell differentation GO:0045595
Let us now turn to the question how the kernel kT between two terms t, t′ can be defined.
is-a
regulation of photoreceptor cell differentation GO:0046532
B. Kernel Functions for Gene Ontology Terms
Fig. 1. Relations in the Gene Ontology. Each node is annotated with a unique accession number.
"part-of" relationship (regulation of cell differentiation is part of cell differentiation). Providing a standard vocabulary across any biological resources, the GO enables researchers to use this information for automatic data analysis done by computers and not by humans. III. M ETHODS A. Gene Ontology based Kernel Functions between Genes Our goal is to cluster genes according to their function. Hence, we need some similarity measure, which in our case will be a kernel function. However, the problem when comparing two genes g and g ′ is that each gene can have multiple functions, i.e. it can be mapped on different nodes in the GO graph. On the other hand, each node in the GO graph can correspond to multiple genes. Hence, we need a way to compare g and g ′ with annotated lists of GO terms t1 , ..., tn and t′1 , ..., t′m . Assumed we already have a kernel function kT comparing two GO terms t and t′ , then a way of comparing g and g ′ is to assign each term in the smaller of both lists to exactly one term in the longer one such that the sum of term similarities is maximized. Formally this can be formulated as follows: Let π be some permutation of either an n-subset of natural numbers {1, ..., m} or an m-subset of natural numbers {1, ..., n} (this will be clear from context). Then we are looking for the quantity ′
k(g, g ) =
�
Pn maxπ i=1 kT (ti , t′π(i) ) Pm maxπ j=1 kT (tπ(j) , t′j )
if m > n otherwise
IC(c) = − log P (t) where P (t) is the probability of encountering an instance of term t. In the case of a hierarchical structure, such as the GO, where a term in the hierarchy subsumes those lower in the hierarchy, this implies that P (t) is monotonic as one moves towards the root node. As the nodes’ probability increases, its information content or its informativeness decreases. The root node has a probability of 1, hence its information content is 0. As the three aspects of the GO are disconnected subgraphs, this is still true if we ignore the root node (Gene Ontology, GO:0003673) and take, e.g., biological process (GO:0008150) as our root node instead. P (t) is simply computed using maximum likelihood estimation: P (t) =
Although it can be shown that knorm is positive semidefinite for each pair of genes g, g ′ [8], in general the resulting similarity matrix K is not. A simple way to address this problem is to shift the spectrum of the kernel matrix by
freq(t) N
where N is the total number of terms occurring in the dataset and freq(t) is the number of times term t or any child term of t occurs in the dataset. The similarity of two terms t, t′ can then be defined as follows:
(1)
The computation of (1) corresponds to the solution of the classical maximum weighted bipartite matching (optimal assignment) problem in graph theory and can be carried out in O(max(n, m)3 ) time [17]. To prevent that larger lists of terms automatically achieve a higher similarity we should further normalize the kernel [22] k(g, g ′ ) knorm (g, g ′ ) = p k(g, g)k(g ′ , g ′ )
There are a couple of semantic similarity and distances measures of different complexity [4], most of them were originally developed for taxonomies like WordNet. In this paper we use a similarity measure based on the information content of each GO term [19]. The information content of a term is defined as the probability with which this term or any child term occurs in a dataset. Following the notation in information theory, the information content (IC) of a term t can be quantified as follows:
kT (t, t′ ) = − log
min
tˆ∈P a(t,t′ )
P (tˆ) = − log Pms (t, t′ )
(2)
where P a(t, t′ ) is the set of parental terms shared by both t and t′ . As the GO allows multiple parents for each term, two terms can share parents by multiple paths. We take the minimum P (tˆ), if there is more than one parent. This is called Pms , for probability of the minimum subsumer [16]. Note that due to the nature of the GO graph topology we have ∀t, t′ : Pms (t, t′ ) ≥ P (t), Pms (t, t′ ) ≥ P (t′ ), because the common ancestor of t and t′ must be higher or equal in the graph hierarchy than each of them. Furthermore, it has been shown by Ben-Hur and Noble [3] that kT is a symmetric and positive semidefinite kernel with respect to the inifinity norm in annotation space.
There is an interesting connection to a distance measure between two terms t, t′ that was developed by Jiang and Conrath [12]: d(t, t′ )
= 2 log Pms (t, t′ ) − (log P (t) + log P (t′ )) (3) = kT (t, t) − 2kT (t, t′ ) + kT (t′ , t′ )
TABLE I M EAN SILHOUETTE INDICES FOR THE EMPIRICAL KERNEL MAP WITHOUT
(EKM) AND WITH PCA PREPROCESSING (EKM+PCA) AND (2)
THE OPTIMAL ASSIGNMENT KERNEL COMBINED WITH TERM KERNEL
(OA-T ERM ). F IRST HALF OF TABLE : DATASET I, SECOND HALF : II; SPECTRAL = SPECTRAL CLUSTERING ; AL = AVERAGE
DATASET
LINKAGE
C. Empirical Kernel Maps for Genes A different type of GO based kernel construction for genes was introduced by the authors in [25]: For each gene g annotated with a set of GO terms t1 , ..., tn we construct a feature vector φp (g) relative to a set of prototype genes p = (p1 , ..., pN )T where each prototype gene pi is also annotated with a set of GO terms t′i1 , ..., t′ini : φp (g) = (dˆ1 (g, p1 ), . . . , dˆN (g, pN ))T ,
EKM 0.4 ± 0.27 0.4 ± 0.23 0.38 ± 0.24 0.46 ± 0.24 0.4 ± 0.24 0.33 ± 0.24
EKM+PCA 0.5 ± 0.25 0.5 ± 0.24 0.47 ± 0.26 0.54 ± 0.25 0.5 ± 0.25 0.49 ± 0.25
OA-Term 0.23 ± 0.19 0.16 ± 0.15 0.24 ± 0.21 0.22 ± 0.21 0.16 ± 0.17 0.21 ± 0.21
(4)
with dˆi (g, pi ) denoting the minimal distance according to (3) between the set of GO terms of gene g and those of the prototype gene pi . This leads to the so called empirical kernel map [22]: k(g, g ′ ) = hφp (g), φp (g ′ )i.
Method spectral k-means AL spectral k-means AL
(5)
In the simplest case the set of prototype genes are just all genes from our dataset. The advantage of this approach is that this way more information is incorporated into the kernel. The obvious disadvantage, on the other hand, is that we have a large number of features, which makes this approach impractical for larger datasets, because in this case the feature vectors become very high dimensional. A possible solution to this problem would be to perform PCA on the feature vectors before applying the clustering. Similar to above, one should normalize the feature vectors to norm 1. IV. E XPERIMENTS A. Datasets One possible scenario where researchers like to group a list of genes according to their function is when they examine gene expression with DNA microarray technology, afterwards apply some filtering or statistical analysis and end up with a list of genes that show a significant change in their expression according to a control experiment. Therefore, we chose two publicly available microarray datasets, annotated the genes with GO information and used them for functional clustering. The authors of the first dataset (denoted as dataset I) examined the response of human fibroblasts to serum on cDNA microarrays in order to study growth control and cell cycle progression. They found 517 genes whose expression levels varied significantly, for details see [11]. We used these 517 genes for which the authors provide NCBI accession numbers. The GO mapping was done using GeneLynx [15]. After mapping to the GO, 238 genes showed one or more mappings to biological process or a child term of biological process. These 238 genes were used for the clustering. In order to study gene regulation during eukaryotic mitosis, the authors of the second dataset (denoted as dataset II)
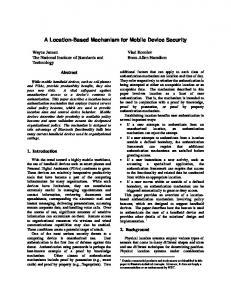
examined the transcriptional profiling of human fibroblasts during cell cycle using microarrays [5]. Duplicate experiments were carried out at 13 different time points ranging from 0 to 24 hours. Cho et al. found 388 genes whose expression levels varied significantly. Hvidsten et al. provide a mapping of the dataset to GO [10]. 233 of the 388 genes showed at least one mapping to the GO biological process taxonomy and were thus used for clustering. B. Results We compared clustering results of the empirical kernel map (5) with and without performing PCA preprocessing (EKM / EKM+PCA) and the optimal assignment kernel combined with the term kernel (2) (OA-Term). Clusterings were computed by the spectral clustering algorithm of Ng et al. [18], by dual k-means [24] and average linkage. Thereby for the k-means we used 50 restarts with random initialization and returned the clustering with the minimal distortion. Clusters, which became empty during the optimization process, were reinitialized with the point being furthest from its centroid. In case of the feature vector representation (4), for the spectral clustering we employed the usual embedding via an RBF kernel of width σ. The parameter σ was tuned in the range σ ˆ /4, ..., 4ˆ σ such that the relation between the withincluster-distortion and the between-cluster-distortion became minimal. Thereby we set σ ˆ such that exp(−D/(2ˆ σ 2 )) = 0.01 (D = dimensionality of the feature vector). For the PCA preprocessing we extracted so many principal components such that at least 95% of the total variance could be explained. This lead to just 17 principal components for dataset I and 15 principal components for the dataset II. To evaluate our results we computed the mean silhouette index [21] of the clusterings. As one can see from table I, comparing the three kernel functions, the mean silhouette indices for the empirical kernel map on average are a little bit better than those for the OA-Term method. Thereby the EKM+PCA approach gives the best results, but the differences are not significant. To further validate our results we plotted the individual silhouettes for 15 clusters. Due to the limited space we are only showing the silhouette plots
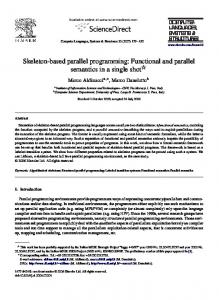
TABLE II 1 2
10
Probe ID AA001722
10 11
12 13 14 15
12 13 14 15 0
0.2 0.4 0.6 Silhouette Value
0.8
1
−0.2
0
0.2 0.4 0.6 Silhouette Value
0.8
1
AA011388
1 2 3 4
1 2 3 4 5 6
AA025800 AA026314 AA039466 AA040861 AA043362
5 Cluster
Cluster
IDENTICALLY BY K - MEANS +EKM WITH AND WITHOUT
4 5 6 7 8 9
11
−0.2
7 8 9 10 11
6 7 8 9 10 11 12 13 14 15
12 13 14 15 0
0.2
0.4 0.6 Silhouette Value
0.8
1
−0.2
1 2 3
0
0.2 0.4 0.6 Silhouette Value
0.8
1
1
4 5
Cluster
6 Cluster
A C LUSTER WITH GENES TO METABOLISM ( FROM DATASET I) FOUND
3
6 7 8 9
Cluster
Cluster
1 2 3 4 5
7 8 9 10 11 12 13 14 15
AA043796 AA044444 AA045181
2 3 4 5 6 7 8 9 10 11 12 13 14 15
0
0.2
0.4 0.6 Silhouette Value
0.8
1
AA045372 0
0.2
0.4 0.6 Silhouette Value
0.8
1
Fig. 2. Silhouette plots obtained by the dual k-means clustering using EKM (first row), EKM+PCA (second row) and OA-Term (third row) for dataset I (first column) and dataset II (second column).
for the dual k-means algorithm with all three kernel functions (fig. 2). The pictures underline the impressions of the average silhouette indices. Comparing the three different clustering methods, average linkage tends to produce clusterings having a few clusters with very many genes in it (e.g. a cluster containing half of the genes of the dataset) and many clusters with only very few genes. Spectral clustering sometimes also tends to produce very huge clusters, but less extreme than average linkage. In contrast, dual k-means produces more balanced clusters, which seems more natural (see fig. 2). Besides, we examined all clusters of all clusterings in more detail by looking at the actual GO annotations. Due to space limitations we cannot show all clusters found by all methods and for both datasets. Therefore, we confine ourselves to show some selected examples. In general, the detailed analysis of all clusters confirmed our results already indicated by the results of the silhouette indices. The optimal assignment kernel produces a little less compact clusters than the two feature vector-based kernels in combination with dual k-means, however, it has the advantage of being computationally less expensive for large datasets and also more straight forward. Tab. II shows a cluster that was identically found by both EKM-based methods (with and without PCA) and k-means, whereas tab. III shows the corresponding cluster that was found using the optimal assignment kernel combined with kmeans. Both clusters contain genes, that are annotated with GO terms related to metabolism, but the cluster found by
AA053173 AA053331 AA053461 AA054956 AA057761 AA053028
H12318 H63779
H70783 N32784
N35315 N91268 R00824 R12563 R60996 T40987 W88807 W89012 W91979
PCA.
Gene Ontology terms ATP catabolism citrate metabolism coenzyme A metabolism lipid metabolism biotin metabolism fatty acid biosynthesis L-serine biosynthesis tetrahydrobiopterin biosynthesis fatty acid biosynthesis UDP-N-acetylglucosamine biosynthesis circulation fatty acid metabolism lipid catabolism lipid transport posttranslational membrane targeting lactose biosynthesis glycolysis C21-steroid hormone biosynthesis cholesterol metabolism lipid metabolism mitochondrial transport steroid metabolism cholesterol biosynthesis isoprenoid biosynthesis steroid biosynthesis cholesterol biosynthesis steroid biosynthesis cholesterol biosynthesis asparagine biosynthesis glutamine metabolism fatty acid biosynthesis glycolysis cholesterol biosynthesis cholesterol metabolism germ-cell migration gonad development fatty acid beta-oxidation fatty acid metabolism central nervous system development epidermal differentiation lipid metabolism peripheral nervous system development fatty acid biosynthesis neurotransmitter biosynthesis and storage nitric oxide biosynthesis phenylalanine catabolism amino acid metabolism lipid metabolism steroid biosynthesis L-serine biosynthesis L-serine metabolism fatty acid desaturation aerobic respiration electron transport tricarboxylic acid cycle electron transport uroporphyrinogen III biosynthesis fatty acid beta-oxidation fatty acid metabolism cholesterol biosynthesis
the optimal assignment kernel (tab. III) additionally contains genes related to RNA processing (marked in bold). Another example are the clusters shown in tab. IV - VI found by k-means combined with the optimal assignment kernel (tab. IV) and the empirical kernel map (EKM) with
TABLE III
TABLE IV
A C LUSTER WITH GENES RELATED TO METABOLISM AND RNA
A C LUSTER WITH GENES RELATED TO DNA REPLICATION ( FROM
PROCESSING ( FROM DATASET
Probe ID AA010407 AA011388 AA025800 AA026314 AA035360 AA039466 AA045181
AA045372
AA053173 AA053331 AA053461 AA054956 AA055585 AA056338 H12318 H27557 H70783 N35315 N47794 N91268 R00824 R09377 R12563 R39209 R43728 T50056 R49309 W44416
W70150 W88807 W89012 W91979
I) FOUND BY K - MEANS +OA-T ERM .
Gene Ontology terms RNA processing biotin metabolism fatty acid biosynthesis L-serine biosynthesis tetrahydrobiopterin biosynthesis regulation of transcription, DNA-dependent fatty acid biosynthesis C21-steroid hormone biosynthesis cholesterol metabolism lipid metabolism mitochondrial transport steroid metabolism cholesterol biosynthesis isoprenoid biosynthesis steroid biosynthesis cholesterol biosynthesis steroid biosynthesis cholesterol biosynthesis asparagine biosynthesis glutamine metabolism fatty acid biosynthesis regulation of transcription, DNA-dependent ribosome biogenesis rRNA processing fatty acid beta-oxidation fatty acid metabolism regulation of transcription, DNA-dependent fatty acid biosynthesis amino acid metabolism RNA catabolism lipid metabolism steroid biosynthesis L-serine biosynthesis L-serine metabolism RNA processing fatty acid desaturation regulation of transcription, DNA-dependent rRNA processing regulation of transcription, DNA-dependent regulation of transcription, DNA-dependent drug resistance glutamine metabolism nucleobase, nucleoside, nucleotide and nucleic acid metabolism ’de novo’ pyrimidine base biosynthesis regulation of transcription, DNA-dependent uroporphyrinogen III biosynthesis fatty acid beta-oxidation fatty acid metabolism cholesterol biosynthesis
(tab. VI) and without PCA (tab. V), respectively. Again, both EKM-based methods produce clusters that only contain genes related to DNA replication and recombination, whereas the cluster produced by the optimal assignment approach contains also genes related to transcription (marked in italic) and energy pathways (marked in bold). V. C ONCLUSION We introduced provably symmetric and positive semidefinite kernel functions to assess the functional similarity of genes using the Gene Ontology only. These kernel functions can be used in combination with any kernel based clustering
DATASET
Probe ID D16562_at D26018_at D26535_at D38073_at D50370_at D79984_at L07541_at M87339_at U20980_at U28413_at U28749_at
X55740_at X62153_at X74331_at Y00764_at
II) FOUND BY K - MEANS + OA-T ERM .
Gene Ontology terms energy pathways DNA dependent DNA replication energy pathways DNA replication initiation nucleosome assembly chromatin assembly/disassembly regulation of transcription from Pol II promoter DNA strand elongation DNA strand elongation DNA replication dependent nucleosome assembly protein complex assembly DNA repair establishment and/or maintenance of chromatin architecture regulation of transcription, DNA-dependent development DNA metabolism DNA replication initiation DNA replication, priming electron transport oxidative phosphorylation aerobic respiration
algorithm such as dual k-means to automatically group genes with regard to their function. We found that the kernel function based on an empirical kernel map combined with a PCA preprocessing of the feature vectors leads to slightly better clustering results than without PCA preprocessing and than the optimal assignment kernel in combination with a kernel comparing pairs of GO terms. When evaluating the GO annotation in detail, both feature map based kernels seem to lead to more compact clusters than the optimal assignment kernel. However, the more direct optimal assignment kernel approach has the advantage that much fewer features need to be calculated explicitly and hence this method might be better suited for large data sets. All in all, we showed that all three methods are able to detect functional clusters of genes. We thus think that finally it depends on the problem at hand and the size of the dataset, which one is favorable. ACKNOWLEDGMENTS This work was supported by the National Genome Research Network (NGFN) of the Federal Ministry of Education and Research in Germany under contract number 0313323. R EFERENCES [1] B. Adryan and R. Schuh. Gene Ontology-based clustering of gene expression data. To appear in Bioinformatics, 2004. [2] T. Beißbarth and T. Speed. GOstat: finding statistically overexpressed Gene Ontologies within groups of genes. Bioinformatics, 20(9):1464–1465, 2004. [3] A. Ben-Hur and W. Noble. Kernel Methods for Predicting Protein-Protein Interactions. Bioinformatics, 21(1):i38 – i46, 2005.
TABLE V A C LUSTER WITH GENES RELATED TO DNA REPLICATION ( FROM DATASET
Probe ID D26018_at D38073_at D38551_at
D50370_at J04611_at
L07541_at M60974_at
M87339_at U27516_at
X62153_at X74331_at
II) FOUND BY K - MEANS + EKM WITH PCA.
Gene Ontology terms DNA dependent DNA replication DNA replication initiation double-strand break repair DNA recombination meiotic recombination nucleosome assembly DNA ligation double-strand break repair double-strand break repair via nonhom. end-joining DNA recombination DNA strand elongation regulation of cell cycle regulation of CDK activity DNA repair apoptosis response to stress cell cycle arrest DNA strand elongation double-strand break repair mitotic recombination meiotic recombination DNA replication initiation DNA replication, priming TABLE VI
[7]
[8]
[9]
[10]
[11]
[12]
A C LUSTER WITH GENES RELATED TO DNA REPLICATION ( FROM DATASET
Probe ID D26018_at D38073_at D38551_at
D50370_at J04611_at
L07541_at M87339_at U27516_at
X62153_at X74331_at X67155_at
II) FOUND BY K - MEANS + EKM WITHOUT PCA. Gene Ontology terms DNA dependent DNA replication DNA replication initiation double-strand break repair DNA recombination meiotic recombination nucleosome assembly DNA ligation double-strand break repair double-strand break repair via nonhom. end-joining DNA recombination DNA strand elongation DNA strand elongation double-strand break repair mitotic recombination meiotic recombination DNA replication initiation DNA replication, priming mitotic spindle elongation
[4] A. Budanitsky and G. Hirst. Semantic distance in WordNet: An experimental, application-oriented evaluation of five measures. In Workshop on WordNet and other Lexical Resources, Second meeting of the Nord American Chapter of the Association for Computational Linguistics. Pittsburgh, 2001. [5] R. Cho, M. Huang, M. Campbell, H. Dong, L. Steinmetz, L. Sapinoso, G. Hampton, S. Elledge, R. Davis, and D. Lockhart. Transcriptional regulation and function during the human cell cycle. Nature Genetics, 27(1):48–54, 2001. [6] S.W. Doniger, N.Salomonis, K.D. Dahlqusi, K. Vranizan, S.C. Lawlor, and B.R. Conklin.
[13]
[14]
[15]
[16]
[17]
[18]
[19]
[20]
[21]
MAPPFinder: using Gene Ontology and GenMAPP to create a global gene-expression profile from microarray data. Genome Biology, 4(1):R7, 2003. M. Eisen, P. Spellman, D. Botstein, and P. Brown. Cluster analysis and display of genome-wide expression patterns. In Proceedings of the National Academy of Sciences, USA, volume 95, pages 14863–14867, 1998. H. Fröhlich, J. Wegner, F. Sieker, and A. Zell. Optimal assignment kernels for attributed molecular graphs. In L. De Raedt and S. Wrobel, editors, Proc. Int. Conf. Machine Learning, pages 225 – 232. ACM Press, 2005. I. Gat-Viks, R. Sharan, and R. Shamir. Scoring clustering solutions by their biological relevance. Bioinformatics, 19(18):2381–2389, 2003. T. Hvidsten, A. Laegreid, and J. Komorowski. Learning rule-based models of biological process from gene expression time profiles using Gene Ontology. Bioinformatics, 19(9):1116–1123, 2003. V. Iyer, M. Eisen, D. Ross, G. Schuler, T. Moore, J. Lee, J. Trent, L. Staudt, J. Hudson Jr, M. Boguski, D. Lashkari, D. Shalon, D. Botstein, and P. Brown. The transcriptional program in response of human fibroblasts to serum. Science, 283:83–87, 1999. J. Jiang and D. Conrath. Semantic similarity based on corpus statistics and lexical taxonomy. In Proceedings of the International Conference on Research in Computational Linguistics, Taiwan, 1998. C.A. Joslyn, S.M. Mniszewski, A. Fulmer, and G. Heaton. The gene ontology categorizer. Bioinformatics, 20(1):i169–i177, 2004. S. Lee, J. Hur, and Y. Kim. A graph-theoretic modeling on go space for biological interpretation on gene clusters. Bioinformatics, 20(3):381–388, 2004. B. Lenhard, W.S. Hayes, and W.W. Wassermann. GeneLynx: A gene-centric portal to the human genome. Genome Research, 11(12):2151–2157, December 2001. P.W. Lord, R.D. Stevens, A. Brass, and C.A. Goble. Semantic similarity measures across the gene ontology: the relationship between sequence and annotation. Bioinformatics, 19:1275–1283, 2002. K. Mehlhorn and S. Näher. The LEDA Platform of Combinatorial and Geometric Computing. Cambridge University Press, 1999. A. Ng, M. Jordan, and Y. Weiss. On spectral clustering: Analysis and an algorithm. In Adv. Neural Inf. Proc. Syst. 14, 2002. P. Resnik. Using information content to evaluate semantic similarity in a taxonomy. In Proceedings of the 14th International Joint Conference on Artificial Intelligence, volume 1, pages 448–453, Montreal, 1995. P.N Robinson, A. Wollstein, Böhme U., and Beattie B. Ontologizing gene-expression microarray data: characterizing clusters with gene ontology. Bioinformatics, 20(6):979–981, 2003. P.J. Rousseeuw. Silhouettes: a graphical aid to the interpretation and validation of cluster analysis. J.
Comp. and Applied Mathematics, 20:53–65, 1987. [22] B. Schölkopf and A. J. Smola. Learning with Kernels. MIT Press, Cambridge, MA, 2002. [23] N.H. Shah and N.V. Fedoroff. CLENCH: a program for calculating Cluster ENriCHment using Gene Ontology. Bioinformatics, 20(7):1196–1197, 2004. [24] J. Shawe-Taylor and N. Cristianini. Kernel Methods for Pattern Analysis. Cambridge University Press, Cambridge, UK, 2004. [25] N. Speer, H. Fröhlich, C. Spieth, and A. Zell. Functional grouping of genes using spectral clustering and gene ontology. In Proc. Int. Joint Conf. Neural Networks, pages 298 – 303, 2005. [26] N. Speer, H. Fröhlich, C. Spieth, and A. Zell. Functional distances for genes based on go feature maps and their application to clustering. In Proc. IEEE Symp. on Comp. Intel. in Bioinf. and Comp. Biology (CIBCB 2005), pages 142 – 149, San Diego, USA, 2005. IEEE Press. [27] N. Speer, C. Spieth, and A. Zell. A memetic clustering algorithm for the functional partition of genes based on the Gene Ontology. In Proceedings of the IEEE Symposium on Computational Intelligence in Bioinformatics and Computational Biology, pages 252–259, 2004. [28] N. Speer, C. Spieth, and A. Zell. Spectral clustering gene ontology terms to group genes by function. In Proceedings of the 5th Workshop on Algorithms in Bioinformatics (WABI 2005), volume 3692 of Lecture Notes in Bioinformatics (LNBI), pages 001–012. Springer, 2005. [29] The Gene Ontology Consortium. The gene ontology (GO) database and informatics resource. Nucleic Acids Research, 32:D258–D261, 2004. [30] V. Vapnik. Statistical Learning Theory. John Wiley and Sons, New York, 1998. [31] B.R. Zeeberg, W. Feng, G. Wang, and A.T. Fojo et al. GOminer: a resource for biological interpretation of genomic and proteomic data. Genome Biology, 4(R28), 2003.