Each male & female live in different villas. â« All males are of similar .... o Let's say, this represents a popula
(in DMAIC)
We sample everyday.. o Everyone loves to taste a piece of sweet before buying. If one likes, we assume the full lot will have the same taste o We love those fruit-sellers who help us with a piece of mango before we make a bulk purchase o Cup few grains of rice, smell them, toss them into our mouth and take a bite: If all is well, then we are confident about the rice we purchase o Ever had a doubt on the quality of drinking water? What do we do? Bottle a small volume of water & give for testing. If results are fine, we assume the entire drinking water is safe o In metros, we may be used to checking the Air pollution figures. How do the companies report the figures? In one area, they set up a sampling station which would collect air at that location & analyse. We would believe the analysis results hold good for the entire area o Even while choosing a book, beside the reviews, we browse through the pages, read few lines and if we find them interesting, we assume the book to be interesting too o The News channels which report Election/ Poll result forecasts also resort to samples when they survey people randomly and aggregate the information o Even while meeting a new person, we observe the behaviour patterns, responses, body language and gage the individual (like in interviews)
Hence, sampling is not new. We all have used it in our daily life Here, we will look at the science behind sampling and understand its relevance in DMAIC 3
Harish Haridasan
Visualising some typical DMAIC days.. Observations
Phase
The key result area for the project or the Project “Y” needs to be understood.
Measure
We have understood the end to process around the Project “Y”. What about the data for “Y”? As per DMAIC, we need to measure the parameter As-Is. But this will take time. How much of data is sufficient for the significant representation of “Y”? What about the data for the root causes (“Xs”)? How much of the data is adequate for the
Analyse
analysis purposes? We have implemented all the solutions, but has our process really improved?
Control
A statistical validation of the process improvement is critical. We should also assess the new process capability. How much of data is adequate for these purposes? How do we align our quality control with the improved process? How many samples to take
Control
to base our judgement to accept or reject a lot?
4
Harish Haridasan
1
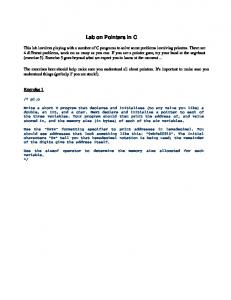
Sampling cases.. Case background: o Stress levels are quite high in the current times. It does effect the personal and professional efficiency of a person o Amongst others, Sleeping habits do play an important role in enhancing stress levels o Our objective is to collect representative data on sleeping habits for further analysis Case I:
o To get representative data, every distinct behaviour that can lead to irregular sleeping habit must be sampled o We know there is a systemic bias in the population data (every 3rd villa with a free Netflix like connection) o Since there is already a systemic bias in the data, the sampling method must not be systematic as it will lead to bias o The chosen sampling method shall ensure that each male has an equal probability to be picked up
o Let’s say, we start with only males § Living in the same housing society in a city; a society which has only independent Villas § All males are of similar age, work in the same industry and have similar family background § Let’s say, every third villa has a free streaming media-on-demand (like Netflix) connection o How would we go about sampling in this case where we need to assess the sleeping habits for these males?
o Choice of the next male should also be independent of the previous male chosen o Hence, in this case, we will pick up a sample randomly from the identified male group as it will negate the bias & give an independent representation
Simple Random Sampling 5
Harish Haridasan
Simple random sampling Used when: o The samples should be purely random o The samples should be independent of each other o There might be a bias in the data, and using systematic sampling methods will render the outcome non-representative
How is it done? o A random number generator is used to arrive at the first random number within the population size o The item ranked at this random number is picked up as the first sample o Next sample is based on the next random number generated and the procedure is continued till the sample size is not attained
Key pointers: o The procedure gives pure form of random sampling but is effort intensive 6
Harish Haridasan
2
Sampling cases.. Case II:
o The data is expected from a uniform group: same sex, same society, similar age/ work/ family background
o Let’s say, for males
o There is no systemic bias; data is random & independent
§ Living in the same housing society in a city; a society which has only independent Villas
o Simple random sampling is still a good choice o But since there is no inherent bias in the data, we can get the same representative outcome with less effort by picking up a sample systematically
§ All males are of similar age, work in the same industry and have similar family background § Let’s say, every villa has a Netflix connection (Hence, unlike
o By this we avoid the effort of identifying each new sample randomly
Case I, there is no inherent bias in the population data)
o We pick up the first sample randomly
o How would we go about sampling in this case?
o Next on, we will sample, let’s say every 3rd male/ villa
Systematic Random Sampling 7
Harish Haridasan
Systematic random sampling Used when: o The samples should be purely random o There is no known bias in the data which means the individual data-points are independent of each other Since data itself is random & independent, an effort intensive random sampling can be avoided How is it done? o First data point is selected randomly (can be based on a random number generator) o Second point onwards, it is a systematic selection. For example, every 3rd, 5th or 10th data point is selected o Hence, the sampling process is easier to manage unlike Random sampling where for each sample, one needs to arrive at the random number Key pointers: o The procedure gives random sampling, is less effort intensive o In this case, individual data points selected are not independent (as they are selected systematically) 8
Harish Haridasan
3
Sampling cases.. Case III: o In the data, there are two clear segments: Males, Females
o Let’s say, now we need information about males & females both
o Within individual segments, data is uniform
§ Living in the same housing society in a city; a society which has only independent Villas
o We consider, let’s say the Females category first
§ Each male & female live in different villas
o Within the females, we do a random sampling to get a representative sample
§ All males are of similar age, work in the same industry and have similar family background
o Then, we repeat the same for Males
§ All females are of similar age, work in the same industry and
o We aggregate the samples from both segments or strata to get the final representative sampling outcome
have similar family background
o How would we go about sampling in this case where we need to make a representative assessment of sleeping habits for both
Stratified Random Sampling
males & females in the group? 9
Harish Haridasan
Stratified random sampling Used when: o The population, from which the samples are to be drawn, contains two or more homogenous data segments or strata o Each strata is different from other and impacts the parameter being studied differently
How is it done? o First strata is selected randomly o Within the strata, depending on whether the data is random and independent or biased, we can select either Simple Random or Systematic Random Sampling
10
Harish Haridasan
4
Sampling cases.. Case IV:
o In the data, there are two clear segments: Males, Females
o Let’s say, now we need information about males & females both
o These two segments are present in multiple societies or let’s say clusters
§ Living in ALL the housing societies in a city; each society
o Male and female proportion, in each cluster, is different
considered is with independent Villas
o Hence, clusters are heterogeneous § Like earlier cases, each male & female are from different villas § Number of Males & females in each society are different § All males are of similar age, work in the same industry and have similar family background
o Here, first we select the clusters randomly o In each cluster, we take random samples from each strata (Males, Females), like in stratified sampling
§ All females are of similar age, work in the same industry and have similar family background
o Aggregate the samples to get the representative sampling outcome
o How would we go about sampling in this case where the required data is divided in multiple groups?
Clustered Random Sampling 11
Harish Haridasan
Clustered random sampling Used when: o The population, from which the samples are to be drawn, contains two or more heterogeneous groups or clusters o Each of such heterogeneous cluster has got two or more segments or strata o Each strata is different from other and impacts the parameter being studied differently
How is it done? o First, cluster is selected randomly o In the cluster, like in case of the stratified sampling, we would sample from each strata o Depending on whether the data is random and independent or has some bias within each strata, we can select either use Simple Random or Systematic Random Sampling
12
Harish Haridasan
5
Sampling cases.. Case V:
o In this case, we rely on our judgement to decide on the sample. Judgement is based on our knowledge or expertise
o Let’s say, we need information about the males only
o Such a sampling is non-random in nature
§ Based on an earlier research, we already know that the sleeping disorder is high amongst the males in the age range
o May carry bias introduced due to the judgement errors
of 45-50 § Research also points out the name of the area that’s worst
o Hence, in this case, we will apply the prior-research knowledge
hit due to it’s proximity to highway, railway line and waste
and find a society that is closest to the highway, railway line &
dump leading to high noise & air pollution
waste dump and sample the male population who are in the
§ Our job is to select a society for the sleeping habits study &
age-group of 45-50
ascertain the opinion that the males in this area are more prone to sleeping disorders, leading to increased stress levels o How can we approach sampling in this case?
Judgement Sampling
13
Harish Haridasan
Judgement sampling Used when: o The opinion of an expert is likely to give a more representative sampling over a statistical method
How is it done? o The most critical aspect is to have a very experienced professional whose expertise will ensure a representative sample o Samples are collected as advised by the expert
Key pointers: o Since the technique depends on an expert’s knowledge, chances of bias and sampling error can’t be ruled out o Technique provides a non-random sample
14
Harish Haridasan
Sampling types: Summary Sampling types Non-Statistical sampling (Judgement sampling)
Statistical sampling
Yes (like only Males)
Are we dealing with a single homogeneous data segment?
No (like Males, females)
Are these multiple data segments in one group or multiple groups?
Is data random & without any bias?
(No bias/ Independent)
Systematic Random Sampling
One group (like M-F in one housing society)
(Biased)
Simple Random Sampling
Stratified Random Sampling
15
Multiple groups (like M-F in multiple housing societies)
Clustered Random Sampling
Harish Haridasan
Sampling type decided, but how much to sample?
16
Harish Haridasan
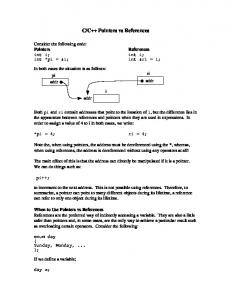
Why can’t we pickup just any sample? (Average= 5g) 5g
5g
5g
5g
5g
5g
5g
5g
o Let’s say, this represents a population of balls, each weighing 5 gms o We have to draw a sample to find the average weight of a ball o Whether we take a sample of size 1 or 2 or more, in this case we will get the average weight as 5 gms
Average= 5g
5g
5g
5g
5g
5g
o If we draw a sample, either from the 1st or 2nd or 3rd or from anywhere, we will always get a representative sample
Average= 5g
Average= 5g
5g
o Why so? o To understand the reason, let us look at this new population of balls o Each ball has a different weight in this case
(Average= 5.5g) 5g
3g
4g
8g
7g
2g
6g
9g
o If we draw a sample of size=1, average is equal to the weight of that ball (! the population average) o If we draw a sample of size 2, we may be a little more closer to population mean, yet not equal
3g
3g
Average= 3g
4g
Average= 3.5g
2g
2g
Average= 2g
6g
Average= 4g
o In Case I, if we were drawing 1 or 2 samples, each time sample mean = population mean o In Case II, for the same 1 or 2 samples, sample mean !"population mean What has changed in these two cases?
o In case II, there is a significant amount of variation in the data.. 17
Harish Haridasan
Variance & it’s role in sampling (Average= 5.5g) 5g
3g
4g
8g
7g
2g
6g
9g
o Hence, the variation is the culprit; else sampling would have been very simple (Draw from anywhere & how much ever you desire) o We know: Reality is different. There exists variation everywhere o In Statistics, Variation is represented using Variance or Standard Deviation (Average spread of data from the mean) o How do we calculate standard deviation (s)?
S.No.
Weight in g (xi)
(xi - Mean)
Sq (xi - Mean)
1
5
-0.5
0.25
2
3
-2.5
6.25
o To neautralise the effect of negative values, take a square
3
4
-1.5
2.25
o Sum up the squared values
4
8
2.5
6.25
5
7
1.5
2.25
o To estimate the average spread, divide by (n-1), where n is the number of data points
6
2
-3.5
12.25
o Take a square root of the above result to find s
7
6
0.5
0.25
8
9
3.5
12.25
o Take a difference of each data point from mean (5.5, in this case)
o Hence, for the given population:
Mean (Ball weight)
5.5
§ Mean = 5.5 g
Sum [Sq (xi - Mean)]
42
§ Standard deviation (s) = 2.4
Sum/(n-1)
42/7= 6
o This standard deviation or variance plays a critical role in determining the sample size
18
s
Sqrt (6) = 2.4 (approx.)
Harish Haridasan
The population distributions (Average= 5.5g) 5g
o Data variance causes spread in the data o The effectiveness of our decision on “How much to sample” will depend largely on how well we understand this data spread for the population
3g
4g
8g
7g
2g
6g
9g
(Population distribution)
o The effectiveness also depends on how well we can connect the sampling statistics to the population parameters o Hence, we need to understand the characteristics for the population distributions
Mean (µ) = 5.5 g (s) = 2.4
o Each population, thus follows a distribution (Can be Normal or any other nonnormal distribution) o Each population has central tendency and variance parameters (like mean (µ) and standard deviation (s), in case of a normal distribution)
19
Harish Haridasan
Understanding the population and sampling distributions (Population distribution)
o How do we connect the sampling statistics to the population parameters? (Average= 5.5g) 5g
3g
8g
4g
7g
2g
9g
6g
o Let us draw few samples from this population; let’s say of size 2, as shown below 5g
4g
7g
9g
2g
3g
8g
4g
3g
6g
7g
2g
Mean (µ) = 5.5 g (s) = 2.4
o If we plot the mean of these samples, what we get is called a sampling distribution. The central tendency and standard deviation are given by: 𝑥̅ and s respectively o These sample statistics can be used to determine population parameters using Central Limit Theorem (CLT). CLT states that
(Sampling distribution)
§ the sampling distribution tends to a normal distribution with the increasing sample size-n (In the representation above, it is 2) § The mean of the sampling distribution tends to the population mean as we increase the number of samples taken (In the representation above, we have drawn 6 samples)
s#
§ The resulting sampling distribution of 𝑥̅ is given by N(µ, ) which evolves from the distribution of linear $ combination of normal random variables § As per this distribution, Standard deviation of the sampling distribution (Standard error) is given by Population Standard deviation (s) / 𝑛 , where n is the size of samples drawn from the population 20
(𝑥̅ ,s)
Harish Haridasan
The sampling distribution and sample size o Now we know, Standard deviation of the sampling distribution (Standard error/s) is §
(Sampling distribution)
(s) / 𝑛 , where n is the size of samples drawn from the population & s is the population standard deviation
o For a population (Normal distribution), we also know that the Sigma level (Z) is given by how many standard deviations can be accommodated or fitted between the specification and the mean. §
In other terms, •
if the variation is less, then majority of the process will be always within specifications (More standard deviations can be fitted between specification & mean).
•
If variation increases, the process spread increases pushing a significant part of the process out of the specification (Lesser number of standard deviations can be fitted between specification & mean)
o Formula is given by: Z = §
() *µ)
s
, in a continuous data scenario
(𝑥̅ ,s,n)
(Population distribution)
(x)
where, (𝑥 − µ) is the range on either side of the mean within which the customer would always expect the process to be. This is termed as Tolerance (d)
o Applying the same formula in a sampling distribution,
§ Z= § Z= § n=
-) () *)
Sampling distribution standard deviation (s) d s/
.
(µ), (s)
where s/ 𝑛 = s
/ ) s 0
d
21
Harish Haridasan
The sample size (Continuous data) o Hence, Sample size can be represented as,
§ n=
/ ) s 0
d
o Since, we are estimating the sample size using statistics, we need to be aware of a term called “Confidence level”. Each statistical computation comes with a pre-declared level of confidence (1-a), where a is the Significance level o In general, we use a confidence level of 95% or 0.95 (1-a) or a significance level of 100-95 = 5% or 0.05 (a) The inference is: o The estimated mean will have 95% chance of being within the specs (a)
o But always there is a chance that 5% of the times, estimated means may lie outside the Specs. This probability is equal on both sides of the Spec, i.e. 2.5% on each side (Two-tailed) o For a given case, if the estimate lies outside the Specs, it will be either on the greater side or on the lower side o Hence, the Z value or the area of the curve is computed either till 97.5th percentile (0-97.5%) or from 2.5th percentile (1-a/2) (2.5-100%)
(1-a/2)
(2.5%)
(2.5%)
o Hence, in this case, Z-score is estimated at 1- a/2 or 1-(0.05/2) = 1-0.025 = 0.975. The value is 1.96 o Hence the formula can be re-written as: n = 1.96 s d
(0)
(2.5%)
(µ), (s)
(97.5%)
(100%)
0
22
Harish Haridasan
Hence, in case of continuous data, the Sample size is represented as,
n=
/ . s 0
d
𝑜𝑟
23
7.89 . s 0
d
Harish Haridasan
The sample size estimation - Example o We all have played or seen the Playing cards o Each pack has 52 cards o If we assign each card its value as A=1, 2=2.........., J=11, Q=12, K=13 and estimate the mean and standard deviation for the 52 cards (Population), we get mean = 7 and standard deviation = 3.78
Let us apply the sampling knowledge and design a magical event. How about telling our audience that anyone from the audience can take out 14 cards randomly and each time the mean of the cards selected would be within 7 +/- 2 (i.e. between 5-9)? Would it be possible? If yes, how? This event is based on the sample size estimation. Here the pack of cards is our population and the parameters to be considered are: § Standard deviation (s) = 3.78 § Tolerance (d) = 2 § As per the sample size formula, n = 1.96 s d
0
0
§ Hence n = 1.96 x 3.78 = 13.7 or 14 2 o That is the reason when anyone draws 14 cards, 95% of the times the mean will be between 5 and 9 24
Harish Haridasan
The sample size (Discrete data) o We know that the Sample size for continuous data is given by:
§ n=
7.89 ) s 0
d
Same logic applies to discrete data. The difference lies in the method to calculate the standard deviation. o For example, in case of a Binomial distribution, where p is defined as the probability of success or proportion non-defective, the standard deviation is given by: s =
p (1 − p)
o Hence sample size n =
7.89 0
d
x p(1-p)
25
Harish Haridasan
Hence, in case of discrete data, the Sample size is represented as,
n=
7.89 0
d
x p (1-p)
26
Harish Haridasan
A practical consideration..... We said, the sampling size can be estimated using the formula: n =
7.89 ) s 0
d
§ where d is the tolerance and s is the standard deviation for population
When we know the population standard deviation, then it’s a straight forward application of this formula to find the sample size But in real life, we rarely have access to population data, but sampling needs are always there. How do we handle such situations? A fix J à o Assume a sample size (let’s say n = 30). This can be based on the process expertise. Idea should be that the sampling duration should include all known process variations or Leans-peaks in the process o Complete the random sampling for n=30 o Estimate the mean & standard deviation for this sample. o Using these stats, compute the sample size (Say n1) o If n1 > n (30, in this case), then increase the sample size to the calculated size (n1) o Repeat the process and calculate sample size again (Say n2). If now n2 = n1 or almost equal, then n2 represents the ideal sample size. If not, repeat the process. 27
Harish Haridasan
Summary o In Six Sigma projects, where the root cause analysis and subsequent solutions are primarily based on data, sampling attains a very high significance. Hence, do no take shortcuts. o Before deciding on the sampling strategy, be clear about the sampling objective. This includes, § Where are we going to use the sampling outcome? How critical is the need? § What is the level of confidence desired in the estimation? (Higher level of confidence means higher sampling effort) § What is the tolerance acceptable to the customer? (Tighter tolerances call for larger samples) § What is the data-type we are dealing (Continuous / Discrete)? § Is the data random and independent? o Before initiating the sampling, create a detailed data collection plan. It is critical as everyone involved needs to be calibrated. o If sampling duration is large, make sure to have a process of regularly validating and sanitizing the collected data o Any special cause during the sampling duration must be recorded o Always maintain balance between the Business criteria (optimal cost, time & effort) & Statistical criteria (gaining accuracy of the sample representing the population), while sampling to select a sample size include 28
Harish Haridasan
Thank you !!!
Harish Haridasan ||
[email protected] || +91- 94492 40463 || Bangalore, India