or they input codes into numeric keypads for building secu- ..... VB.NET, is the
graphic user interface that displays informa- tion (instructions, input text box, etc.)
...
2010 IEEE/IFIP International Conference on Dependable Systems & Networks (DSN)
Keystroke Biometrics with Number-Pad Input Roy A. Maxion and Kevin S. Killourhy
[email protected] /
[email protected]
Dependable Systems Laboratory Computer Science Department Carnegie Mellon University Pittsburgh, Pennsylvania 15213 / USA
Abstract
years ago by Bryan & Harter [7], who showed that operators are distinctive due to the automatic and unconscious way their personalities express themselves, such that they could be identiſed on the basis of having telegraphed only a few words. Just as the telegraph key served as a common input medium in those days, keyboards, mice, joysticks, light pens and other pointing or scribing devices are common input devices today. Keyboard characteristics are rich in cognitive qualities [15, 28], and have great promise as personal identiſers [16]. If users’ keystroke behaviors can be distinguished automatically, users could beneſt from two-factor authentication or continuous (re)authentication, and typists could be identiſed and held accountable for what they type. There have been many investigations of keystroke behaviors. While these studies have favored using data from realworld environments, an unintended side-effect of this realism has been the introduction of confounding factors (e.g., different keyboards, operating environments, etc.) that can inƀuence experimental outcomes. This makes it quite difſcult to attribute outcomes solely to user behavior, and not to other factors along the long path of a keystroke, from ſngertip to operating system. This paper, by using tightly-controlled experiments, isolates human typing behavior as the principal factor in discriminating among user typing styles, the characteristics of which are regarded to be unique to a person’s physiology, behavior, and habits. Seeking nearly the simplest conditions possible, we studied single-ſnger typing (with no wrist rest or stabilization) in the restricted domain of numeric input, on an isolated keypad, testing the limit of what can be achieved in keystroke dynamics, and identifying the issues that inhibit maturing beyond the current state of the art. Confounding effects due to different keyboards, different passwords, different operating environments, etc. were eliminated, leaving only typing behavior as a differentiator.
Keystroke dynamics is the process of identifying individual users on the basis of their typing rhythms, which are in turn derived from the timestamps of key-press and keyrelease events in the keyboard. Many researchers have explored this domain, with mixed results, but few have examined the relatively impoverished territory of digits only, particularly when restricted to using a single ſnger – which might come into play on an automated teller machine, a mobile phone, a digital telephone dial, or a digital electronic security keypad at a building entrance. In this work, 28 users typed the same 10-digit number, using only the right-hand index ſnger. Employing statistical machine-learning techniques (random forest), we achieved an unweighted correct-detection rate of 99.97% with a corresponding false-alarm rate of 1.51%, using practiced 2of-3 encore typing with outlier handling. This level of accuracy approaches sufſciency for two-factor authentication for passwords or PIN numbers.
1
Introduction
Ascertaining the unique typing style attributed to a given user through their typing rhythms is an idea whose origin lies in the observation (made in 1897) that telegraph operators have distinctive patterns of keying messages over telegraph lines [7]. In keeping with these early observations, British radio interceptors, during World War II, identiſed German radio-telegraph operators by their “ſst,” the personal style of tapping out a message. “The interceptors had such a good handle on the transmitting characteristics of the German radio operators that they could literally follow them around Europe – wherever they were.” 1 One key aspect of ſsts is that they emerge naturally, as noted over a hundred 1 John West, British military historian specializing in intelligence, counterintelligence, & security issues, quoted in [17].
978-1-4244-7499-8 /10/$26.00 ©2010 IEEE
201
DSN 2010: Maxion & Killourhy
2010 IEEE/IFIP International Conference on Dependable Systems & Networks (DSN)
2
1
9
3
7 7
6
1 Enter
50
1
1
2
9
1
3
7
7
6
1
Enter
30
Repetition
0
10
20
30 20 0
10
Repetition
4
40
4
Subject 30
40
50
Subject 35
0.0
0.5
1.0
1.5
2.0
2.5
3.0
0.0
Time (sec)
0.5
1.0
1.5
2.0
2.5
3.0
Time (sec)
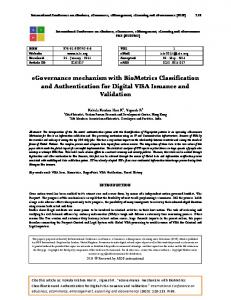
Figure 1: Keystrokes from two different users. Left panel shows Subject 35; right panel shows Subject 30. Each subject typed 50 repetitions of the number string 412-193-7761 (without the hyphens). Notice that each subject has his own distinct pattern. Solid dots indicate the moment of key-press; open dots indicate key-release. Distance between like-colored solid/open dots is key-hold time. Open space is time between key presses. Colors (grey scales if in black and white) separate one key from another, and have no other meaning.
2
Background and related work
decision trees, Markov models, etc.), different phenomena (e.g., user identiſcation (one to many) and user veriſcation (one to one)) and different stimulus data (passwords, short strings, paragraphs, etc.) [3, 4, 5, 10, 20, 22, 34]. Peacock and his colleagues have surveyed much of the current literature, demonstrating that excellent results are quite hard to achieve [25]. All of these studies used (and quite sensibly so) full QWERTY keyboards.
Keystroke dynamics is the term given to the procedure of measuring and assessing a user’s typing style. These measures, based largely on the timing latencies between keystrokes, are compared to a user proſle as part of a classiſcation procedure; a match or a non-match can be used to decide whether or not the user is authenticated, or whether or not the user is the true author of a typed sequence. As an example of differences in typing behaviors, Figure 1 shows typing samples from two different people; it’s easy to see that their styles differ, and that attempts to discriminate between them automatically are likely to succeed. There are over a hundred papers that deal with keystroke dynamics in one way or another. While it is not possible to review all of them here, we will discuss brieƀy the ones that seem most directly relevant to the current work. Keystroke dynamics on full keyboards. The ſeld of keystroke dynamics was arguably born in 1980 with the publication of a little-noticed technical report from RAND, in which a feasibility study demonstrated that typing rhythms might plausibly be utilized to identify and/or authenticate users [16]. Although the study was small in scale, it was methodologically quite well done, and its results indicated strongly that the technique had promise as an authentication mechanism. Over the next two decades, many researchers investigated a range of phenomena regarding keystroke dynamics, including the use of different features (e.g., key-hold (dwell) time, digram latencies, trigram latencies, etc.), different classiſers (e.g., neural nets, support-vector machines,
978-1-4244-7499-8 /10/$26.00 ©2010 IEEE
One advantage that has accrued to the aforementioned studies is that they have had a very rich environment in which to work. They have used all the keys, letters, numbers and special characters available on any standard keyboard. All these combinations provide many alternative avenues for success. But with that richness comes the penalty of complexity, which can make it quite hard to isolate the key factors in discriminating among typists. It is precisely that complexity issue that made us wonder if success would be less elusive in a simpler environment. Our particular simpliſcation was to restrict the stimuli to just the digits 0-9, to constrain their input to just the number pad (on the right end of most full-sized keyboards), and to limit the ſngers used to just the index ſnger. In addition to the advantage of being simpler, this environment is similar to the one used by millions of people every day when they input PIN numbers into automated teller machines (ATMs), or they input codes into numeric keypads for building security. Of course the keypads for ATMs and building security systems are not the same as the number pad on a workstation computer, but the input patterns are similar, and if users could be adequately identiſed on the basis of a PIN
202
DSN 2010: Maxion & Killourhy
2010 IEEE/IFIP International Conference on Dependable Systems & Networks (DSN)
For the PIN “5555” they obtain an equal-error rate of 1.1%, using an unspeciſed classiſer. Given the task and the short range of digits typed, this is an extraordinary outcome, perhaps explained by the large number of trials and the small number of subjects. Clarke and Furnell [13], in an extension of [11], asked 30 subjects to enter 30 repetitions each for both a 4-digit PIN and an 11-digit telephone number into a mobile phone that was specially instrumented to collect keystroke timing data. Using interkeystroke latencies as inputs to a neural network, they achieved an equal-error rate of 8% for the 4-digit PIN and 9% for the 11-digit phone number. Clarke and Furnell [14] asked 32 subjects to enter a 4digit PIN and an 11-digit telephone number on a mobile telephone handset. Each subject typed 30 correct repetitions in a single session (incorrect trials were rejected and repeated). Using pooled best results for speciſc subjects for a neural network classiſer, they obtained equal-error rates of 8.5% for the PIN and 4.9% for the telephone number. There are several commercial systems on offer (e.g., BioPassword (now AdmitOne), PSYLock, Trustable Passwords), but since no evaluation data are publicly available for these systems, we do not discuss them here. The results of these studies have been mixed, possibly due to the realism of the experiments, possibly due to a lack of real differences among users, or possibly due to experimental errors or faulty data. A careful reading of the literature suggests that complexity and bias have caused previous results to be disappointing, but since these studies do not tend to be replicated, it’s hard to pin the discrepancies on any one thing. In the work that follows, we control the experimental environment carefully to increase the likelihood that our results will be free from the entanglements of experimental complexities and confounds.
(perhaps a few characters longer than the typical four digits), there’s a possibility that keystroke dynamics could play a role in banking and secure-area operations. Keystroke dynamics on number pads. We are not the only ones to investigate a numbers-only regime. Several studies have been done in which mobile-phone keypads were used as input devices; other studies restricted themselves to using only the numeric keypad portion of a standard keyboard. Examples of such investigations follow. Note that many of these studies use a ſgure of merit called the equal-error rate (EER) [33]. This is a one-number summary of how well a detection system performs, derived from an ROC curve by noting the point at which the false-alarm rate is the same as the miss rate. Lower values are better. Rodrigues and his colleagues [27] asked 20 subjects to type 40 repetitions of 8-digit numerical passcodes. A separate group of impostors typed 30 repetitions of the same passcodes in attempts to break in. A hidden Markov model used four types of features, all of which were latencies of the various combinations of key-press and key-release times, to achieve an equal-error rate of 3.6%. Clarke et al. [12] asked 16 subjects to type 4-digit and 11-digit pre-assigned, ſxed passcodes on the keypad of a specially instrumented mobile phone. Each subject typed 30 repetitions, 20 of which were used to train a “combined” neural net classiſer, and 10 of which were used for testing. Each subject acted as an impostor for all the other subjects. The classiſer achieved an equal-error rate of 5.5% for the 4-digit passcode, and 3.2% for the 11-digit passcode. Ord and Furnell [24] performed experiments using just the keypad portion of a standard workstation keyboard. They asked each of 14 subjects to type 50 repetitions of a 6-digit numerical PIN. They used the ſrst 30 repetitions for training a multi-layer perceptron, and the remaining 20 repetitions for testing. Setting the detector’s decision threshold at 30%, meaning that 30% of attempts were falsely rejected, based on the idea that most systems allow three tries in case a passcode is mis-typed, they achieved a correctclassiſcation rate of 90.1%. Kotani and Horii [18] tested 9 subjects using a pressure/force-sensitive keypad, which was custom built in the shape of an automated-teller-machine’s numeric keypad. All subjects typed the same 4-digit PIN, using only their right index ſnger. An ad hoc classiſer, based on threshold values obtained from subjects’ reference signatures, used key-hold times, peak force on the keyboard, and digraph latency times as features. The obtained equal-error rate was 2.4%, which is reasonably impressive, considering an input of only 4 digits. Ogihara and his colleagues [23] used a clever combination of ſnger/hand motion and key-press timing on a touchscreen automated teller machine. Ten subjects typed 4-digit, static PINs (always the same digit sequence) in 1800 trials.
978-1-4244-7499-8 /10/$26.00 ©2010 IEEE
3 Problem and approach Previous work appears to have concentrated on what can be accomplished in real-world environments. As a consequence, some confounding factors have slipped into experiments, making it hard to determine exactly what factors are responsible for experimental outcomes. For example, because keystroke timing may be inƀuenced by things other than the typists themselves (due to different keyboards, different system loads, or different network paths), it’s possible that such factors could account for at least part of the success of previous work. To tease these factors apart, and to determine how well users can be discriminated solely on the basis of their typing rhythms, we engaged in a controlled experiment with the impoverished conditions of using only the number-pad portion of a keyboard, and having users type a ſxed, 10-digit number using only one ſnger. This is nearly as simple an environment as could be imagined, without the richness (and complexity) of all the keys
203
DSN 2010: Maxion & Killourhy
2010 IEEE/IFIP International Conference on Dependable Systems & Networks (DSN)
and characters on the keyboard, and without all ten ſngers. We are trading richness for simplicity. If discrimination is possible under these conditions, then moving to richer and more realistic environments could effect even better results. It may be worth noting that it is not our intention to build or describe a robust procedure that is nearly product-ready. Rather, we are building and describing a science and technology that may one day support a product. Our objective at this stage is to investigate the feasibility of the technique, rather than to provide a complete solution to the problem.
4
a PIN number, or a building passcode. The hyphens are only for readability; in practice, no one would type them. The passcode was ten characters long for a variety of reasons. First, ten characters is probably longer than the average passcode (many older UNIX systems only used the ſrst 8 characters of a passcode, and people are used to typing passcodes of about that length). If the passcode had been shorter, there may not have been enough characters to facilitate sufſcient discrimination among subjects. If it had been longer, it might have become burdensome for people to type repetitively, as was required (see Section 4.5 on procedure). The same passcode was assigned to all subjects, in contrast to having each subject select a passcode of his own choosing. There were several reasons for this. First, selfselected passcodes may be of different lengths, making their typing hard to compare. Second, self-selected passcodes might be chosen because they are easy to type (or, in perverse cases, particularly hard to type), again introducing biases that are difſcult to control. Third, using all the same passcode means that each subject can be treated as an impostor for all the other subjects, putting testing on a ſrm foundation. Finally, using the same passcode for everyone effected experimental control over unanticipated biases. The particular number 412-193-7761 was chosen for a variety of reasons. Memorizing a ten-digit number can be intimidating for many people, but since people routinely memorize telephone numbers (including area codes), having a number that was readily identiſable as a telephone number made it easier for subjects to have conſdence that they could type the number handily. The triplet 412 is a familiar area code for subjects in the experiment. For the sake of publication and potential liability, we didn’t want the digit string to be a real phone number. The three digits after the area code (193) are commonly called the preſx. By convention, a preſx must start with a number between 2 and 9 [1]. Starting the preſx with a 1 means there is no risk that the digit string is actually someone’s phone number, eliminating the potential for crank calls. Because we had only one opportunity (in this experiment) for typing digit strings, we chose a string from which we could learn the most. The digits after the preſx were chosen to cause the typist to perform a wide variety of keyboard movements. Since subjects were restricted to using only the index ſnger, we chose a digit string that would include as many basic ſnger moves as possible. The sequence 1-9-3-7 spans the keypad. A ſnger typing this sequence travels both of the diagonals, and a vertical. Hence, we can see whether people travel from 1 to 9 at the same speed as they travel from 3 to 7. The digram 7-7 exists because we wanted the sequence to have a duplicate key. A digram that involves no ſnger transit can be useful for inferring how long a subject spends actually pressing and releasing a single key. The movement involved in se-
Experimental method
We offer here considerable detail regarding the conduct of the experiment, because these particulars can best reveal potential biases, confounds, and threats to experimental validity.2 Although it is not typical to include such detail, we do so in the interest of other investigators being able to replicate our work, to judge whether we did it correctly, to take up where we’ve left off, or to see problems that we did not.
4.1 Subjects Subjects were 28 volunteer students and staff, all experienced computer users, from the CMU computer science department. These subjects included advanced undergraduate students, graduate students, and professional staff. All subjects had been typing on computer keyboards for a minimum of ſve years. Payment was not given; some students participated as part of a course. The pool from which the subjects were selected is sometimes called a convenience sample, because it is convenient to draw from such a close-by population. Sometimes conclusions based on convenience samples cannot be generalized to a broader population. In our case, however, the population was sampled not so much for mere convenience; it was, in fact, the population in which we were most interested – skilled computer users. Consequently, the sample is less of a convenience sample than it may seem, and conclusions based on our data can certainly be generalized to a broader population of similar users. Whether generalizations extend to people who are not experienced typists remains an open question, subject to further investigation.
4.2 Materials: stimulus and rationale Stimulus material consisted of a single, 10-digit, passcode, 412-193-7761, which subjects were asked to type without the hyphens, as if it were a telephone number, or 2 Validity refers to the scientiſc accuracy of the study or procedure, e.g., the presence of confounding variables, unrepresentative samples, inappropriate statistical tests or violations of statistical assumptions, or experimenter/subject bias. In other words, was the experiment done correctly, and was it conducted in such a way that no obvious biases were introduced that could skew the results toward an invalid conclusion?
978-1-4244-7499-8 /10/$26.00 ©2010 IEEE
204
DSN 2010: Maxion & Killourhy
2010 IEEE/IFIP International Conference on Dependable Systems & Networks (DSN)
whose characteristics were: frequency of one Hertz, amplitude of 3.8 volts peak-to-peak, duty cycle of 50%, DC offset of 2 volts, and rise time of 20 nanoseconds. The keyboard matrix was triggered by the square wave via a simple TTL logic tri-state output latch, with the “enable” input tied to the clock line (the output of the function generator). Three thousand keystroke events (one key-press and one key-release per event) were triggered. 81.3% had zero error, and 18.7% had an error of 200 microseconds (or 0.2 milliseconds). At worst, timing is accurate to a precision of 200 microseconds.
quences 7-6 and 6-1 are symmetric (with a vertical axis of reƀection), representing a “knight’s move” across the keypad (i.e., down one and over two). They were chosen because, after having selected the previous digits, they were movements that had not yet been made by the typist, and they are the second longest movements from one key to another on the keypad. Putting all this together, we get 412193-7761. Finally, since the number consists of familiar strings (412) and random ones (776), we can see whether there are different practice effects or discrimination accuracies based on these different spans, in addition to the phone number in its entirety. Other digit strings may meet these criteria; our string may not be unique. However, in the end, the passcode includes all but two keys on the square portion of the keypad (5 and 8 are never typed; 0 is outside the square), and it includes nine different vertical or horizontal movements that seem characteristic of keying patterns.
4.4 Instructions to subjects Subjects were instructed to use only the external keyboard, and they were advised that no mouse would be needed or would be available. Subjects were asked to type 50 repetitions of the experiment passcode (412-193-7761) into a text box on the screen, when prompted by the presentation software to do so. Subjects were instructed to type with only the index ſnger of the right hand (irrespective of the dominant hand), as if dialing a telephone or entering a PIN at an automated teller. Any error in typing caused the text box to reset, requiring the subject to type the entire passcode again. In this way, 50 perfectly typed passcodes were obtained. Subjects were told that if they needed a break or needed to stretch their hands or ſngers, they were to do so after they had typed a full passcode, including the Return key. This was intended to prevent artiſcially anomalous key-hold times and inter-key latencies in the middle of a passcode. Subjects could gauge progress by looking at a counter at the bottom of the screen which showed how many passcodes had been typed and how many yet remained. Subjects were admonished to focus on the task, as if they were logging into their own account, and to avoid distractions, such as talking with the experimenter, while the task was in progress.
4.3 Apparatus Our experience suggests that the particulars of apparatus used in experiments are of signiſcant importance, and so we provide considerable detail for the beneſt of others who may wish to replicate the conditions under which our experiments were run, or to determine for themselves whether or not our tests were biased by experimental apparatus. Computer and environment. All experiments were run on an IBM ThinkPad X60s notebook computer (type-model 1702-4EU) with 1.5 Gb RAM. The operating system was Windows XP Professional (Service Pack 2). We used an external keyboard – the Apple M9034LL/A USB; this is the typical external keyboard used with Apple machines. No mouse or other cursor-movement device was available. An external display was used for better visibility; it was a Dell UltraSharp 1907FP 19-inch ƀat panel LCD with 1280x1024 pixel resolution. Both wired and wireless networking was turned off, and there was no load on the machine other than the keystroke-logging application itself.
4.5 Procedure Subjects typed 200 error-free repetitions of the same 10digit string, using only their right index ſnger (irrespective of dominant hand). The 200 repetitions were accumulated 50 repetitions at a time, in each of four sessions carried out over four alternating days. This provided enough repetitions to reach a level of comfort with the string, just the same as when getting used to a new password. This “level of comfort” can be more formally described as habituation or automaticity – the ability to do things without occupying the mind with the low-level details required. It is usually the result of learning, repetition, and practice (see [29, 30] for a review). Nonlinear regression shows that full practice is reached after 80-100 repetitions. On average, the typing task itself takes less than ſve minutes within a session.
Presentation and logging software. A presentation program displayed the passcode to the user in a full-screen window on the display, and directed the user to type it into a text-entry box within the user interface. The presentation program has two components: a Logger and a Prompter. The Logger is a DLL, written in C++, that logs each keydown and key-up event to a ſle. The Prompter, written in VB.NET, is the graphic user interface that displays information (instructions, input text box, etc.) to the user. Timing resolution was 100 microseconds via a specialized clock. Calibration. Keystroke timing accuracy was calibrated by pulsing the keyboard matrix with a known signal; we used a Hewlett Packard model 33120A, 15 MHz function and arbitrary waveform generator. We used a square wave
978-1-4244-7499-8 /10/$26.00 ©2010 IEEE
205
DSN 2010: Maxion & Killourhy
2010 IEEE/IFIP International Conference on Dependable Systems & Networks (DSN)
5
Classiſer, features and training
subject – 25 from each of a subject’s four sessions of 50. This was done so that the training set would contain equal amounts of data from each subject, while controlling for potential within-subject variation between sessions. (Although such stringent sampling across sessions would be impractical in a real-world setting, we wanted to establish how well the detector could perform before having to account for this additional challenge.) Finally, to control for within-session changes in typing behavior, the 25 passcodes were drawn randomly from each session (e.g., rather than taking the ſrst 25, we took a randomly-selected 25 from each session). The testing data were composed of the half of the data that remained after the training data were drawn. Using the training data, a random-forest classiſer was built to predict which subject (denoted as the subject’s ID number) had typed a passcode on the basis of the passcode’s timing features (see Section 5.2 for description of features). We used the implementation of the random forest training algorithm that is part of the randomForest R package (version 4.534) by Liaw and Weiner [19]. We evaluated the classiſer by using it to predict the subject ID of each of the passcodes in the test sample, comparing the predicted subject IDs to the actual subject IDs. We created a 26-by-26-dimension confusion matrix in which the element in row i, column j is a count of the number of times the subject with true ID i was predicted to have ID j by the random forest. Since we used a random sample to divide the data into training and testing sets, and we wanted to account for the effect of this randomness, we repeated the above procedure ſve times, each time with an independently selected draw from the entire data set. This yielded ſve confusion matrices, only one of which was chosen for use in this paper – that was the one with the median misclassiſcation rate. The variation of misclassiſcation rates across all ſve draws had a range of only 0.6 percentage points. Hence the choice of which of the ſve matrices to explore is of small import.
This section explains the classiſer that we used, the features it employed, and its training and testing. The R statistical programming environment (version 2.10.0) [26] was used for analyses.
5.1 Classiſer - random forest We used the random forest classiſer, introduced by Breiman [6]. Random forests are an ensemble method based on the generation of many classiſcation trees from one data set. Each tree is obtained through a separate bootstrap sample from the data set. Each tree classiſes the data, and a majority vote among the trees provides the ſnal result. Although support vector machines are often considered to be the best classiſers currently available, random forests are strong competitors, frequently outperforming SVMs [8, 21]. The random forest classiſer is generally a good performer because it is robust against noise, and because its tree-classiſcation rules enable it to ſnd informative signatures in small subsets of the data (i.e., automatic feature selection). In contrast, SVMs do not perform variable selection, and can perform poorly when the classes are distributed in a large number of different but simple ways.
5.2 Features used in the classiſer During typing, all key-press (key-down) and key-release (key-up) events were timestamped and recorded. From these events, each of the three features used in the randomforest classiſer can be derived: (1) hold time (time elapsed from key-down to key-up of a single key); (2) digram latency (time elapsed from the key-down of a character being typed to the key-down of the next character); and (3) digram interval (key-up to key-down latencies between digrams). For a ten-digit passcode, there are 11 hold times (including the return key), 10 key-down to key-down latencies, and 10 key-up to key-down intervals, which taken together form a 31-dimensional vector that represents each passcode repetition. All three features were used, because they form a superset of the features commonly used by other researchers. Although some of these features are linearly dependent, this is not a concern when using a random forest, because the random forest performs feature selection as part of its training, thereby accommodating any linear dependencies among features.
6 Analysis and results Performance was measured in terms of classiſcation error, by which we mean the percentage of the instances in which the system misclassiſed a legitimate user (mistakenly calling him an impostor) or misclassiſed an impostor (mistakenly admitting him as if he were a legitimate user). In classical signal-detection terminology, these would be called, respectively, Type I error (variously called false alarm or false positive or false rejection) and Type II error (miss or false negative or false acceptance) [31]. Many researchers report performance in terms of the equal-error rate (EER), sometimes called crossover error rate. EER is a one-number summary of how well a detection system performs; it is the point at which the false-alarm rate is the same as the miss rate. Lower EER values are better.
5.3 Training and testing procedures In this section we show how the random-forest classiſer was trained and tested. As a reminder, each of the subjects typed the passcode 200 times, in four sessions of 50 repetitions each. Half of the data were selected to use in training the detector; the other half were used to test the detector. For the training phase, we drew 100 passcodes from each
978-1-4244-7499-8 /10/$26.00 ©2010 IEEE
206
DSN 2010: Maxion & Killourhy
2010 IEEE/IFIP International Conference on Dependable Systems & Networks (DSN)
The EER is often an extrapolation of miss and false-alarm rates, so it tends to be less exact and, therefore, less informative than separate miss and false-alarm rates. Equal-error rates should be used with caution, because they can be derived in more than one way, making them hard to compare; but they are a sensible attempt to rank systems on the basis of a one-number summary. We use them here because some of the authors in Section 2 reported only EERs, and we wanted to compare our results with theirs as best we could. Cost of error. To simplify comparing results stated in terms of misses, false-alarms and EERs, we use the cost of error, which is based on the miss and false-alarm rates. We use two kinds of cost: unweighted and weighted. Unweighted error. When neither one of a miss or a false alarm is judged to be more serious than the other (a situation which some call “equal cost of error”), the cost of error can be measured as the sum of the miss rate and the false alarm rate. This unbiased measure is not likely to be used in practical situations, but it is useful when we don’t know the appropriate bias terms that might be used in real-world conditions. Example: given a correct detection rate of 99% (miss rate of 1%), and a false alarm rate of 1%, then the unweighted cost of error is the sum of these: 1 + 1 = 2. In this example, the EER would also be 1, and its unweighted cost would be 2. Weighted error. In deployment situations in which one type of error is more serious than the other, the total cost of error is weighted toward the more serious error type. As an example of weighted error, the European standard EN-50133-1 for biometric access-control systems requires a miss rate of not more than 0.001% and a false alarm rate of less than 1% [9]. Said another way, the standard requires not more than one accidental granting of access (a missed detection) to an illegitimate user in a hundred thousand attempts, and at the same time, fewer than 1,000 false alarms (accidental rejections). A miss is regarded as being 1,000 times as serious as a false alarm, engendering a cost ratio of 1,000 to 1. It is this standard to which we aspire. From our example above (1% miss rate and 1% false alarm rate) the weighted cost of error, based on the European standard, would be 1 ∗ 1000 + 1 = 1001. If the standard were met, and we really did have .001% misses and 1% false alarms, then the weighted cost of error would be 0.001 ∗ 1000 + 1 = 2. If we were to use EER in this case (taking the extreme position of setting the EER to .001, with miss and false alarm rates being equal), the unweighted cost of EER would be .001 + .001 = .002, and the weighted cost would be .001 ∗ 1000 + .001 = 1.001.
European Standard (Baseline/Goal)
Unweighted Cost
Weighted Cost
1.001 .002
2 1.001
Basic
99.54% 0.46% 12.50% 8.60%
hits misses false alarms EER
12.96 17.20
472.50 8608.60
Outlier Handling
99.74% 0.26% 7.14% 4.42%
hits misses false alarms EER
7.40 8.84
267.14 4424.42
2 of 3
99.96% 0.04% 5.58% 3.51%
hits misses false alarms EER
5.62 7.02
45.58 3513.51
Outlier Handling (2 of 3)
99.98% 0.02% 2.18% 1.45%
hits misses false alarms EER
2.20 2.90
22.18 1451.45
Practiced (2 of 3) plus outlier handling
99.97% 0.03% 1.51% 1.00%
hits misses false alarms EER
1.54 2.00
31.51 1001.00
Table 1: Error rates and costs of error for basic and alternative analytical approaches. The best weighted results are for 2-of-3 with outlier handling; the best unweighted results are for practiced typing, 2-of-3, with outlier handling. shows the target values for attaining the levels needed to meet the European standard; these are the target numbers against which to compare our results. The basic results for our experiment (without enhancements), shown in the second major row of the table, were: Metric
Achieved
Target
hits misses false alarms EER unweighted cost weighted cost
99.54% 0.46% 12.50% 8.60% 12.96 472.50
99.999% .001% 1.000% .001% .002 1.001
These numbers are good, although far from the target values. The numbers can be improved through the use of certain analytical enhancements, which we describe below.
6.2 Analytical enhancements and their effects The basic results can be improved by any of several analytical enhancements that consider how outliers in the data are treated, how many times someone types a passcode (encores), and the amount of practice the typist has with the particular passcode being used.
6.1 Basic results Table 1 shows a range of experimental outcomes, each of which will be explained below. The ſrst row of the table
978-1-4244-7499-8 /10/$26.00 ©2010 IEEE
Raw Results 99.999% hits .001% misses 1.0% false alarms .001% EER
207
DSN 2010: Maxion & Killourhy
2010 IEEE/IFIP International Conference on Dependable Systems & Networks (DSN)
improve as the typist becomes more and more consistent. If you think about times when you change your password, you have a feel for how it gets progressively easier to type the new password ƀuently, smoothly and rapidly. Given that subjects typed 200 repetitions of the passcode, it’s possible that the classiſer would be better at distinguishing among users during their ƀuent stage than during their learning stage. To test this notion, we ran the data through a random forest in two ways. First we used all 200 repetitions; later we used only the last 50 repetitions, which would have been the most practiced. For the entire 200-repetition data set, we achieved a hit rate of 99.54%, a false-alarm rate of 12.50%, and an equalerror rate of 8.60%, as shown in the Basic row of Table 1. For the last 50 repetitions of the data, which would have been relatively more practiced than the ſrst 150 repetitions, we achieved a hit rate of 99.66%, a false-alarm rate of 9.29%, and an equal-error rate of 5.32% (not shown in the table), indicating that there is an effect from practice. However, this can be improved even more by applying both of the aforementioned 2-of-3 encore and outlier handling treatments to the practiced data. Table 1 shows the results of doing this: 99.97% hits, 1.51% false alarms, and 1.00% EER, with a corresponding best unweighted cost of 1.54 (due to the low false-alarm rate). The even lower weighted cost for outlier handling combined with 2-of-3 encore (22.18), was due to weighted cost being dominated by a slightly lower miss rate (.02 vs. .03).
Outlier-handling effects. An outlier is an extreme or atypical data point whose value is markedly different from surrounding data points that represent the same phenomenon. For example, it takes 3.016 seconds, on average, to type the passcode. If it took someone 12 seconds to type one of the 200 repetitions, that repetition would be an outlier. The left panel of Figure 1 shows a few prominent total-time outliers as well as some key-down latency outliers (note repetitions 1, 17 and 22 starting from the bottom). These vectors are outliers not only in terms of total typing time, but also in terms of some interkey latencies. Such outliers can affect classiſcation outcomes unless they are specially treated (which is typical to do). Handling outliers requires two steps: detection and accommodation [2]. In this work, an outlier detector ƀags points that are more than 1.5 IQRs (inter-quartile range) greater than the third quartile, or more than 1.5 IQRs less than the ſrst quartile. This is the usual convention in constructing boxplots [32]. Outliers are accommodated by a resampling procedure in which the outlier is replaced by a random sample, which is not an outlier, drawn from the same subject’s data in the same region of the outlier. This assures that no data are synthetic, and that all data are accommodated. The same outlier handling procedure was applied to all features of the data, improving the basic hits from 99.54% to 99.74%, and lowering false alarms from 12.50% to 7.14%. The corresponding reductions in unweighted and weighted costs of error are from 12.96 to 7.40 and 472.50 to 267.14 respectively. While this is not as much of an improvement as effected by 2-of-3 encore typing (below), it only uses one repetition of the passcode, not three. Encore effects. Encore means repeat, and one way of ensuring that someone inputs a passcode (or its rhythm) correctly, is to ask that the passcode be typed more than once. This is not as burdensome as it may seem at ſrst blush. The passcode used in this study took an average of 3.016 seconds to type, across all 28 subjects; the median typing time was 2.732 seconds. So to type the passcode three times would take perhaps 6 to 9 seconds, which is not a big price to pay if classiſer accuracy improves, especially if increased security demands it. We investigated the effects of having people type the passcode correctly k out of n times, where n had a maximum value of 3. Results improved when typists entered the passcode three times, two of which had to match the user’s proſle. As shown in Table 1, hits went up from 99.54% to 99.96%, while false alarms dropped considerably from 12.50% to 5.58%. The dramatic reduction in false alarms renders encore typing as the best of the enhancement approaches, taken singularly, without users having to practice typing the passcode. Practice effects. As a person types a passcode over and over, performance improves; the typing gets more ƀuent or consistent or practiced. Classiſer performance is likely to
978-1-4244-7499-8 /10/$26.00 ©2010 IEEE
7 Discussion In judging the merits of a keystroke-dynamics detector, it’s arguable that the preferred ſgure of merit should be the weighted cost of error, based on the European standard for biometric authentication systems (see row one of Table 1). The target cost is 2. We achieved 472.50 under basic conditions, and 22.18 when typing 2-of-3 encores and using outlier handling to mitigate extreme values. EER was 1.45%. While our work cannot be compared directly with some of the papers described in Section 2 (due to ſgure-of-merit and device differences, e.g., mobile phone vs. large keyboard), our results compare favorably with other work listed there. Rodrigues and his colleagues [27] asked 20 subjects to type 40 repetitions of 8-digit numerical passcodes. They achieved an equal-error rate of 3.6% (weighted cost of 3503.5). Ord and Furnell [24] performed experiments using just the keypad portion of a standard workstation keyboard. They asked each of 14 subjects to type 50 repetitions of a 6digit numerical PIN. They achieved a correct-classiſcation rate of 90.1% (false-alarm rate was not reported, so cost of error cannot be calculated). Kotani and Horii [18] tested 9 subjects using a pressure/force-sensitive keypad, which was custom built in the shape of an automated-teller-machine’s numeric keypad. All subjects typed the same 4-digit PIN,
208
DSN 2010: Maxion & Killourhy
2010 IEEE/IFIP International Conference on Dependable Systems & Networks (DSN)
will be available for input to a classiſer. Second, we used only the most fundamental features of the data – basic combinations of key-press and key-release timings. A richer set of features, spurned here in the interest of simplicity, could improve results. Finally, we did not accommodate the idiosyncrasies of user mistakes. When users make typographical errors, it is likely that these, too, will confer some uniqueness to the user, and this information can be used to advantage in identifying a typist.
using only their right index ſnger. They achieved an EER of 2.4% (weighted cost of 2402.4). One interesting aspect of the present study is that the subjects were well differentiated, even though they typed without resting a hand or wrist on a stable platform, as one does when typing regular text on a regular keyboard. The lack of stability would seem to have introduced more variability in typing, and yet the results were good despite this. This suggests that using keystroke dynamics as an authentication mechanism for banks and buildings may be possible. Success factors. The present work achieved a weighted cost of 22.18 for 2-of-3 encore-plus-outlier typing – a considerable improvement over past work. What are the factors that account for our results, and what are the aspects of the study that were limiting? What can be done to foster improvements so that the European standard can be met? It’s quite hard to pinpoint one or two things that may have made our results better than those of our predecessors, because (1) previous work favored realism over experimental control, and (2) there has been no common data set on which to perform competitive evaluations. The issue of experimental control, however, is likely to be responsible for much of our success. Although the work described in the literature does not admit to any particulars in controlling experiments, our own work is very tightly controlled. The instrumentation was high resolution with well-calibrated error bounds; operating system and network noise were controlled; and extraneous variables (e.g., keyboard type, passcode length, typing inconsistency, etc.) were eliminated. Every subject received the same instructions, and was proctored by the same experimenter; everyone typed with the index ſnger of the right hand. All of this suggests strongly that the differences in subjects were due to individual differences among subjects, and not to apparatus or environment. We also had more subjects (28) than many studies do, more typing repetitions (200), and a longer passcode (10 characters). Larger subject pools, however, sometimes make things harder, not easier; when there are more subjects there is a higher probability that two subjects will have similar typing rhythms, resulting in more misclassiſcation errors. Finally, we used a classiſer (random forest) that may itself have outperformed competitive classiſers (some other studies have also used the random forest, but without results competitive to ours). Until there is a comparative study that stabilizes these factors, it will be hard to be deſnitive about the precise elements that made this work successful. Opportunities for improvement. What prevented us from doing better, and how can current knowledge be turned toward improving our results? Three factors are readily apparent. First, our environment was quite impoverished – the keypad and one ſnger. By enriching the environment to include all keyboard keys and characters, as well as allowing all ſngers to be used for typing, more information
978-1-4244-7499-8 /10/$26.00 ©2010 IEEE
8 Limitations
It’s very hard to compare results in keystroke experiments, because neither the evaluation methodologies nor the ſgures of merit used by the discipline are consistent. Our attempt to level the playing ſeld was to use cost of error as a metric. As a one-number summary, this is a good estimate of performance, but like equal-error rates (EER) it does not admit the details of the trade-off between misses and false alarms. We are aware that to calculate cost-oferror scores from equal-error rates is risky, since a point on the ROC curve other than the EER could result in a lower cost-of-error score for the classiſer/detector. However, to use EERs in this way, trying to arrive at a common scoring mechanism, was the best we could do at this time.
9 Conclusion
We have shown gains in keystroke dynamics performance of roughly an order of magnitude in cost and error over previous results. Through controlled experiments we have come closer to meeting the European requirements for authentication systems, with 99.97% correct detections and 1.51% false alarms. We need to further improve results, and to attain them in more realistic settings, now that we have shown what can be achieved in controlled conditions, and have factored out at least the obvious alternative explanatory factors, save the keystroke rhythms themselves.
10 Acknowledgements
The authors thank Patricia Loring for running the experiments, Fahd Arshad for contributions to system software, Harvey Vrsalovic for clock timing, and Rachel Krishnaswami and Kymie Tan for insightful comments and helpful advice. This work was supported by National Science Foundation grant number CNS-0716677, and by CyLab at Carnegie Mellon under grants DAAD19-02-1-0389 and W911NF-09-1-0273 from the Army Research Ofſce.
References [1] Alliance for Telecommunications Industry Solutions. U.S. Numbering and Dialing Plan within the United States. Standards document ATIS-0300076, ATIS, Washington, DC, August 2005. [2] V. Barnett. The study of outliers: Purpose and model. Journal of the Royal Statistical Society: Series C (Applied Statistics), 27(3):242–250, 1978.
209
DSN 2010: Maxion & Killourhy
2010 IEEE/IFIP International Conference on Dependable Systems & Networks (DSN)
[19] A. Liaw and M. Wiener. Classiſcation and regression by random forest. R News: The Newsletter of the R Project, December 2002. [20] D.-T. Lin. Computer-access authentication with neural network based keystroke identity veriſcation. In IEEE International Conference on Neural Networks, pages 174–178. IEEE Computer Society Press, 1997. [21] D. Meyer, F. Leisch, and K. Hornik. Benchmarking support vector machines. Technical Report 78, Wirtschaftsunivsitat (Vienna University of Economics and Management Science), Vienna, Austria, November 2002. [22] M. S. Obaidat and B. Sadoun. Veriſcation of computer users using keystroke dynamics. IEEE Transactions on Systems, Man, and Cybernetics, Part B: Cybernetics, 27(2):261–269, April 1997. [23] A. Ogihara, H. Matsumura, and A. Shiozaki. Biometric veriſcation using keystroke motion and key press timing for atm user authentication. In International Symposium on Intelligent Signal Processing and Communication Systems (ISPACS-2006), pages 223–226, 2006. [24] T. Ord and S. M. Furnell. User authentication for keypadbased devices using keystroke analysis. In Proceedings of the Second International Network Conference (INC-2000), pages 263–272, 3-6 July 2000. [25] A. Peacock, X. Ke, and M. Wilkerson. Typing patterns: A key to user identiſcation. IEEE Security and Privacy, 2(5):40–47, September/October 2004. [26] R Development Core Team. R: A Language and Environment for Statistical Computing. R Foundation for Statistical Computing, Vienna, Austria, 2007. [27] R. N. Rodrigues, G. F. Yared, C. R. do N. Costa, J. B. YabuUti, F. Violaro, and L. L. Ling. Biometric access control through numerical keyboards based on keystroke dynamics. In D. Zhang and A. K. Jain, editors, International Conference on Biometrics (ICB-2006), Lecture Notes in Computer Science (LNCS) #3832, pages 640–646, Berlin, 05-07 January 2006. Springer-Verlag. Hong Kong. [28] T. A. Salthouse. The skill of typing. Scientiſc American, 250(2):128–135, February 1984. [29] W. Schneider and R. M. Shiffrin. Controlled and automatic human information processing: I. Detection, search, and attention. Psychological Review, 84(1):1–66, January 1977. [30] R. M. Shiffrin and W. Schneider. Controlled and automatic information processing: II. Perceptual learning, automatic attending, and a general theory. Psychological Review, 84(2):127–190, March 1977. [31] J. A. Swets and R. M. Pickett. Evaluation of Diagnostic Systems: Methods from Signal Detection Theory. Academic Press, New York, 1982. [32] J. W. Tukey. Exploratory Data Analysis. Addison-Wesley, Reading, Massachusetts, 1977. [33] J. L. Wayman. National biometric test center collected works: 1997-2000. Technical report, San Jose State University, San Jose, California, August 2000. [34] E. Yu and S. Cho. GA-SVM wrapper approach for feature subset selection in keystroke dynamics identity veriſcation. In International Joint Conference on Neural Networks (IJCNN), pages 2253–2257. IEEE Computer Society Press, 2003.
[3] N. Bartlow and B. Cukic. Evaluating the reliability of credential hardening through keystroke dynamics. In International Symposium on Software Reliability Engineering (ISSRE-06), pages 117 – 126, Los Alamitos, CA, 2006. IEEE Computer Society Press. [4] F. Bergadano, D. Gunetti, and C. Picardi. User authentication through keystroke dynamics. ACM Transactions on Information and System Security (ACM TISSEC), 5(4):367–397, November 2002. [5] S. Bleha, C. Slivinsky, and B. Hussien. Computer-access security systems using keystroke dynamics. IEEE Transactions on Pattern Analysis and Machine Intelligence, 12(12):1217– 1222, December 1990. [6] L. Breiman. Random forests. Machine Learning, 45(1):5– 32, October 2001. [7] W. L. Bryan and N. Harter. Studies in the physiology and psychology of the telegraphic language. Psychological Review, 4(1):27–53, January 1897. [8] R. Caruana and A. Niculescu-Mizil. An empirical comparison of supervised learning algorithms. In W. W. Cohen and A. Moore, editors, 23rd International Conference on Machine Learning, pages 161–168, 2006. [9] CENELEC. European Standard EN 50133-1: Alarm systems. Access control systems for use in security applications. Part 1: System requirements, 2002. Standard Number EN 50133-1:1996/A1:2002, Technical Body CLC/TC 79, European Committee for Electrotechnical Standardization (CENELEC). [10] S. Cho, C. Han, D. H. Han, and H.-I. Kim. Web-based keystroke dynamics identity veriſcation using neural network. Journal of Organizational Computing and Electronic Commerce, 10(4):295–307, 2000. [11] N. Clarke, S. Furnell, B. Lines, and P. Reynolds. Keystroke dynamics on a mobile handset: A feasibility study. Information Management & Computer Security, 11(4):161–166, 2003. [12] N. Clarke, S. Furnell, B. Lines, and P. Reynolds. Using keystroke analysis as a mechanism for subscriber authentication on mobile handsets. In D. Gritzalis, S. D. C. di Vimercati, P. Samarati, and S. Katsikas, editors, IFIP TC11 18th International Conference on Information Security (SEC-2003), pages 97–108, Boston, Massachusetts, 2003. Kluwer Academic Publishers. Security and Privacy in the Age of Uncertainty. [13] N. L. Clarke and S. M. Furnell. Advanced user authentication for mobile devices. Computers & Security, 26(2):109– 119, March 2007. [14] N. L. Clarke and S. M. Furnell. Authenticating mobile phone users using keystroke analysis. International Journal of Information Security, 6(1):1–14, January 2007. [15] W. E. Cooper, editor. Cognitive Aspects of Skilled Typewriting. Springer-Verlag, New York, 1983. [16] R. S. Gaines, W. Lisowski, S. J. Press, and N. Shapiro. Authentication by keystroke timing: Some preliminary results. Technical Report R-2526-NSF, Rand Corporation, Santa Monica, California, May 1980. [17] M. Gladwell. Blink: The Power of Thinking without Thinking. Little, Brown and Co, New York, 2005. [18] K. Kotani and K. Horii. Evaluation on a keystroke authentication system by keying force incorporated with temporal characteristics of keystroke dynamics. Behaviour & Information Technology, 24(4):289–302, July 2005.
978-1-4244-7499-8 /10/$26.00 ©2010 IEEE
210
DSN 2010: Maxion & Killourhy