Knowing Where and When to Look in a Complex Time-Critical Dual Task Anthony J. Hornof and Yunfeng Zhang Computer and Information Science University of Oregon Eugene, OR 97403 USA
[email protected]
Tim Halverson Air Force Research Laboratory 6030 South Kent St. Mesa, AZ 85212 USA
[email protected]
ABSTRACT
quickly as possible so that they can return to the primary critical task as quickly as possible.
High-performance time-critical human-computer systems for use in multitasking environments need to be designed with an understanding of how human cognitive strategies can coordinate the interleaving of perceptual, memory, and motor processes. This paper presents eye movement data collected for a tightly-controlled, highly-motivated, practiced dual task. In the primary task, participants tracked a target with a joystick. In the secondary task, participants keyed-in responses to objects moving across a radar. Task manipulations included: whether the currently unattended task’s stimuli were visible; presence or absence of auditory cues; and the number of radar objects to classify in succession. Eye movement analysis demonstrates that participants developed fundamentally different strategies to perform the two tasks in parallel under the various task manipulations. The experiment provides a rich set of data to guide the development of models and theory of human performance in complex dual task scenarios.
Psychological theories, such as those embedded in cognitive architectures—computational frameworks for building simulations of human performance—used for predicting performance in HCI tasks accommodate the potential for extensive overlapping of perceptual and motor processing across tasks and subtasks. Cognitive models built (often using these architectures) to simulate human information processing rely on such overlapping to explain aspects of human performance. Yet there are limited data available to measure and demonstrate the extent to which such overlapping occurs in high performance, time-critical, multitasking environments, and to develop, tune, and validate these architectures and models. A constraint-satisfaction approach to predicting skilled human-computer interaction posits that, with practice and motivation, people will develop elaborate strategies limited primarily based on a human’s ability to allocate perceptual and motor resources [13]. Rich data sets are needed to evaluate the theory across multiple tasks in parallel, and with fine-grained eye movement data. Work done to unify previous theories of multitasking for the benefit of humancomputer interaction advances the notion of independent human processing modules used in an overlapped interleaved manner across multiple tasks, but more detailed data sets are needed to evaluate these theories as well [12].
Author Keywords
Auditory displays, cognitive strategies, eye tracking, timecritical tasks, multimodal interfaces, multitasking, visual displays. ACM Classification Keywords
H.5.2. [Information Interfaces and Presentation]: User Interfaces – Evaluation/methodology, graphical user interfaces (GUI), screen design, theory and methods; H.1.2 [Models and Principles]: User/Machine Systems; I.2.0 [Artificial Intelligence]: General – Cognitive simulation.
Previous research [7, 9] developed some very specific cognitive models of human performance for a dual task experiment developed in the early 1990s at the Naval Research Laboratory (NRL), but these models were based entirely on reaction time data, with no eye tracking data available to inform the simulation of interleaved and overlapping processes.
INTRODUCTION
An important task domain for human-computer interaction (HCI) is high-performance, time-critical, real-time systems intended to support multiple tasks in parallel. This domain is of great interest to designers of devices that might be used in parallel with a life-critical task such as systems intended for air-traffic control, in-car navigation, and emergency evacuation. Such devices present users with the challenge of accomplishing a secondary task, such as providing manual responses to visual information as
This paper revisits and extensively enhances the NRL dual task, both in experimental design and high fidelity data collection, to provide unique insights into how people develop complex interleaved cognitive strategies to coordinate and overlap perceptual processing and motor responses both within and across multiple tasks. Previous versions of the task contributed to insights for designing useful and usable interfaces for time-critical multitasking [2], guided the development of computational cognitive models [7, 9] of the task as well as general purpose cognitive architectures for predicting human performance across a wide range of tasks [8].
Submitted to ACM CHI 2010. Please do not cite or distribute.
1
10°
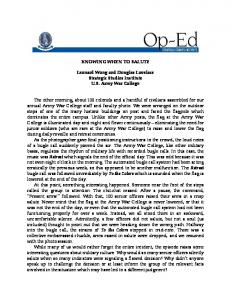
Figure 1. A screenshot of the task display annotated with two dashed lines that show the most common eye movements observed, between the tactical blips on the left and the tracking target on the right. Tactical blips were black before they were ready for classification; red, green, or yellow when ready; and white after classification. Progress bars below the windows indicate that the participant is doing quite well on tracking, but needs to work harder on the tactical. A scale shows 10° of visual angle.
Detailed eye movement analyses, presented here, provide unique insights into (a) the substantial overlapping of processing that is accomplished and exhibited in timecritical tasks, (b) how people know where and when to put their high resolution visual processing (their gaze) in a complex task, and (c) the manner in which spatialized audio cues can be used to enhance a visual display to support high performance execution of multiple tasks in parallel. The experiment also provides a constellation of data points that can be used to evaluate and guide the construction of computational cognitive models of the human information processing used to accomplish complex multimodal dual tasks. The analyses demonstrate how eye movement data can reveal much more than just summary statistics, but instead fundamental aspects of task strategy [11].
consecutive days, and were paid based on their speed and accuracy. Monetary payment schemes are routinely used in psychological experiments to discover the level of performance that people would likely achieve in real-world tasks that require optimal human performance [10]. Figure 1 shows a screenshot from the experiment. The tactical and tracking tasks were preformed in parallel and presented on one physical monitor. Each task utilized a separate visual display separated by 2.5 degrees of visual angle. The tactical task was presented on the left and the tracking task on the right. Tactical Task
A series of blips—32 x 32 pixel icons—appeared at random locations in the tactical display and moved from top to bottom. Three types of blips were used; each with distinguishing visual characteristics such as shape. Blips appeared in waves in which 1, 2, 4, 6, or 8 blips were visible at the same time.
METHOD
An experiment was conducted in which participants performed a complex, interleaved dual task that included two visual displays, time-pressured manual responses to stimuli on both displays, and an auditory display to enhance performance on the secondary (radar) display. The task used in this study builds on and extends a task used in previous HCI studies [2].
Participants were motivated to quickly and accurately classify each blip by keying-in that blip’s number and a designation of hostile or neutral. Designation was determined based on a set of rules involving a blips shape, color, and movement. When auditory cues were present, a blip’s color was indicated with auditory cues. Sounds were adapted from [4]. Touch typing was enforced.
Twelve participants, seven female and five male, between the ages of 18 and 51 (M = 26.8) from the University of Oregon and surrounding communities successfully completed the experiment. Each participated on three
Each blip progressed on the display as follows: When each blip first appears on screen, it is black. At this point, the
2
Procedure
blip displays the characteristics (shape, heading, and velocity) that indicate its hostility, but the participant cannot respond to the blip. When auditory cues are used, a woodblock-like sound indicates the appearance of the blip. Four to twenty-nine seconds later, the blips changed color to either green, red, or yellow. At this point, the participants could identify the blips using the keypad. After ten seconds, the blip would disappear. Successfully classified blips changed to white.
The experiment is a 2x2x5 within-subjects design. Three factors were manipulated: (a) peripheral visibility on or off, (b) the presence or absence of auditory cues, and (c) wave size. Peripheral visibility manipulates whether participants could see the contents of the other window—tactical or tracking —that they were not currently looking at. When peripheral visibility is on, all visual information is available all the time. When it is off, the participant can only see the information (blips or tracking icons) on the display that he or she is currently looking at. This was accomplished by having the eye tracker report gaze position at a rate of 60Hz, and updating display contents within 40 ms of the eyes moving between windows. This simulates a task environment in which a user must monitor two visual displays that are sufficiently separated such that the eyes must move between displays in order to perceive their content.
When the auditory cues were used, the location of each blip was indicated by the location of a spatialized auditory cue. To enable the participants to more accurately map the locations in auditory space to the locations in the visual space, auditory cues were transformed using a horizontal arc transformation validated in a previous study [6]. Participants were monetarily motivated as follows: Every time a blip appeared, they received six cents. For every second that passed before a blip was classified, one cent was lost. Every time a blip was incorrectly classified or not classified before it disappeared, the participant lost any possible bonus for that blip and was penalized an additional five cents. Any time another error occurred discussed in the last paragraph, the participant was penalized one cent.
On each of three consecutive days, participants completed four scenarios, each lasting about 8 minutes. Each scenario maintained a unique combination of (a) peripheral visibility on or off and (b) auditory cues on or off. The third factor, wave size, was varied within each scenario. Each scenario included sixteen waves. There was usually a one second pause between each wave, with a 10 second pause after fifth wave and eleventh waves.
Across all conditions, participants were provided with extensive visual and auditory feedback to motivate good performance. A status bar below the tactical display indicated how much the participant had earned with the previous ten blips. Additionally, every time a blip was correctly identified, a pleasant “cha-ching” sound was played. Every time a blip was incorrectly identified or the participant entered an invalid key (e.g. a blip number that is currently not on screen), an annoying buzzer sounded. Other errors (e.g. taking too long to enter both blip number and hostility) resulted in a distinct but less annoying “bloop” sound.
Participants were trained to criteria on all aspects of the individual tasks before they were permitted to start the dual task portion of the experiment and earn bonuses. Visual stimuli were presented on a 1280x1024 LCD display with a Dual 2.5GHz PowerMac G5 running OS X 10.4.11. The auditory display was presented through Sennheiser HD250 headphones and generated by a VRSonic SoundSimCube. Eye movements were recorded using an LC Technologies dual-camera eye tracker. A chinrest was used to maintain a constant eye-to-screen distance.
Tracking Task
The tracking task, performed in parallel with the tactical task, required the participants to keep a circle over a moving target. The target was difficult to track for two reasons: First, the target moved in an unpredictable manner. Second, the joystick controlled the velocity of the circle.
Post hoc eye movement data error correction was conducted using the RFL (required fixation detection) technique [5]. The technique was extended to incorporate moving RFLs (the blips), and to incorporate multiple error-correction signatures across each eight-minute scenario.
Participants were monetarily motivated to track well. Tracking accuracy was calculated from center of the circle to the center of the target. For every two seconds that the participant was tracking well (within 0.5 degrees of visual angle), the participant received slightly more than one cent. For every two seconds the participant was not tracking well (greater than 1.3 degrees of visual angle), the participant lost slightly more than one cent.
RESULTS AND DISCUSSION
A tremendous amount of data was collected and analyzed. We believe that we have distilled this data down to a number of critical probe points that can be used to reveal how people did the task. We organize the data around (a) top-level results, (b) evidence of how participants adjusted their task strategies to respond to task challenges, (c) how participants decide when and where to move their eyes for the tactical task, and (d) how spatialized audio was used in the task.
Participants were provided with visual feedback to motivate good performance. Whenever the participant was receiving money, the circle was highlighted in green. Whenever, the participant was loosing money, the circle was highlighted in red. Further, a status bar below the tracking display represented their average error over the past 40 s.
Top Level Results
A high-level first pass of the top-level performance across the three days and four conditions demonstrates that the
3
experiment successfully captured highly motivated timecritical multitasking performance.
95%
2.5
2
Mean Accuracy
Sound N Y
Peripherally N Visible Y
75% 70% 2
3
Figure 4 shows the mean tracking error—the average distance between the tracking cursor and the tracking blip. Important trends are as follows: For all conditions, error decreased across the three days, p < .001. Tracking error was always greater when no peripheral visual information was available (p < .001), but the difference decreased on Days 2 and 3.
Sound N Y
2.0 1
80%
Figure 3. The percent of blips classified correctly as a function of day for each of the four conditions.
3.5 Peripherally N Visible Y
85%
Day
4.0
3.0
90%
1
Tracking Error (pixels)
Classification Time (s)
Figure 2 shows the mean blip classification time across all participants and all days.1 Important trends in the data are as follows: Peripheral visible conditions are faster, and peripheral not-visible conditions are slower, F(1, 105) = 98.9, p < .001. Whether sound is on or sound is off only makes a difference when peripheral information is not visible, t(105) = -2.95, p = .003. Performance improves across the three days, F(2, 22) = 36.1, p < .001. Three of the four conditions show a negatively accelerating downward slope approaching asymptotic performance, whereas one condition (peripheral not visible and sound on) shows a positively accelerating downward slope that is not approaching asymptotic performance.
3
Day Figure 2. Blip classification time as a function of day, for each of the four conditions.
In three of the four conditions shown in Figure 2, performance appears to be approaching an asymptote, as is observed as people learn a task over time. In one condition, however, the peripheral-not-visible and sound-on condition, performance does not appear to be approaching an asymptote. This trend suggests that, in this condition, participants did not just make small improvements to their strategy execution from Day 1 to Day 3, but rather that along the way they adopted a fundamentally different strategy. It appears as if participants may have learned how to use the sound to better monitor what was happening in tactical display when it was not visible. As suggested by the overlapping of filled symbols in Figure 2, when peripheral visual information is available, sound did not improve blip classification times, t(105) = 0.28, p = .78.
35 30 Peripherally N Visible Y
25
Sound N Y
20 1
2
3
Day Figure 4. Mean tracking error (in pixels) as a function of day for each of the four conditions.
Considering blip classification time in conjunction with the tracking error demonstrates that the experimental design, performance feedback, and payment scheme all worked well together to motivate participants to (a) work hard to improve their performance for both the tracking tactical tasks across all three days and (b) balance their performance appropriately between tasks—this is demonstrated by participants performing both the tactical and tracking tasks slightly worse when peripheral visual information was not available. The degraded performance in the tactical task when peripheral information is not available cannot be explained by participants simply spent more time and resources on the tracking task. Clearly both tasks were harder and performance suffered in both.
Figure 3 shows how the percentage of blips classified correctly increased with each day, and how accuracy (along with classification times) was better in the peripheralvisible condition. Participants did not simply shift their speed-accuracy operating criterion [10] based on the condition.
Eye movement data were first analyzed at a high level to explore fundamental aspects of how participants did the task. Two results include: (a) Participants made 98% of their eye movements to either the tactical or tracking display (as opposed to the text output, status bars, or elsewhere), demonstrating that participants maintained
___________________________________________________________ 1. A consistent set of plot symbols is used for all of the graphs that show the four combinations of factors. Perhaps use the following mnemonic device to recall the symbols: Filled symbols are used when peripheral visual information is available because filled symbols have more visual information. Triangles are used to show that auditory cues are available because triangles contain more “points” of information than circles.
4
on the tracking display. Important trends are as follows: With peripheral visual information, eye movements (or saccades) to the radar display were initiated much earlier than with no peripheral visual information, F(1, 105) = 239, p < .001. With peripheral visual information, sound on or off made little or no difference, t(105) = -0.76, p = .45. With no peripheral visual information (unfilled symbols), whether sound was on or off made a big difference, t(105) = -4.27, p < .001. The time to move the eyes to the tactical display decreased across the three days, F(2, 22) = 13.3, p < .001. Note how the eye-to-tactical times in Figure 6 closely resemble the classification times shown in Figure 2, suggesting that the time required to get the eyes to the tactical display directly impacts blip classification time.
100% 80% 60%
Tracking Tactical
40% 20% 0% 1
2
3
Time Interval (s)
Percent of time gaze on display
strict focus on these two tasks. (b) Participants spent 80% of their time looking at the tracking display, as shown in Figure 5, demonstrating that participants treated the tracking as the “primary” task, thus permitting us to consider the tactical task as a secondary task conducted alongside a primary task such as steering a car.
Day Figure 5. Percentage of total task time that participants’ gaze was on the tracking versus tactical task display as a function of day.
A first-pass of the data suggests that the experiment successfully motivated participants to maximize their performance potential in a time-critical complex multitasking environment. We might conclude that Day 1 performance is that of a novice, and Day 3 performance is starting to approach that of an expert. Performance improvements across the three days demonstrate that feedback and payment scheme motivated participants to maximize their potential performance. It is reasonable to conclude that the micro-level perceptual and motor decisions (such as eye movements) made on Day 3 are in general superior to those made on Day 1, and that optimal strategies are emerging.
1.2 1.0 Peripherally N Visible Y
0.8
Sound N Y
0.6 1
2
3
Day Figure 6. The time interval from when a blip changed color (and became ready to classify) to when the eyes moved from the tracking to the tactical display, for each of the four conditions, as a function of day.
As can be seen in Figure 6, when peripheral visual information was available, participants clearly used this to motivate eye movements to the tactical display. These eye movements occurred 674 ms after a blip changed color, regardless of whether auditory cues were available, t(105) = -0.76, p = .45. When peripheral visual information was not available but auditory cues were, participants used the auditory cues to motivate eye movements to the tactical display, arriving about 984 ms after the blip changed color. This use of auditory cues substantially improved across the three days.
A first pass of the data also suggests that auditory cues are only useful when peripheral visual information is not available. Task Challenges and Strategy Adaptations
The experiment varies task difficulty along a number of dimensions, to reveal how human performance changes based on task difficulty, to reveal fundamental perceptual and motor capabilities and limitations, and to reveal how task strategies adjust the integration and interaction of perceptual and motor processing to maximize performance. The data presented are the best performance data to demonstrate how participants responded to manipulations to task difficulty. The primary task challenges are as follows: (1) Peripheral visual information was only sometimes available; (2) auditory cues regarding blip status were only sometimes available; (3) wave size varied from one to eight blips; and (4) yellow blips were harder to classify than red or green.
When neither visual peripheral nor auditory cues were available, participants adapted their task strategy by increasing their number of self-motivated glances over to the tactical display to check for blips to classify, χ2 (1) = 6.76, p = .009. This is most vividly illustrated if we examine gaze counts on black blips, but separately for small waves (one or two blips) versus large waves (four, six, or eight blips). Figure 7 shows the mean number of fixations on each blip while it was black, prior to its color change. As can be seen, participants tended to look at each blip roughly one time while it was black; the one exception is for small waves in the no-peripheral no-sound condition, in which each blip tended to receive roughly two fixations. Separating the counts by wave size emphasizes the selfmotivated glances because, for large waves, the gaze is more likely to already be on the tactical display for a previous blip color change, whereas for small waves,
Task Challenges 1&2: No peripheral visual or auditory cues.
Figure 6 shows the time interval from when a blip changes color (and is ready for classification) to when the eyes move from the tracking to the tactical display, for the 75% of the blip color changes that occurred when the eyes were
5
Preclassify Gaze Count
participants need to make more self-motivated glances. With all of this checking, the eyes arrived on average about 1.2s after each blip changed color. These results summarize the main strategy adaptations to the conditions of peripheral information visible or not, and auditory cues on or off.
2.5
wave size 1 & 2
Day 2 to Day 3, suggesting that truly skilled performance is being developed. This wave size effect should provide excellent guidance for the development of an accurate model of this dual task. Task Challenge 4: Yellow Blips.
Yellow blips present a task challenge (in comparison to red and green blips) in that they require the participant to apply a set of rules to determine the designation based on the blip’s shape, location, speed, and direction. Figure 9 shows that participants handled this additional challenge by fixating these blips for an additional 237 ms (in comparison to red or green) to gather the necessary features, though their classification time was 483 ms longer. Participants required an additional 246 ms to translate the shape, location, speed, and direction of the yellow blips into a hostile or neutral designation after they moved their gaze off the blip.
wave 4, 6 & 8
2.0 1.5 1.0 0.5 0.0 1
2
3
1
2
3
Day Figure 7. The mean number of fixations on black blips, for each of the four conditions, as a function of day. The left frame shows small waves; the right, large.
Time (ms)
Gaze Duration Classification Time
Task Challenge 3: Wave Size.
Increasing the wave size also increased the task difficulty. For waves with four, six, or eight blips, blips typically changed color at a rate of one blip every 2.7 s, whereas the overall mean classification time was 2.9 s. Hence, blips became ready-to-classify at a slightly higher rate than they could be classified, and piled up. Small waves (of one or two blips) had at least 4.5 s between blip color changes, and so there was no pile-up.
Classification Time (s)
Day 2
4
6
8
12
4
6
12
4
6
Yellow
Knowing When to Look
We will next consider how participants moved their eyes in order to successfully perform both tasks in parallel. This should shed light on how people conduct multiple tasks in parallel in a time-pressured HCI situation. In this task, from the P’s perspective, he or she is primarily focused on the tracking task, but is alert for blips that need to be classified. Participants develop strategies for determining when a blip has changed color. We next trace the events that reveal the processes and strategies that participants use to decide when to move their eyes to perform the tasks; this will be followed by a discussion on deciding where to look.
Day 3
8
Green
Strategy adaptations in response to task challenges offers evidence of complex interleaved cognitive strategies to coordinate and overlap perceptual processing and motor responses both within and across multiple tasks, such as how people will adjust their behavior based on the presence or absence of task-relevant auditory and visual cues. The data provide guidance for building and evaluating cognitive models of the task.
4.5 4.0 3.5 3.0 2.5 2.0 1.5 12
Red
Figure 9. The time spent fixating and classifying blips.
Figure 8 shows blip classification times as a function of wave size, for each of the three days. The positive slopes in the curves shows how, in general, classification time increases with wave size, β = 130, t(574) = 10.4, p < .001. This is especially true in peripheral-available conditions on Day 1, but the slope starts to level off by Day 3. Participants responded to this increased challenge not so much with an altered strategy, but simply by speeding their classification times with practice. The one modification to task strategy appears to be an increased use of auditory cues when no peripheral information was available, particularly between days two and three. This can be seen in how the unfilled triangles pull away from the unfilled circles from Day 1
3500 3000 2500 2000 1500 1000 500 0
The main motivation to look at the tactical display is to get the information needed to classify a blip after it changes color. Knowing when to move the eyes for this reason requires participants to determine when blips change color. Once this is determined for a particular blip, there are generally three eye movements involved in classifying that
8
Wave Size Figure 8. Blip classification time as a function of wave size, for each of the four conditions. The three panels show performance across the three days.
6
3. Eyes to Tracking.
1200
Peripherally N Visible Y
1000
Once the gaze lands on a target blip, its stays there just long enough to gather up the visual features needed to classify that blip, and then returns to the tracking. The duration is constant across all conditions, as shown in the convergence of all lines onto a single point in Figure 10. Figure 9 showed that this duration is 440 ms for red or green blips, and 678 ms for yellow blips. Figure 11 shows how participants reduced this duration decreased by about 200 ms across three days of practice, but appear to have arrived at a somewhat optimal duration by Day 3.
Sound N Y
800 600 400 200
Gaze Duration (ms)
Time Preceeding Movement (ms)
1400
0 Eyes To Tactical
Eyes Eyes To Tracking To Target
Movements to Classify a Blip Figure 10. Movement times across the lifetime of a colored blip. The horizontal axis shows the subtasks: Get the eyes from the tracking to the tactical display; get the eyes onto the target blip; and get the eyes back to tracking.
700 650 600 550 500 1
blip: (1) Eyes from tracking to tactical, (2) eyes to target (the blip that changed color), and (3) eyes back to tracking. Figure 10 shows a sort of timeline of the time intervals preceding each of these three events.
2
3
Day Figure 11. The time spent looking at a blip while it was in its colored state (and thus ready for classification) as a function of day.
Figure 10. Mean performance times across the lifetime of a colored blip, from when a blip changes from black to colored, to when the eyes leave the blip and it is classified. The horizontal axis shows the subtasks: Get the eyes from the tracking to the tactical display; get the eyes onto the target blip to classify; and get the eyes back to the tracking display.
Examination of Blips Prior to Color Change
Aside from moving the eyes to classify a blip, there is potentially another motivation to move the eyes to the tactical display—to gain and maintain situational awareness that could reduce the classification time for a black blip after it changes color. It is possible, for example, to determine a blip’s classification while it is still black, though this would require as much work as classifying a yellow blip. Short of this, it is potentially useful simply to track the location of blips to assist with eye movements to those blips once they change color. We refer to these glances at blips while they are still black at preclassification fixations.
1. Eyes to Tactical (to Classify a Blip)
There are three ways to know when to move the gaze to a target blip: The participant sees the color-change in their periphery, hears an auditory cue, or decides it is time to make the next self-motivated movement. The overall eyesto-tactical response times are shown as the first event in Figure 10, and were broken out further in Figure 6, earlier. Participants respond most quickly when color-change events are peripherally visible (674 ms), and more slowly to just auditory color-change cues (984 ms). In the noperiphery no-sound condition, self-paced or otherwise motivated, lead to roughly 1.2s eye-to-tactical delays. The three triggers for eyes-to-tactical movements are perhaps typical for visual-stimulus-motivated intermittent secondary tasks: Participants see something, they hear something, or they decide that it is just time to check. Our data suggest that a visual stimuli in the near periphery is best, and an auditory cue is second-best.
Preclassify Gaze Count
Figure 12 shows the number of pre-classification fixations made on black blips. The graph is similar to that Figure 7 but collapsed by wave size. As noted earlier, each blip
2. Eyes to Target
After the gaze arrives on the tactical display, it needs to move to the target blip. This time relates directly to where the eyes landed, which will be discussed shortly. The eyesto-target time (shown in Figure 10) is lowest when peripheral information is available because these eye movements often land directly on the target.
1.4 1.2 1.0
Peripherally N Visible Y
Sound N Y
0.8 1
2
3
Day Figure 12. The mean number of fixations on black blips, for each of the four conditions, as a function of day.
7
received roughly one fixation while it was still black. There is substantial evidence that participants kept track of at least some information regarding blips before they changed color. In the no-periphery no-sound condition, the number of pre-classification glances increased across the three days, suggesting that, for this condition, maintaining situational awareness is part of skilled, expert behavior.
visual information to move the eyes directly to the target. Note that, as the distance to the target blip increases, participants’ ability to move the eyes directly to the target decreases from roughly 75% to 50%, though the chance of getting there in two eye movements increases from 10% to 20%. It is difficult to tease apart how much of the 25% decrease in first-fixations results from the fact that longer saccades tend to undershoot, necessitating a secondary correctional saccade [1]; and how much from the fact that visual feature availability degrades as angular distance from the point of gaze increases [3]. However, the 10% increase in second-fixations suggests that it is a combination of the two. (A 25% increase in second-fixations would suggest it was all undershoots; a 0% increase would suggest it was all visual availability.)
As can be seen in Figure 12, auditory cues significantly reduced the number of pre-classification glances, χ2 (1) = 14.7, p < .001. It appears as if participants used sound instead of eye movements to maintain situational awareness, even when peripheral information is visible. Note that this is the first graph in which the solid symbols are clearly separated. This is the first evidence that participants used sound to assist with the task even when peripheral visual information is available.
First Fixation Second Fixation Missed
These performance details pertaining to when people move their eyes in a time-pressured multitasking situation would seem to be important components when modeling how people conduct such tasks, and when designing systems to support multitasking performance.
Percentage
80%
Knowing Where to Look
Percent of Eyemovements Directly to The Target
There were clear task benefits if, after a blip changed color, the eyes could be moved directly to that blip with a single eye movement. There are potentially three ways that participants can know the location of a blip that just changed color: peripherally available visual information, memory of blip location based on previous glances to the tactical display, and auditory cues. There is clear evidence that participants used all three. Figure 13 shows the likelihood that an eye movement to the tactical display after a blip changed color would land directly on that blip (or within 2° of visual angle of the blip). This graph provides evidence of how people figured out where to look.
60% 40% 20% 0%
4.7° to 14.3°
14.3° to 18.2°
18.2° to 21.0°
21.0° to 28.7°
Range of Saccade Size (degrees of visual angle)
80%
Figure 14. The percentage of eye movements to the tactical display that land on the target in one fixation, in two fixations, or that miss the target in that visit to the display; as a function of the distance from the gaze position to the target location. Only peripheral-visible conditions are included.
60%
Memory of blip location
40% Peripherally N Visible Y
20%
Figure 13 suggests that participants clearly maintained some situational awareness of blip locations. Though the percentage of eye movements directly to the target are very low (around 20%) when there is no peripheral visual information, note that this is above chance, which we estimate at around 10% if we take into consideration display dimensions. It appears as if this knowledge was used in about 10% of the eye movements to the tactical display.
Sound N Y
0% 1
2
3
Day Figure 13. The percentage of eye movements to the tactical display in which the gaze lands on the blip that just changed color.
Auditory cues
Auditory cues help in a number ways to get the eyes to the target. Looking at Figure 13, sound alone did not help to direct the eyes directly to the target blip. As illustrated in Figure 13, with no peripheral visibility, sound has no effect on getting the eyes directly to the target. Sound does help to get the eyes to the target with peripheral visibility available, z = 4.92, p < .001. We suspect that the sound reinforces the peripherally visible information, potentially to draw visual attention to the object that just changed. It might also be that color information encoded in the sound
Peripherally visible color change
If the tactical display was visible in the periphery, participants used this visual information to move the gaze directly to the target, z = -21.9, p < .001. Figure 13 illustrates this with the high percentages for peripheralvisible conditions. Figure 14 shows additional evidence regarding participants’ ability to use peripherally visible
8
Time Preceeding Movement (ms)
(high pitch for red, medium pitch for yellow, low pitch for green) is used to reinforce which blip is the target. But overall, sound does not appear to have a profound effect in directing the eyes to a target if good visual information is available. Though sound alone does not help to get the first eye movement to the target blip, as shown in Figure 13, participants do somehow use that information to prepare for or execute better performance after the eyes arrive on the tactical display. This can be seen in the eyes-to-target time in Figures 10 and 15. Perhaps auditory information, such as the blip color that is encoded in the alert sound, was used to assist with the selection or tuning of the search strategy that is used once the eyes arrive on the tactical display. Recall that the auditory cues were carefully spatialized such that the sound appeared in virtual space at a location that indicated the blip’s location on the tactical display. Our analysis of the data has yet to reveal any clear effect or benefit from the spatialized aspect of the auditory cues. This is consistent with the mediocre benefits of spatialized audio demonstrated in a similar task environment [6].
2000 1800 1600
Peripherally N Visible Y
Sound N Y
1400 1200 1000 800 600 400 200 0 Eyes To Tactical
Eyes Keypress (dashed) To Target and Eyes To Tracking
Movements to Classify a Blip Figure 15. Movement times across the lifetime of a colored blip. As in Figure 10, the horizontal axis shows the subtasks, with the additional final step of the keypress to start classifying that blip (dashed lines) in parallel with getting the eyes back to the tracking display (solid lines).
The data presented here demonstrate that in a complex time-critical dual task situation involving multiple visual displays, people use a range of perceptual and strategic decisions to determine when and where to move their eyes. Consistent with perhaps many visual-stimulus-motivated secondary HCI tasks, eye movements are initiated after auditory or peripheral visual information is perceived, or after self-paced intervals with durations that are set based on performance expectations. Best performance is achieved with peripherally visible cues. The eyes stay at locations just long enough to gather visual features necessary to accomplish a subtask, and then move on to the next subtask. Some eye movements are clearly used to accomplish immediate tasks, whereas others are used to build and maintain some sort of representation of what is happening in secondary displays that are not visible in the periphery. These processes and strategic details determine when and where participants move their eyes, and should be considered in predictive models of complex dual tasks performance, and when designing devices for use in timecritical dual-task environments.
the keypress; this vertical distance represents an overlap between various processing required for the tactical and tracking tasks. Participants clearly move their eyes off of blips as quickly as possible, staying only long enough to gather the needed visual features, and then process these features to produce a response choice after moving the eyes back to tracking. Four participants, three of whom were the best-performing participants, demonstrated a somewhat complex task strategy that permitted them to classify blips without looking at those blips after they changed color. We call these blind classifications. Four participants each exhibited an average of 86 number of such classifications (12.6% of all classifications). Blind classifications can only occur if a participant studies a blip when it is black and, at the very least, commits that blip’s number to memory. These classifications represent a parallel execution of the tactical task without even moving the eyes from the tracking task. Further analysis might also reveal that the spatialized component of the audio was useful for blind classifications.
Overlapped Performance
Consistent with theories and approaches to predictive modeling (EPIC, ACT-R, Vera), participants exhibit evidence of perceptual and motor processing that is overlapped and interleaved to maintain very good parallel performance on two demanding tasks. The high-speed coordination of eye movements and perceptual processing between the two visual displays, both to classify blips but also to maintain situational awareness, demonstrates a complex interleaving of processing between the two tasks. Figure 15 reproduces Figure 10 but now adds the keypress time to the pseudo-timeline; the dashed lines indicate how much additional time is required to key-in a blip more than a second after the eyes have moved back to the tracking task. This can be seen in the vertical distance between the plot symbols for eyes-to-tracking and, directly above, for
CONCLUSION
The data demonstrate how, in a complex high speed task involving multiple visual displays and manual responses, (a) people use extensive overlapping of perceptual, motor, memory, and cognitive processing, (b) auditory cues can complement visual information to improve performance especially when visual information is not peripherally visible, (c) subtasks may pile up and interfere with each other unless individual subtasks can be accomplished within intermediary performance deadlines, (d) visibility of secondary displays in the near as opposed to far periphery can improve performance, (e) some cognitive task strategies are better than others, as seen in Day 1 versus Day 3, fast
9
participants versus slow participants, and strategy shifts exhibited with practice.
[3] Bertera, J. H., & Rayner, K. (2000). Eye movements and the span of effective stimulus in visual search. Perception & Psychophysics, 62(3), 576-585. [4] Cabrera, D., Ferguson, S., & Laing, G. (2005). Development of auditory alerts for air traffic control consoles. Paper presented at the 119th Audio Engineering Society Convention, New York, USA. [5] Hornof, A. J., & Halverson, T. (2002). Cleaning up systematic error in eye tracking data by using required fixation locations. Behavior Research Methods, Instruments, and Computers, 34(4), 592-604. [6] Hornof, A. J., Halverson, T., Issacson, A., & Brown, E. (2008). Transforming object locations on a 2D visual display into cued locations in 3D auditory space. Proceedings of the 52nd Annual Meeting of the Human Factors and Ergonomics Society, 1170-1174 [7] Kieras, D. E., Ballas, J., & Meyer, D. E. (2001). Computational Models for the Effects of Localized Sound Cuing in a Complex Dual Task (No. EPIC Report No. 13). Ann Arbor, Michigan: University of Michigan, Department of Electrical Engineering and Computer Science. [8] Kieras, D. E., & Meyer, D. E. (1997). An overview of the EPIC architecture for cognition and performance with application to human-computer interaction. Human-Computer Interaction, 12(4), 391-438. [9] Kieras, D., Meyer, D., & Ballas, J. (2001). Towards demystification of direct manipulation: Cognitive modeling charts the gulf of execution. Proceedings of ACM CHI 2001: Conference on Human Factors in Computing Systems, 128-135. [10] Pachella, R. G. (1974). The interpretation of reaction time in information-processing research. In B. H. Kantowitz (Ed.), Human Information Processing: Tutorials in Performance and Cognition. Hillsdale, New Jersey: Lawrence Erlbaum Associates. [11] Russo, J. E. (1978). Adaptation of cognitive processes to the eye movement system. In J. W. Senders, D. F. Fisher & R. A. Monty (Eds.), Eye Movements and the Higher Psychological Functions (pp. 89-109). Hillsdale, New Jersey: Lawrence Erlbaum Associates. [12] Salvucci, D. D., Taatgen, N. A., & Borst, J. P. (2009). Toward a unified theory of the multitasking continuum: From concurrent performance to task switching, interruption, and resumption. Proceedings of ACM CHI 2009: Conference on Human Factors in Computing Systems, 1819-1828. [13] Vera, A.H., Howes, A., McCurdy, M., Lewis, R.L., (2004) A constraint satisfaction approach to predicting skilled interactive cognition. Proceedings of the SIGCHI conference on Human Factors in computing systems, 121-128.
This research is highly relevant to HCI because designers need to understand what people are doing in these complex, critical tasks, and it is perhaps only through studies such as this that an accurate and detailed understanding can be achieved. This study shows the development and refinement of task strategies for multimodal multitasking performance. Two important insights relate to the adjustment of task strategies across the three days, and the subtle ways that auditory information appears to be useful. Different performance measures evolve along different trends across the three days. Some demonstrate unsurprising asymptotic learning effects, but others suggest fundamental shifts in task strategies such as new decisions on how to use perceptual information. Perhaps most notable are shifts in the use of auditory cues from Day 2 to Day 3. These results suggest that for complex, critical tasks in which any additional information may help—or hurt— performance, a prolonged evaluation is required to permit people to develop complex interleaved tasks and exhibit the improved performance made possible by such strategies. The experiment demonstrates how a first-pass analysis of the data might support a simple conclusion that auditory cues did not affect performance when peripheral information was available. Deeper probing reveals that this is not entirely correct. While there is no clear evidence that participants used the spatialized component of the auditory cues, the cues did permit resourceful participants to (a) constrain search once the eyes arrived on the secondary task display and (b) sometimes accomplish secondary subtasks without even looking at the secondary display. The next step in this research program is to use this rich data set to evaluate and guide the development of computational cognitive models of human performance in complex dual task scenarios. Now that new eye movement data is available for the task, we can already determine that a number of assumptions made in previous models of the task [7, 9] are correct, and others will need revisiting. Computational cognitive modeling, refined with rich sets of human performance data, provides an important scientific foundation to inform the design and analysis of highperformance time-critical human-computer systems. ACKNOWLEDGMENTS
This research was funded by the Office of Naval Research. REFERENCES
[1] Abrams, R. A., Meyer, D. E., & Kornblum, S. (1989). Speed and accuracy of saccadic eye movements: Characteristics of impulse variability in the oculomotor system. Journal of Experimental Psychology: Human Perception and Performance, 15(3), 529-543. [2] Ballas, J. A., Heitmeyer, C. L., & Perez, M. A. (1992, May 3-7, 1992). Evaluating two aspects of direct manipulation in advanced cockpits. Proceedings of CHI '92: ACM Conference on Human Factors in Computing Systems, Monterey. 10